Arapaho 2 or more Vehicles in Household
COMPARE
Arapaho
Select to Compare
2 or more Vehicles in Household
Arapaho 2 or more Vehicles in Household
60.2%
2+ VEHICLES AVAILABLE
100.0/ 100
METRIC RATING
32nd/ 347
METRIC RANK
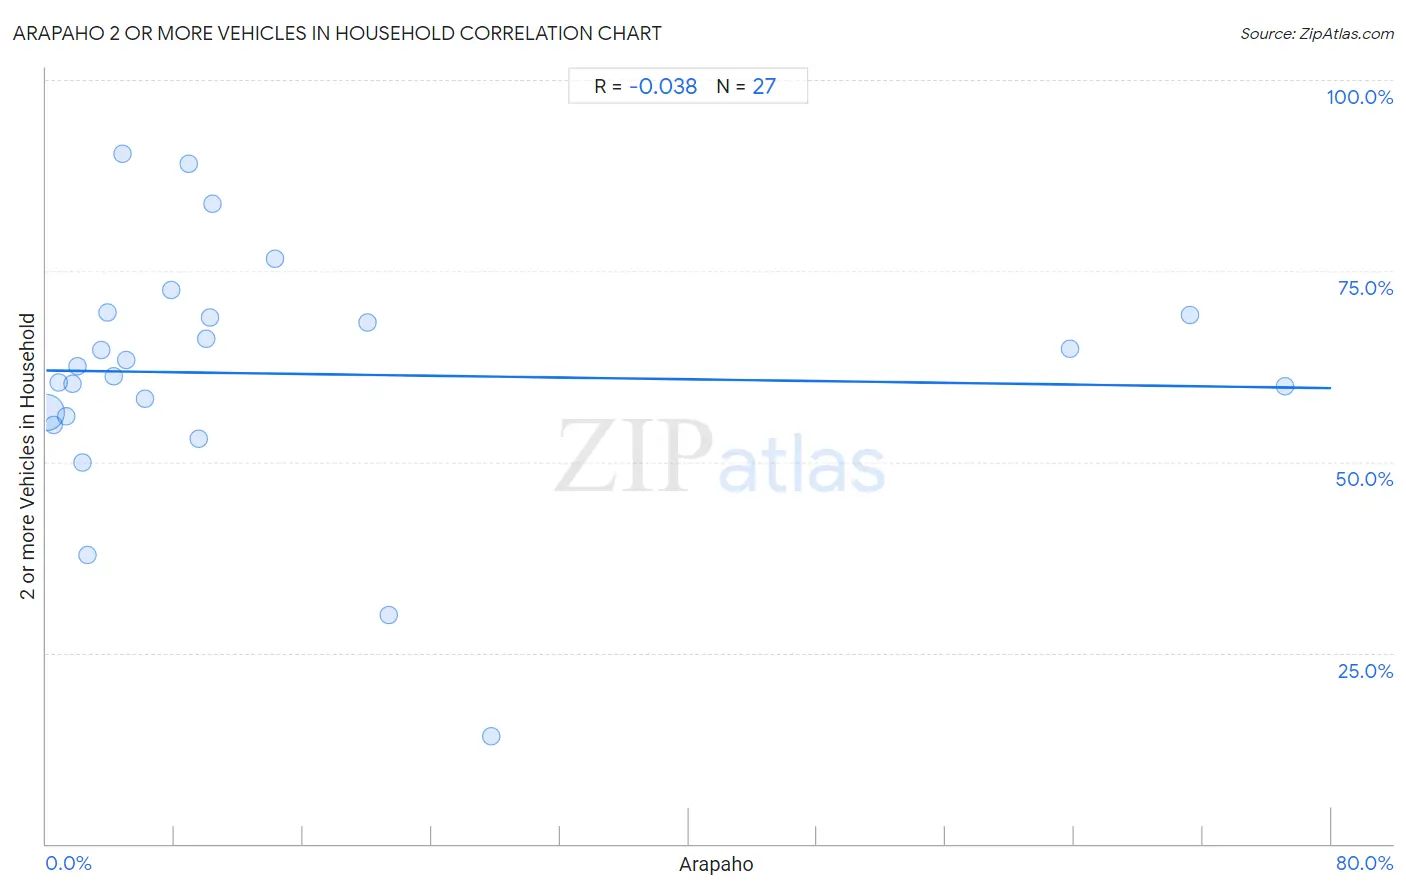
Arapaho 2 or more Vehicles in Household Correlation Chart
The statistical analysis conducted on geographies consisting of 29,778,572 people shows no correlation between the proportion of Arapaho and percentage of households with 2 or more vehicles available in the United States with a correlation coefficient (R) of -0.038 and weighted average of 60.2%. On average, for every 1% (one percent) increase in Arapaho within a typical geography, there is a decrease of 0.029% in percentage of households with 2 or more vehicles available.
It is essential to understand that the correlation between the percentage of Arapaho and percentage of households with 2 or more vehicles available does not imply a direct cause-and-effect relationship. It remains uncertain whether the presence of Arapaho influences an upward or downward trend in the level of percentage of households with 2 or more vehicles available within an area, or if Arapaho simply ended up residing in those areas with higher or lower levels of percentage of households with 2 or more vehicles available due to other factors.
Demographics Similar to Arapaho by 2 or more Vehicles in Household
In terms of 2 or more vehicles in household, the demographic groups most similar to Arapaho are Immigrants from Mexico (60.2%, a difference of 0.060%), Spanish American Indian (60.3%, a difference of 0.11%), Spanish (60.2%, a difference of 0.11%), Finnish (60.3%, a difference of 0.13%), and Immigrants from Philippines (60.1%, a difference of 0.23%).
| Demographics | Rating | Rank | 2 or more Vehicles in Household |
| Whites/Caucasians | 100.0 /100 | #25 | Exceptional 60.8% |
| Welsh | 100.0 /100 | #26 | Exceptional 60.8% |
| Assyrians/Chaldeans/Syriacs | 100.0 /100 | #27 | Exceptional 60.5% |
| Guamanians/Chamorros | 100.0 /100 | #28 | Exceptional 60.5% |
| Hawaiians | 100.0 /100 | #29 | Exceptional 60.4% |
| Finns | 100.0 /100 | #30 | Exceptional 60.3% |
| Spanish American Indians | 100.0 /100 | #31 | Exceptional 60.3% |
| Arapaho | 100.0 /100 | #32 | Exceptional 60.2% |
| Immigrants from Mexico | 100.0 /100 | #33 | Exceptional 60.2% |
| Spanish | 100.0 /100 | #34 | Exceptional 60.2% |
| Immigrants from Philippines | 100.0 /100 | #35 | Exceptional 60.1% |
| Chinese | 100.0 /100 | #36 | Exceptional 60.1% |
| Irish | 100.0 /100 | #37 | Exceptional 60.1% |
| Americans | 100.0 /100 | #38 | Exceptional 60.0% |
| British | 100.0 /100 | #39 | Exceptional 60.0% |
Arapaho 2 or more Vehicles in Household Correlation Summary
| Measurement | Arapaho Data | 2 or more Vehicles in Household Data |
| Minimum | 0.025% | 14.1% |
| Maximum | 77.1% | 90.3% |
| Range | 77.1% | 76.2% |
| Mean | 14.5% | 61.5% |
| Median | 6.2% | 62.5% |
| Interquartile 25% (IQ1) | 2.3% | 56.0% |
| Interquartile 75% (IQ3) | 14.2% | 69.3% |
| Interquartile Range (IQR) | 12.0% | 13.3% |
| Standard Deviation (Sample) | 21.4% | 16.2% |
| Standard Deviation (Population) | 21.0% | 15.9% |
Correlation Details
| Arapaho Percentile | Sample Size | 2 or more Vehicles in Household |
[ 0.0% - 0.5% ] 0.025% | 29,358,436 | 56.5% |
[ 0.0% - 0.5% ] 0.48% | 194,633 | 54.9% |
[ 0.5% - 1.0% ] 0.81% | 102,518 | 60.4% |
[ 1.0% - 1.5% ] 1.22% | 21,648 | 56.0% |
[ 1.5% - 2.0% ] 1.62% | 13,915 | 60.2% |
[ 1.5% - 2.0% ] 1.95% | 10,849 | 62.5% |
[ 2.0% - 2.5% ] 2.28% | 4,918 | 49.9% |
[ 2.5% - 3.0% ] 2.57% | 1,440 | 37.8% |
[ 3.0% - 3.5% ] 3.43% | 5,514 | 64.7% |
[ 3.5% - 4.0% ] 3.83% | 574 | 69.6% |
[ 4.0% - 4.5% ] 4.18% | 8,010 | 61.2% |
[ 4.5% - 5.0% ] 4.73% | 993 | 90.3% |
[ 5.0% - 5.5% ] 5.01% | 3,093 | 63.3% |
[ 6.0% - 6.5% ] 6.17% | 10,733 | 58.2% |
[ 7.5% - 8.0% ] 7.77% | 283 | 72.5% |
[ 8.5% - 9.0% ] 8.89% | 596 | 89.1% |
[ 9.0% - 9.5% ] 9.48% | 3,122 | 53.1% |
[ 9.5% - 10.0% ] 9.96% | 18,898 | 66.2% |
[ 10.0% - 10.5% ] 10.18% | 13,248 | 69.0% |
[ 10.0% - 10.5% ] 10.34% | 58 | 83.7% |
[ 14.0% - 14.5% ] 14.23% | 513 | 76.7% |
[ 20.0% - 20.5% ] 20.00% | 30 | 68.2% |
[ 21.0% - 21.5% ] 21.35% | 89 | 30.0% |
[ 27.5% - 28.0% ] 27.72% | 285 | 14.1% |
[ 63.5% - 64.0% ] 63.72% | 1,596 | 64.8% |
[ 71.0% - 71.5% ] 71.24% | 1,471 | 69.3% |
[ 77.0% - 77.5% ] 77.10% | 1,109 | 59.9% |