Patrick Springs, VA Map & Demographics
Patrick Springs Map
Patrick Springs Overview
$35,750
PER CAPITA INCOME
$66,477
AVG FAMILY INCOME
$52,548
AVG HOUSEHOLD INCOME
17.6%
WAGE / INCOME GAP [ % ]
82.4¢/ $1
WAGE / INCOME GAP [ $ ]
0.50
INEQUALITY / GINI INDEX
2,204
TOTAL POPULATION
1,129
MALE POPULATION
1,075
FEMALE POPULATION
105.02
MALES / 100 FEMALES
95.22
FEMALES / 100 MALES
46.1
MEDIAN AGE
3.3
AVG FAMILY SIZE
2.2
AVG HOUSEHOLD SIZE
818
LABOR FORCE [ PEOPLE ]
43.2%
PERCENT IN LABOR FORCE
1.7%
UNEMPLOYMENT RATE
Patrick Springs Zip Codes
Patrick Springs Area Codes
Income in Patrick Springs
Income Overview in Patrick Springs
Per Capita Income in Patrick Springs is $35,750, while median incomes of families and households are $66,477 and $52,548 respectively.
| Characteristic | Number | Measure |
| Per Capita Income | 2,204 | $35,750 |
| Median Family Income | 452 | $66,477 |
| Mean Family Income | 452 | $75,662 |
| Median Household Income | 1,003 | $52,548 |
| Mean Household Income | 1,003 | $81,470 |
| Income Deficit | 452 | $0 |
| Wage / Income Gap (%) | 2,204 | 17.59% |
| Wage / Income Gap ($) | 2,204 | 82.41¢ per $1 |
| Gini / Inequality Index | 2,204 | 0.50 |
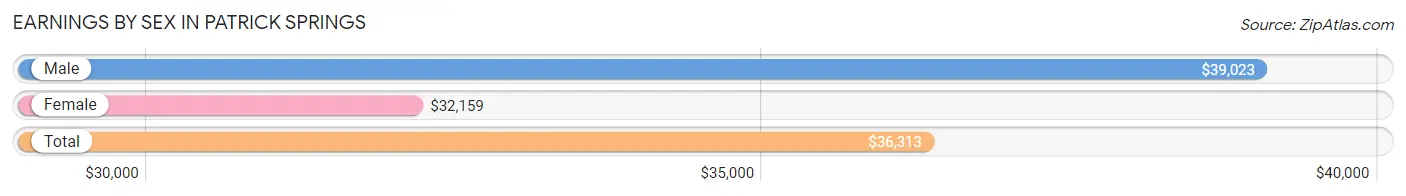
Earnings by Sex in Patrick Springs
Average Earnings in Patrick Springs are $36,313, $39,023 for men and $32,159 for women, a difference of 17.6%.
| Sex | Number | Average Earnings |
| Male | 503 (55.8%) | $39,023 |
| Female | 398 (44.2%) | $32,159 |
| Total | 901 (100.0%) | $36,313 |
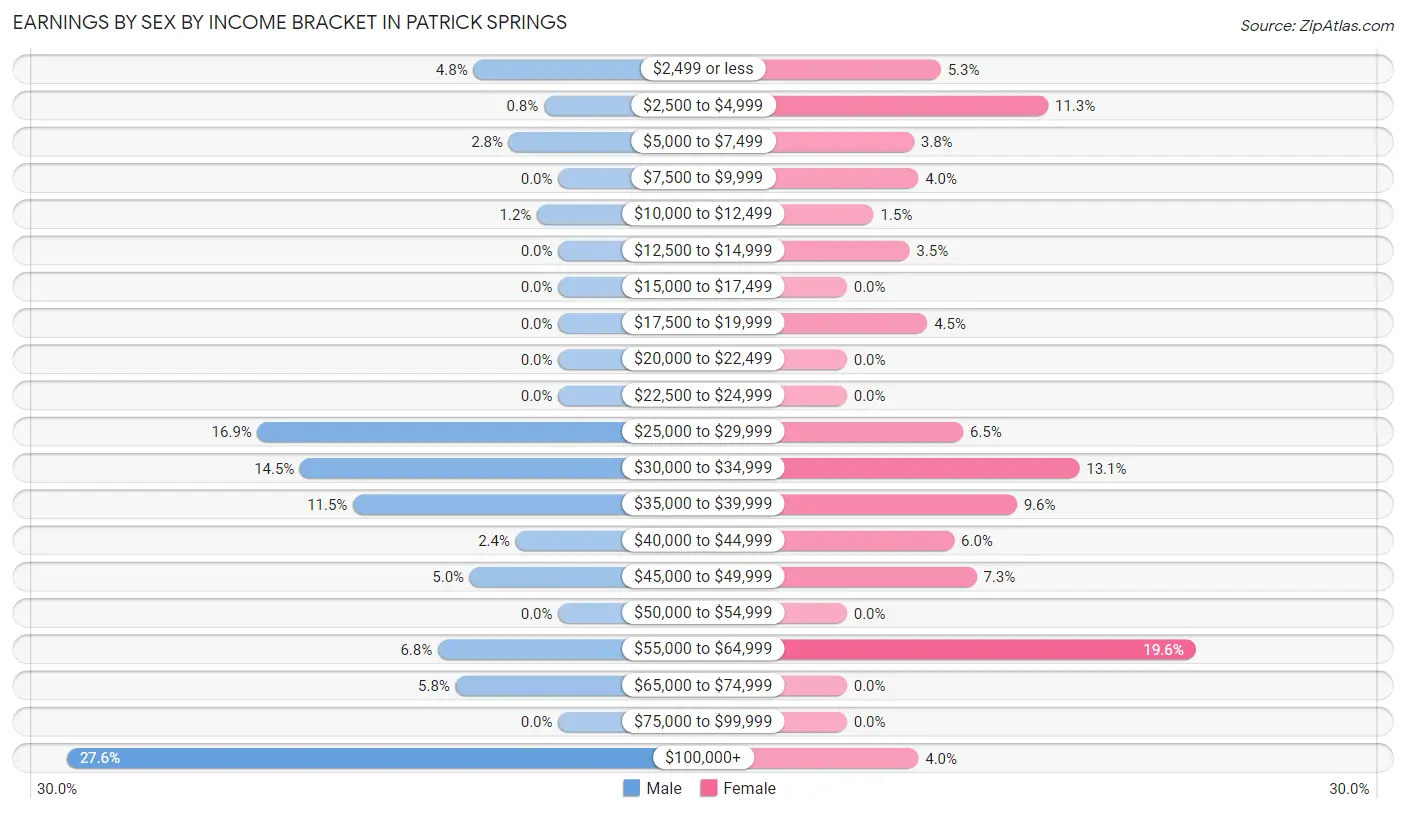
Earnings by Sex by Income Bracket in Patrick Springs
The most common earnings brackets in Patrick Springs are $100,000+ for men (139 | 27.6%) and $55,000 to $64,999 for women (78 | 19.6%).
| Income | Male | Female |
| $2,499 or less | 24 (4.8%) | 21 (5.3%) |
| $2,500 to $4,999 | 4 (0.8%) | 45 (11.3%) |
| $5,000 to $7,499 | 14 (2.8%) | 15 (3.8%) |
| $7,500 to $9,999 | 0 (0.0%) | 16 (4.0%) |
| $10,000 to $12,499 | 6 (1.2%) | 6 (1.5%) |
| $12,500 to $14,999 | 0 (0.0%) | 14 (3.5%) |
| $15,000 to $17,499 | 0 (0.0%) | 0 (0.0%) |
| $17,500 to $19,999 | 0 (0.0%) | 18 (4.5%) |
| $20,000 to $22,499 | 0 (0.0%) | 0 (0.0%) |
| $22,500 to $24,999 | 0 (0.0%) | 0 (0.0%) |
| $25,000 to $29,999 | 85 (16.9%) | 26 (6.5%) |
| $30,000 to $34,999 | 73 (14.5%) | 52 (13.1%) |
| $35,000 to $39,999 | 58 (11.5%) | 38 (9.6%) |
| $40,000 to $44,999 | 12 (2.4%) | 24 (6.0%) |
| $45,000 to $49,999 | 25 (5.0%) | 29 (7.3%) |
| $50,000 to $54,999 | 0 (0.0%) | 0 (0.0%) |
| $55,000 to $64,999 | 34 (6.8%) | 78 (19.6%) |
| $65,000 to $74,999 | 29 (5.8%) | 0 (0.0%) |
| $75,000 to $99,999 | 0 (0.0%) | 0 (0.0%) |
| $100,000+ | 139 (27.6%) | 16 (4.0%) |
| Total | 503 (100.0%) | 398 (100.0%) |
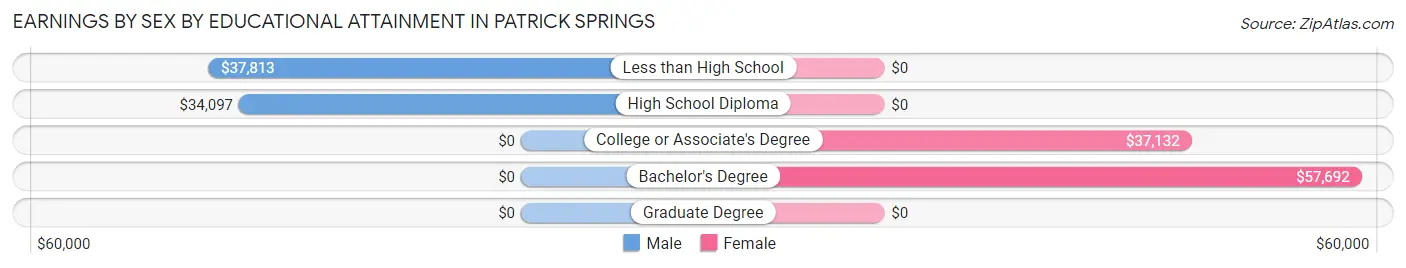
Earnings by Sex by Educational Attainment in Patrick Springs
Average earnings in Patrick Springs are $39,023 for men and $32,131 for women, a difference of 17.7%. Men with an educational attainment of less than high school enjoy the highest average annual earnings of $37,813, while those with high school diploma education earn the least with $34,097. Women with an educational attainment of bachelor's degree earn the most with the average annual earnings of $57,692, while those with college or associate's degree education have the smallest earnings of $37,132.
| Educational Attainment | Male Income | Female Income |
| Less than High School | $37,813 | $0 |
| High School Diploma | $34,097 | $0 |
| College or Associate's Degree | - | - |
| Bachelor's Degree | - | - |
| Graduate Degree | - | - |
| Total | $39,023 | $32,131 |
Family Income in Patrick Springs
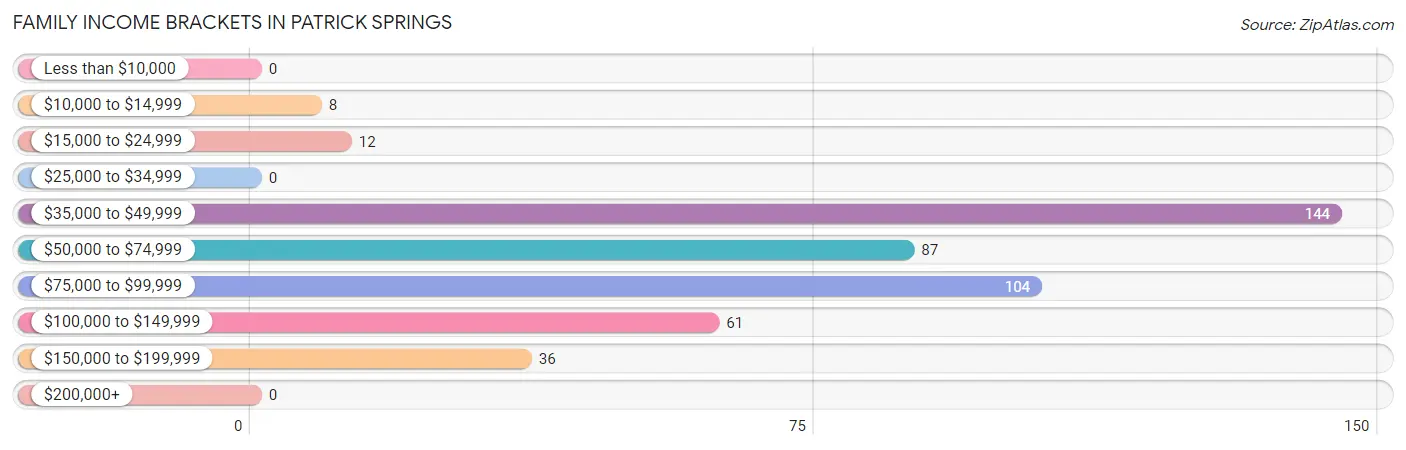
Family Income Brackets in Patrick Springs
According to the Patrick Springs family income data, there are 144 families falling into the $35,000 to $49,999 income range, which is the most common income bracket and makes up 31.9% of all families.
| Income Bracket | # Families | % Families |
| Less than $10,000 | 0 | 0.0% |
| $10,000 to $14,999 | 8 | 1.8% |
| $15,000 to $24,999 | 12 | 2.7% |
| $25,000 to $34,999 | 0 | 0.0% |
| $35,000 to $49,999 | 144 | 31.9% |
| $50,000 to $74,999 | 87 | 19.2% |
| $75,000 to $99,999 | 104 | 23.0% |
| $100,000 to $149,999 | 61 | 13.5% |
| $150,000 to $199,999 | 36 | 8.0% |
| $200,000+ | 0 | 0.0% |
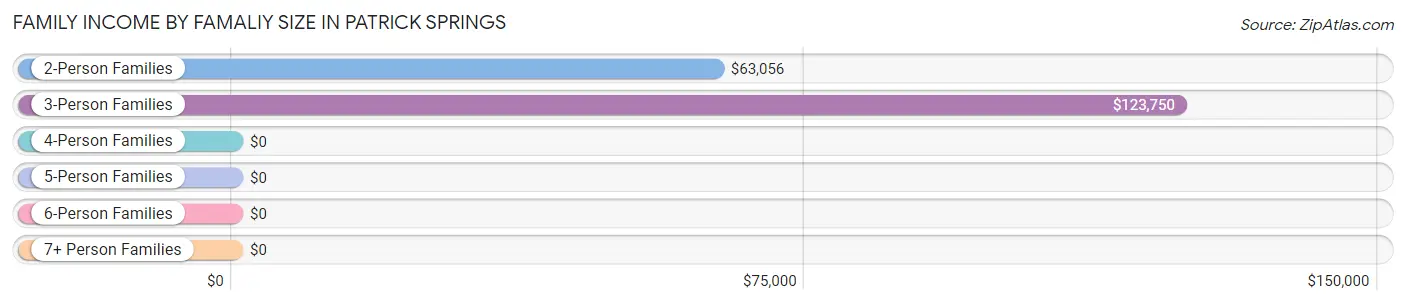
Family Income by Famaliy Size in Patrick Springs
3-person families (42 | 9.3%) account for the highest median family income in Patrick Springs with $123,750 per family, while 3-person families (42 | 9.3%) have the highest median income of $41,250 per family member.
| Income Bracket | # Families | Median Income |
| 2-Person Families | 232 (51.3%) | $63,056 |
| 3-Person Families | 42 (9.3%) | $123,750 |
| 4-Person Families | 110 (24.3%) | $0 |
| 5-Person Families | 46 (10.2%) | $0 |
| 6-Person Families | 22 (4.9%) | $0 |
| 7+ Person Families | 0 (0.0%) | $0 |
| Total | 452 (100.0%) | $66,477 |
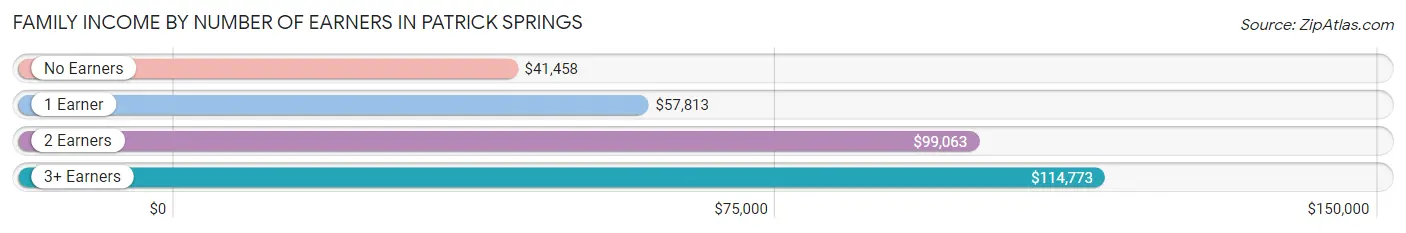
Family Income by Number of Earners in Patrick Springs
The median family income in Patrick Springs is $66,477, with families comprising 3+ earners (28) having the highest median family income of $114,773, while families with no earners (93) have the lowest median family income of $41,458, accounting for 6.2% and 20.6% of families, respectively.
| Number of Earners | # Families | Median Income |
| No Earners | 93 (20.6%) | $41,458 |
| 1 Earner | 200 (44.3%) | $57,813 |
| 2 Earners | 131 (29.0%) | $99,063 |
| 3+ Earners | 28 (6.2%) | $114,773 |
| Total | 452 (100.0%) | $66,477 |
Household Income in Patrick Springs
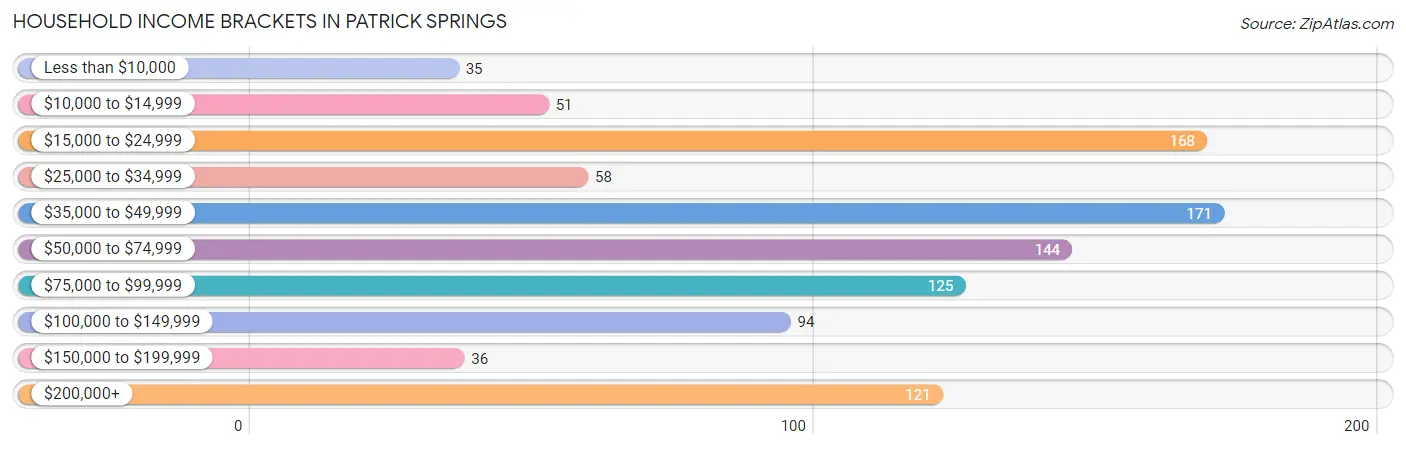
Household Income Brackets in Patrick Springs
With 171 households falling in the category, the $35,000 to $49,999 income range is the most frequent in Patrick Springs, accounting for 17.1% of all households. In contrast, only 35 households (3.5%) fall into the less than $10,000 income bracket, making it the least populous group.
| Income Bracket | # Households | % Households |
| Less than $10,000 | 35 | 3.5% |
| $10,000 to $14,999 | 51 | 5.1% |
| $15,000 to $24,999 | 168 | 16.7% |
| $25,000 to $34,999 | 58 | 5.8% |
| $35,000 to $49,999 | 171 | 17.0% |
| $50,000 to $74,999 | 144 | 14.4% |
| $75,000 to $99,999 | 125 | 12.5% |
| $100,000 to $149,999 | 94 | 9.4% |
| $150,000 to $199,999 | 36 | 3.6% |
| $200,000+ | 121 | 12.1% |
Household Income by Householder Age in Patrick Springs
The median household income in Patrick Springs is $52,548, with the highest median household income of $89,911 found in the 45 to 64 years age bracket for the primary householder. A total of 349 households (34.8%) fall into this category.
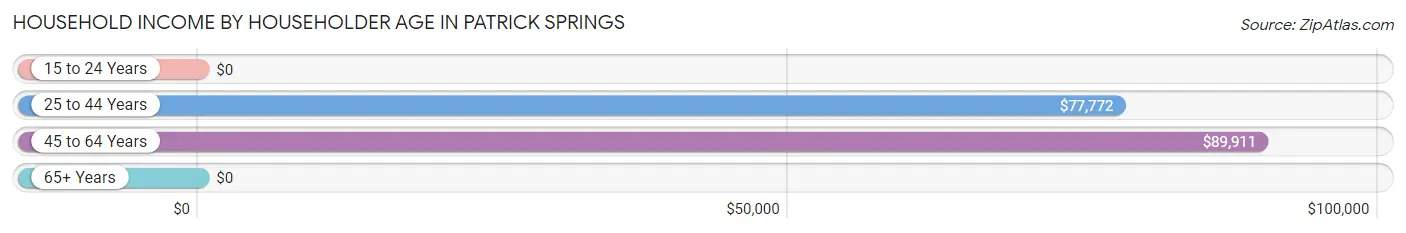
| Income Bracket | # Households | Median Income |
| 15 to 24 Years | 0 (0.0%) | $0 |
| 25 to 44 Years | 208 (20.7%) | $77,772 |
| 45 to 64 Years | 349 (34.8%) | $89,911 |
| 65+ Years | 446 (44.5%) | $0 |
| Total | 1,003 (100.0%) | $52,548 |
Poverty in Patrick Springs
Income Below Poverty by Sex and Age in Patrick Springs
With 5.7% poverty level for males and 6.8% for females among the residents of Patrick Springs, 75 year old and over males and 55 to 64 year old females are the most vulnerable to poverty, with 5 males (21.7%) and 25 females (28.7%) in their respective age groups living below the poverty level.
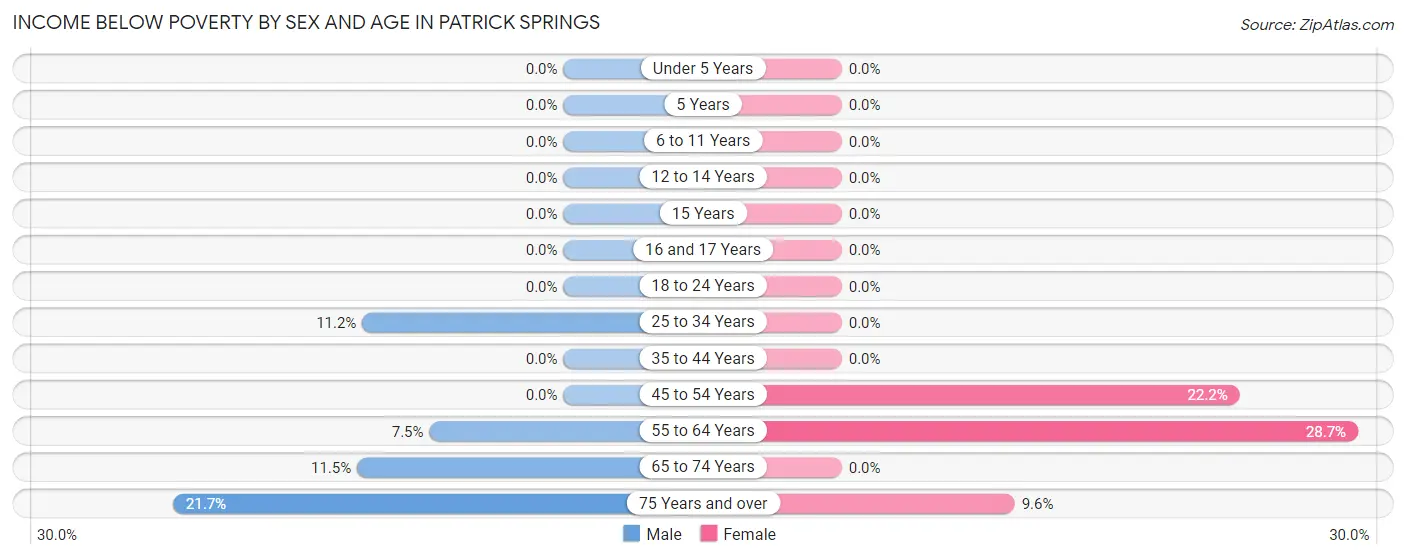
| Age Bracket | Male | Female |
| Under 5 Years | 0 (0.0%) | 0 (0.0%) |
| 5 Years | 0 (0.0%) | 0 (0.0%) |
| 6 to 11 Years | 0 (0.0%) | 0 (0.0%) |
| 12 to 14 Years | 0 (0.0%) | 0 (0.0%) |
| 15 Years | 0 (0.0%) | 0 (0.0%) |
| 16 and 17 Years | 0 (0.0%) | 0 (0.0%) |
| 18 to 24 Years | 0 (0.0%) | 0 (0.0%) |
| 25 to 34 Years | 14 (11.2%) | 0 (0.0%) |
| 35 to 44 Years | 0 (0.0%) | 0 (0.0%) |
| 45 to 54 Years | 0 (0.0%) | 35 (22.2%) |
| 55 to 64 Years | 5 (7.5%) | 25 (28.7%) |
| 65 to 74 Years | 40 (11.5%) | 0 (0.0%) |
| 75 Years and over | 5 (21.7%) | 13 (9.6%) |
| Total | 64 (5.7%) | 73 (6.8%) |
Income Above Poverty by Sex and Age in Patrick Springs
According to the poverty statistics in Patrick Springs, males aged under 5 years and females aged under 5 years are the age groups that are most secure financially, with 100.0% of males and 100.0% of females in these age groups living above the poverty line.
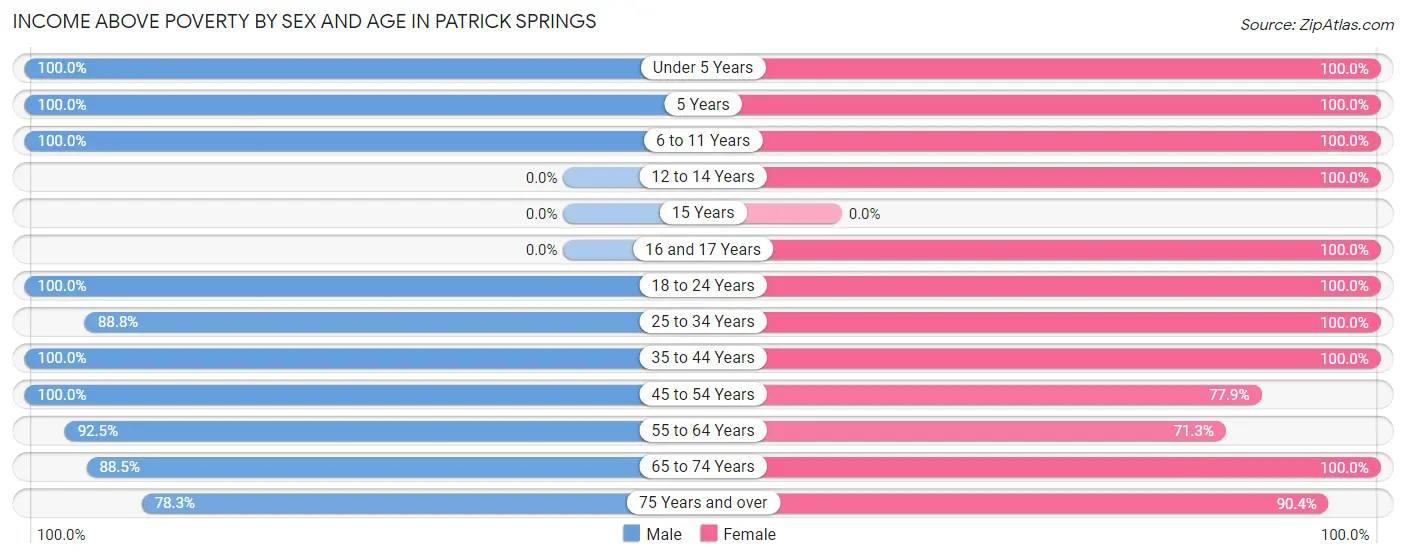
| Age Bracket | Male | Female |
| Under 5 Years | 69 (100.0%) | 103 (100.0%) |
| 5 Years | 13 (100.0%) | 16 (100.0%) |
| 6 to 11 Years | 16 (100.0%) | 71 (100.0%) |
| 12 to 14 Years | 0 (0.0%) | 22 (100.0%) |
| 15 Years | 0 (0.0%) | 0 (0.0%) |
| 16 and 17 Years | 0 (0.0%) | 104 (100.0%) |
| 18 to 24 Years | 113 (100.0%) | 38 (100.0%) |
| 25 to 34 Years | 111 (88.8%) | 124 (100.0%) |
| 35 to 44 Years | 157 (100.0%) | 98 (100.0%) |
| 45 to 54 Years | 198 (100.0%) | 123 (77.8%) |
| 55 to 64 Years | 62 (92.5%) | 62 (71.3%) |
| 65 to 74 Years | 308 (88.5%) | 119 (100.0%) |
| 75 Years and over | 18 (78.3%) | 122 (90.4%) |
| Total | 1,065 (94.3%) | 1,002 (93.2%) |
Income Below Poverty Among Married-Couple Families in Patrick Springs
The poverty statistics for married-couple families in Patrick Springs show that 3.0% or 13 of the total 431 families live below the poverty line. Families with no children have the highest poverty rate of 5.8%, comprising of 13 families. On the other hand, families with 1 or 2 children have the lowest poverty rate of 0.0%, which includes 0 families.
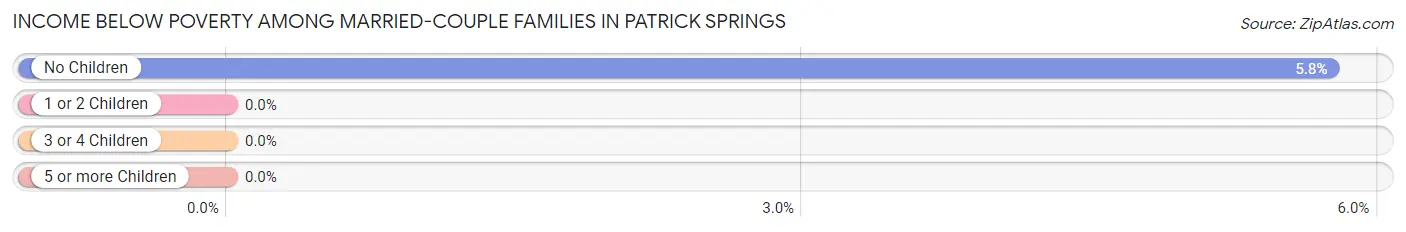
| Children | Above Poverty | Below Poverty |
| No Children | 213 (94.3%) | 13 (5.8%) |
| 1 or 2 Children | 137 (100.0%) | 0 (0.0%) |
| 3 or 4 Children | 68 (100.0%) | 0 (0.0%) |
| 5 or more Children | 0 (0.0%) | 0 (0.0%) |
| Total | 418 (97.0%) | 13 (3.0%) |
Income Below Poverty Among Single-Parent Households in Patrick Springs
| Children | Single Father | Single Mother |
| No Children | 0 (0.0%) | 0 (0.0%) |
| 1 or 2 Children | 0 (0.0%) | 0 (0.0%) |
| 3 or 4 Children | 0 (0.0%) | 0 (0.0%) |
| 5 or more Children | 0 (0.0%) | 0 (0.0%) |
| Total | 0 (0.0%) | 0 (0.0%) |
Income Below Poverty Among Married-Couple vs Single-Parent Households in Patrick Springs
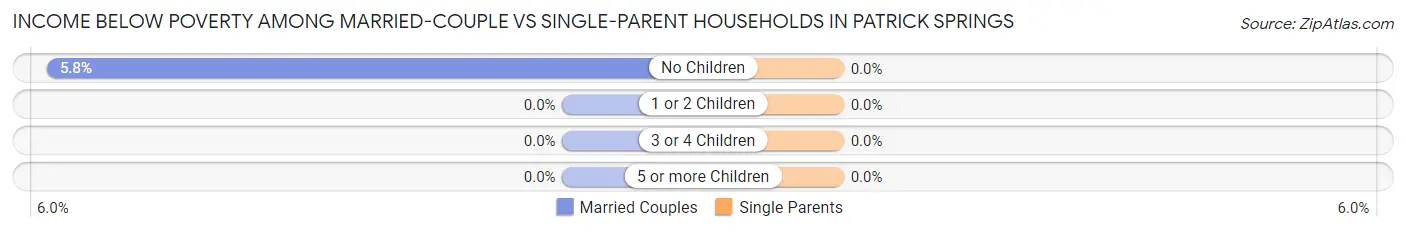
| Children | Married-Couple Families | Single-Parent Households |
| No Children | 13 (5.8%) | 0 (0.0%) |
| 1 or 2 Children | 0 (0.0%) | 0 (0.0%) |
| 3 or 4 Children | 0 (0.0%) | 0 (0.0%) |
| 5 or more Children | 0 (0.0%) | 0 (0.0%) |
| Total | 13 (3.0%) | 0 (0.0%) |
Race in Patrick Springs
The most populous races in Patrick Springs are White / Caucasian (2,065 | 93.7%), Black / African American (81 | 3.7%), and Two or more Races (49 | 2.2%).
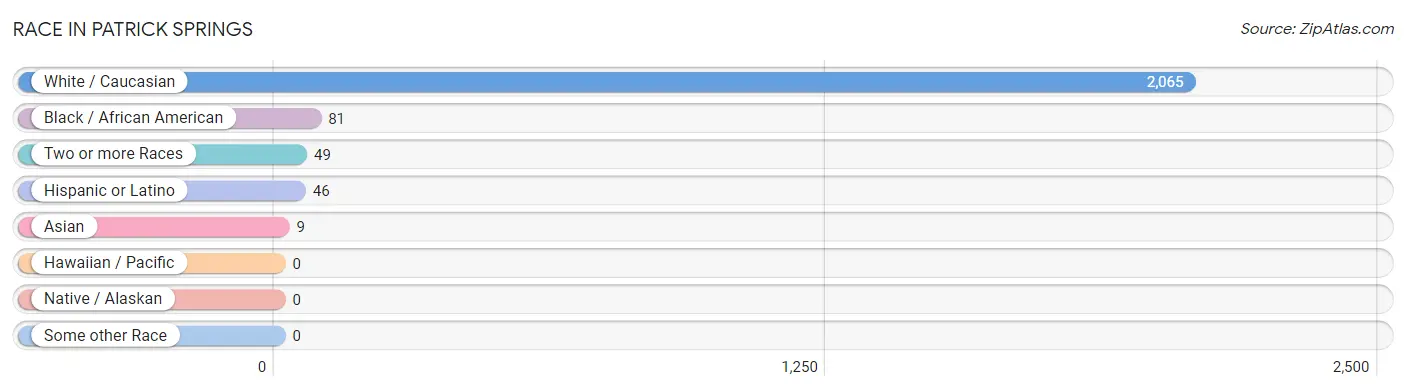
| Race | # Population | % Population |
| Asian | 9 | 0.4% |
| Black / African American | 81 | 3.7% |
| Hawaiian / Pacific | 0 | 0.0% |
| Hispanic or Latino | 46 | 2.1% |
| Native / Alaskan | 0 | 0.0% |
| White / Caucasian | 2,065 | 93.7% |
| Two or more Races | 49 | 2.2% |
| Some other Race | 0 | 0.0% |
| Total | 2,204 | 100.0% |
Ancestry in Patrick Springs
The most populous ancestries reported in Patrick Springs are American (907 | 41.1%), English (194 | 8.8%), Irish (106 | 4.8%), German (74 | 3.4%), and Scottish (16 | 0.7%), together accounting for 58.8% of all Patrick Springs residents.
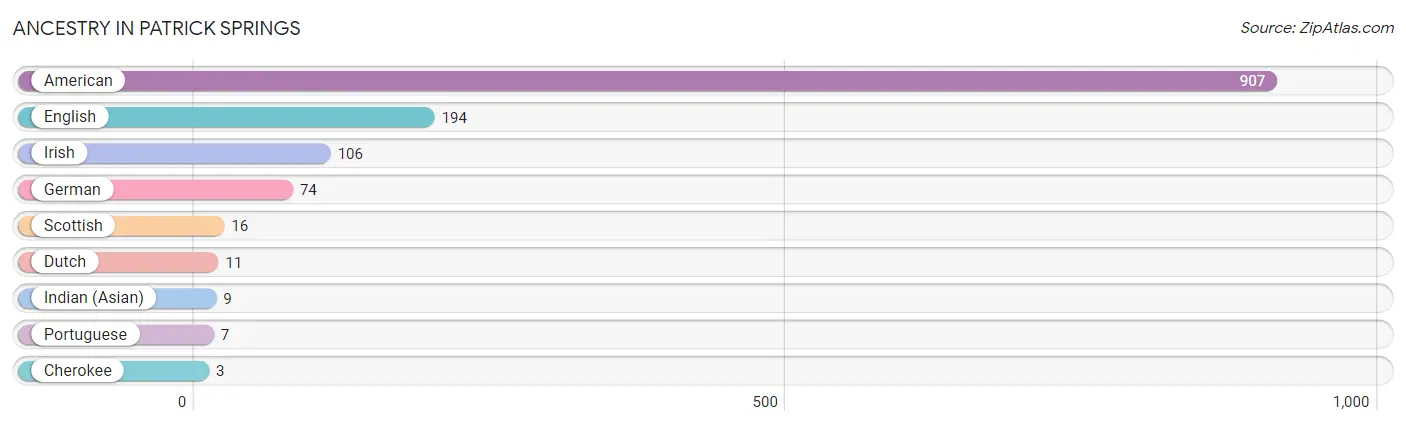
| Ancestry | # Population | % Population |
| American | 907 | 41.1% |
| Cherokee | 3 | 0.1% |
| Dutch | 11 | 0.5% |
| English | 194 | 8.8% |
| German | 74 | 3.4% |
| Indian (Asian) | 9 | 0.4% |
| Irish | 106 | 4.8% |
| Portuguese | 7 | 0.3% |
| Scottish | 16 | 0.7% | View All 9 Rows |
Immigrants in Patrick Springs
The most numerous immigrant groups reported in Patrick Springs came from Asia (9 | 0.4%), China (9 | 0.4%), Eastern Asia (9 | 0.4%), and Taiwan (9 | 0.4%), together accounting for 1.6% of all Patrick Springs residents.
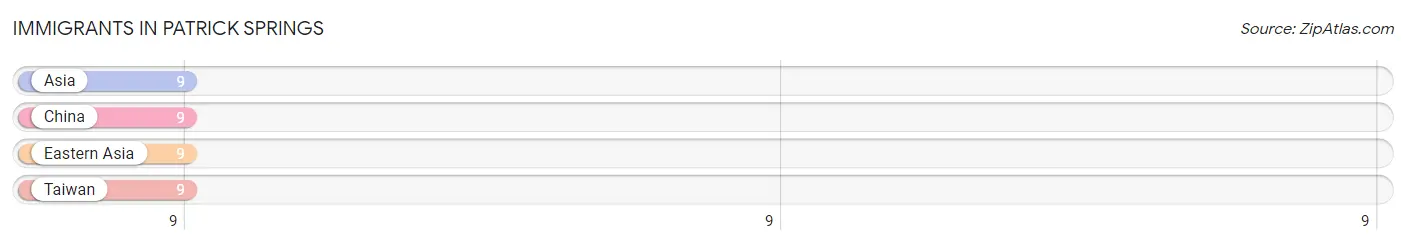
| Immigration Origin | # Population | % Population |
| Asia | 9 | 0.4% |
| China | 9 | 0.4% |
| Eastern Asia | 9 | 0.4% |
| Taiwan | 9 | 0.4% | View All 4 Rows |
Sex and Age in Patrick Springs
Sex and Age in Patrick Springs
The most populous age groups in Patrick Springs are 70 to 74 Years (244 | 21.6%) for men and 15 to 19 Years (114 | 10.6%) for women.
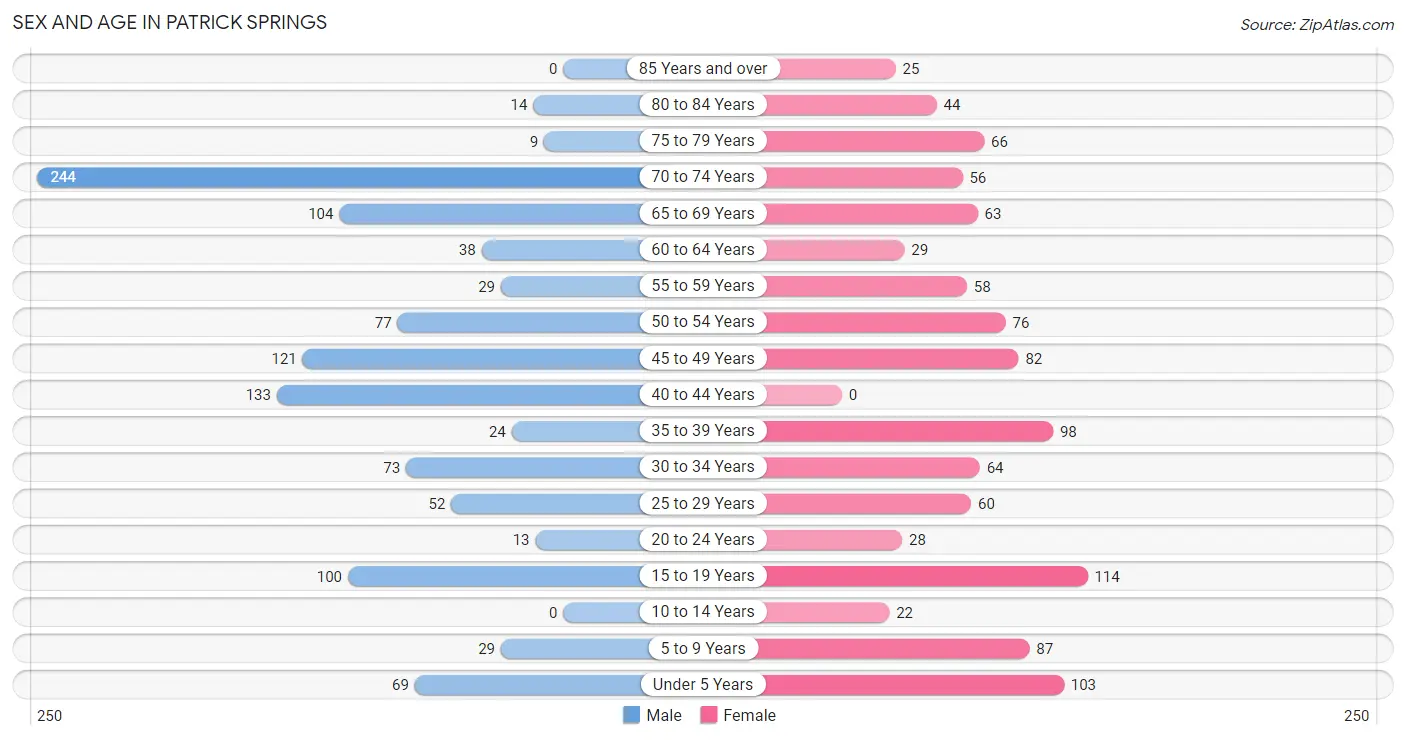
| Age Bracket | Male | Female |
| Under 5 Years | 69 (6.1%) | 103 (9.6%) |
| 5 to 9 Years | 29 (2.6%) | 87 (8.1%) |
| 10 to 14 Years | 0 (0.0%) | 22 (2.1%) |
| 15 to 19 Years | 100 (8.9%) | 114 (10.6%) |
| 20 to 24 Years | 13 (1.1%) | 28 (2.6%) |
| 25 to 29 Years | 52 (4.6%) | 60 (5.6%) |
| 30 to 34 Years | 73 (6.5%) | 64 (5.9%) |
| 35 to 39 Years | 24 (2.1%) | 98 (9.1%) |
| 40 to 44 Years | 133 (11.8%) | 0 (0.0%) |
| 45 to 49 Years | 121 (10.7%) | 82 (7.6%) |
| 50 to 54 Years | 77 (6.8%) | 76 (7.1%) |
| 55 to 59 Years | 29 (2.6%) | 58 (5.4%) |
| 60 to 64 Years | 38 (3.4%) | 29 (2.7%) |
| 65 to 69 Years | 104 (9.2%) | 63 (5.9%) |
| 70 to 74 Years | 244 (21.6%) | 56 (5.2%) |
| 75 to 79 Years | 9 (0.8%) | 66 (6.1%) |
| 80 to 84 Years | 14 (1.2%) | 44 (4.1%) |
| 85 Years and over | 0 (0.0%) | 25 (2.3%) |
| Total | 1,129 (100.0%) | 1,075 (100.0%) |
Families and Households in Patrick Springs
Median Family Size in Patrick Springs
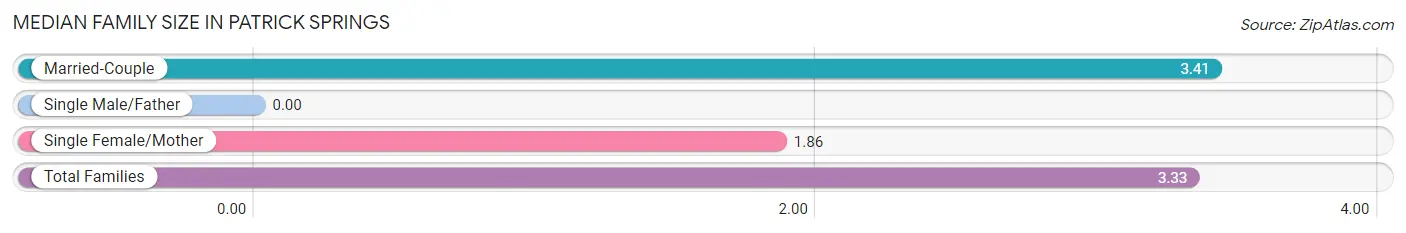
| Family Type | # Families | Family Size |
| Married-Couple | 431 (95.4%) | 3.41 |
| Single Male/Father | 0 (0.0%) | - |
| Single Female/Mother | 21 (4.6%) | 1.86 |
| Total Families | 452 (100.0%) | 3.33 |
Median Household Size in Patrick Springs
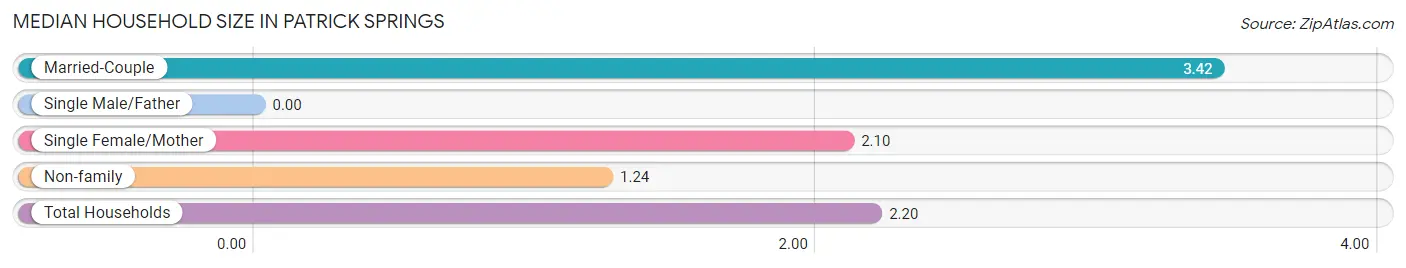
| Household Type | # Households | Household Size |
| Married-Couple | 431 (43.0%) | 3.42 |
| Single Male/Father | 0 (0.0%) | - |
| Single Female/Mother | 21 (2.1%) | 2.10 |
| Non-family | 551 (54.9%) | 1.24 |
| Total Households | 1,003 (100.0%) | 2.20 |
Household Size by Marriage Status in Patrick Springs
Out of a total of 1,003 households in Patrick Springs, 452 (45.1%) are family households, while 551 (54.9%) are nonfamily households. The most numerous type of family households are 2-person households, comprising 223, and the most common type of nonfamily households are 1-person households, comprising 402.
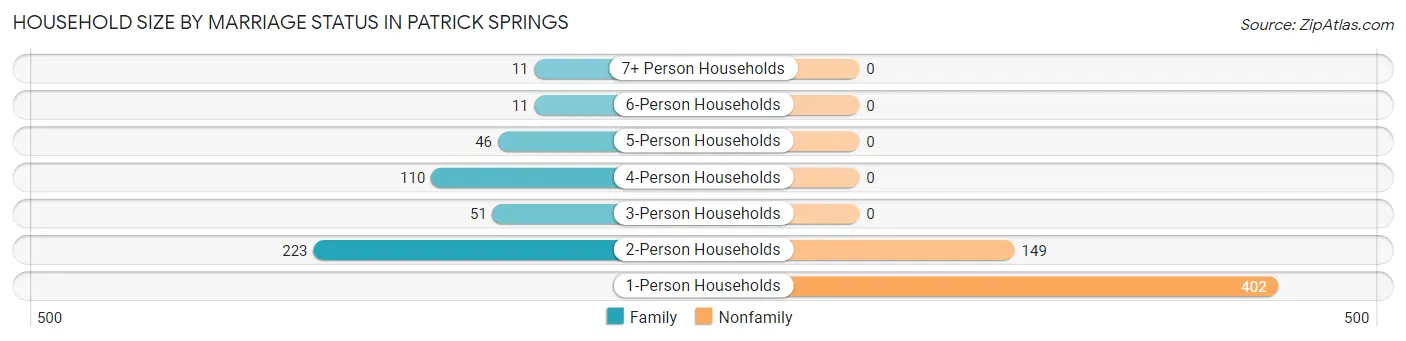
| Household Size | Family Households | Nonfamily Households |
| 1-Person Households | - | 402 (40.1%) |
| 2-Person Households | 223 (22.2%) | 149 (14.9%) |
| 3-Person Households | 51 (5.1%) | 0 (0.0%) |
| 4-Person Households | 110 (11.0%) | 0 (0.0%) |
| 5-Person Households | 46 (4.6%) | 0 (0.0%) |
| 6-Person Households | 11 (1.1%) | 0 (0.0%) |
| 7+ Person Households | 11 (1.1%) | 0 (0.0%) |
| Total | 452 (45.1%) | 551 (54.9%) |
Female Fertility in Patrick Springs
Fertility by Age in Patrick Springs
Average fertility rate in Patrick Springs is 96.0 births per 1,000 women. Women in the age bracket of 20 to 34 years have the highest fertility rate with 289.0 births per 1,000 women. Women in the age bracket of 20 to 34 years acount for 100.0% of all women with births.
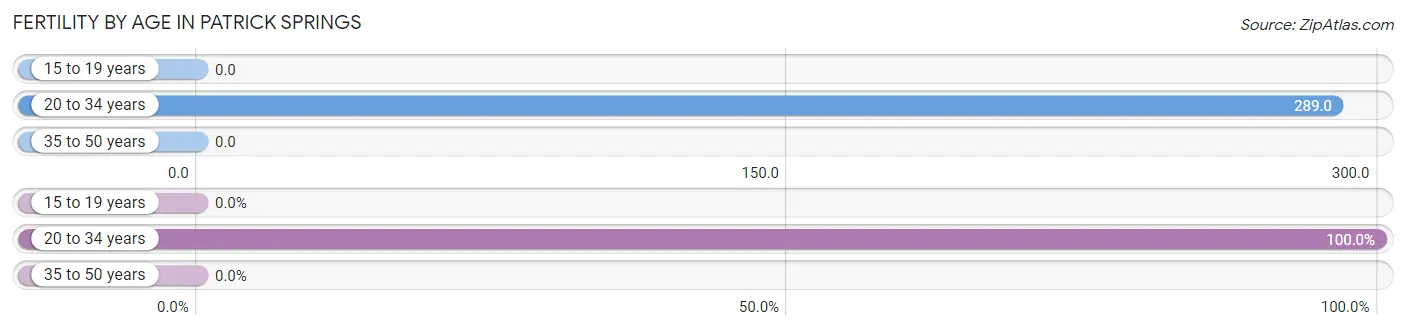
| Age Bracket | Women with Births | Births / 1,000 Women |
| 15 to 19 years | 0 (0.0%) | 0.0 |
| 20 to 34 years | 44 (100.0%) | 289.0 |
| 35 to 50 years | 0 (0.0%) | 0.0 |
| Total | 44 (100.0%) | 96.0 |
Fertility by Age by Marriage Status in Patrick Springs
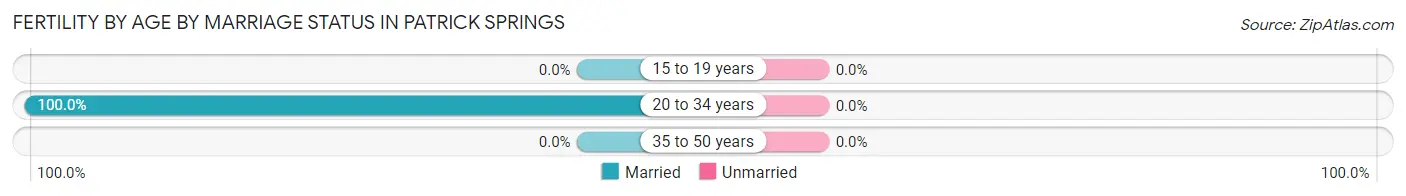
| Age Bracket | Married | Unmarried |
| 15 to 19 years | 0 (0.0%) | 0 (0.0%) |
| 20 to 34 years | 44 (100.0%) | 0 (0.0%) |
| 35 to 50 years | 0 (0.0%) | 0 (0.0%) |
| Total | 44 (100.0%) | 0 (0.0%) |
Fertility by Education in Patrick Springs
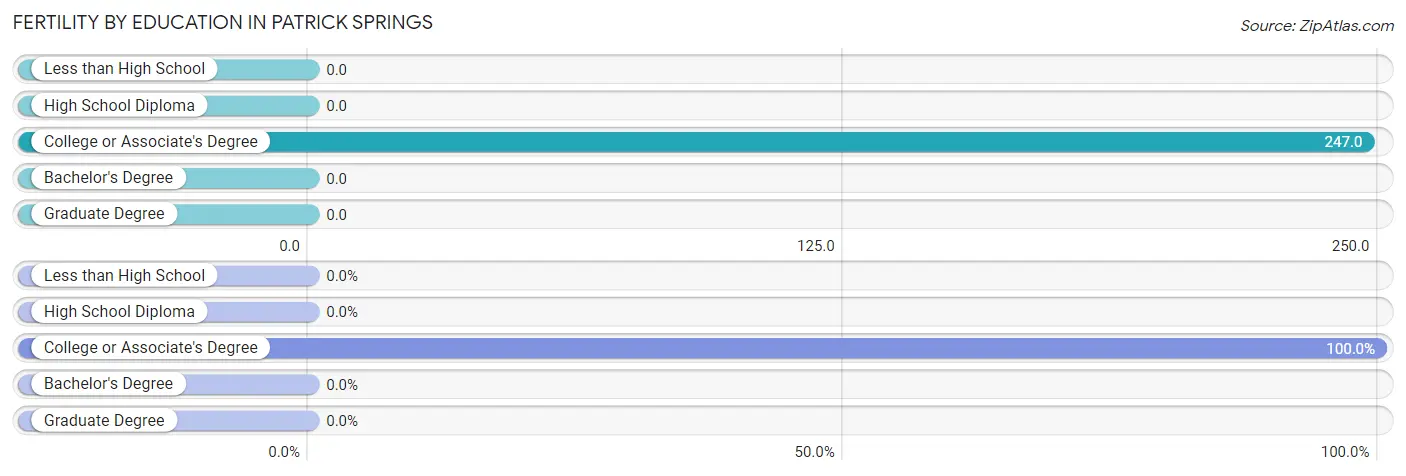
| Educational Attainment | Women with Births | Births / 1,000 Women |
| Less than High School | 0 (0.0%) | 0.0 |
| High School Diploma | 0 (0.0%) | 0.0 |
| College or Associate's Degree | 44 (100.0%) | 247.0 |
| Bachelor's Degree | 0 (0.0%) | 0.0 |
| Graduate Degree | 0 (0.0%) | 0.0 |
| Total | 44 (100.0%) | 96.0 |
Fertility by Education by Marriage Status in Patrick Springs
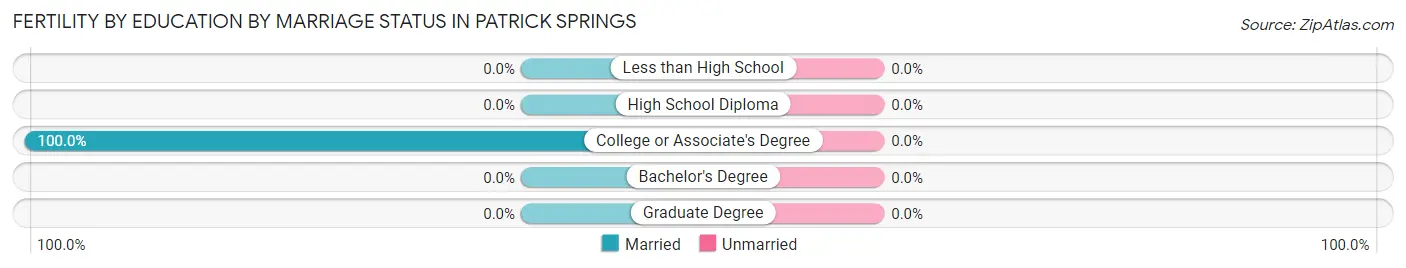
| Educational Attainment | Married | Unmarried |
| Less than High School | 0 (0.0%) | 0 (0.0%) |
| High School Diploma | 0 (0.0%) | 0 (0.0%) |
| College or Associate's Degree | 44 (100.0%) | 0 (0.0%) |
| Bachelor's Degree | 0 (0.0%) | 0 (0.0%) |
| Graduate Degree | 0 (0.0%) | 0 (0.0%) |
| Total | 44 (100.0%) | 0 (0.0%) |
Employment Characteristics in Patrick Springs
Employment by Class of Employer in Patrick Springs
Among the 752 employed individuals in Patrick Springs, private company employees (570 | 75.8%), state government employees (61 | 8.1%), and not-for-profit organizations (41 | 5.4%) make up the most common classes of employment.
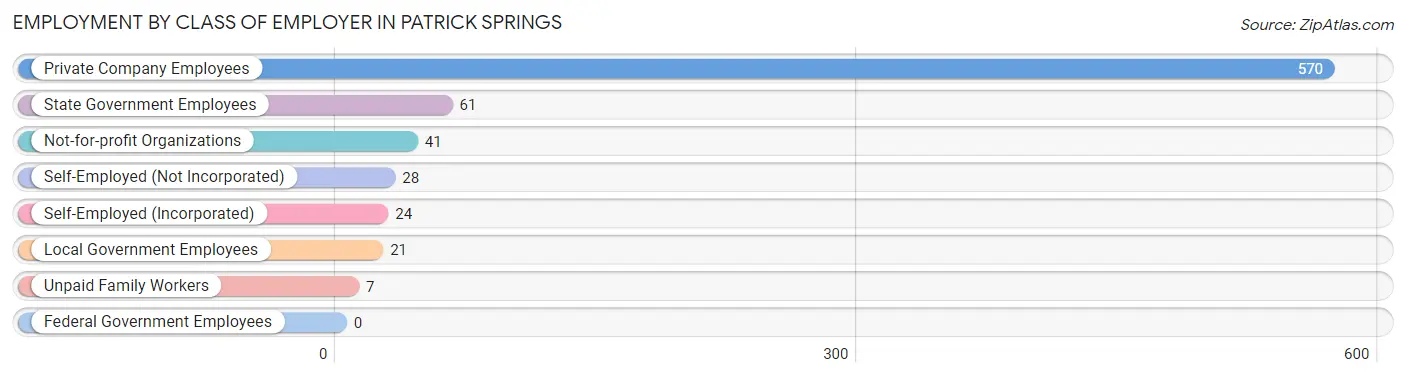
| Employer Class | # Employees | % Employees |
| Private Company Employees | 570 | 75.8% |
| Self-Employed (Incorporated) | 24 | 3.2% |
| Self-Employed (Not Incorporated) | 28 | 3.7% |
| Not-for-profit Organizations | 41 | 5.4% |
| Local Government Employees | 21 | 2.8% |
| State Government Employees | 61 | 8.1% |
| Federal Government Employees | 0 | 0.0% |
| Unpaid Family Workers | 7 | 0.9% |
| Total | 752 | 100.0% |
Employment Status by Age in Patrick Springs
According to the labor force statistics for Patrick Springs, out of the total population over 16 years of age (1,894), 43.2% or 818 individuals are in the labor force, with 1.7% or 14 of them unemployed. The age group with the highest labor force participation rate is 30 to 34 years, with 100.0% or 137 individuals in the labor force. Within the labor force, the 25 to 29 years age range has the highest percentage of unemployed individuals, with 9.4% or 8 of them being unemployed.
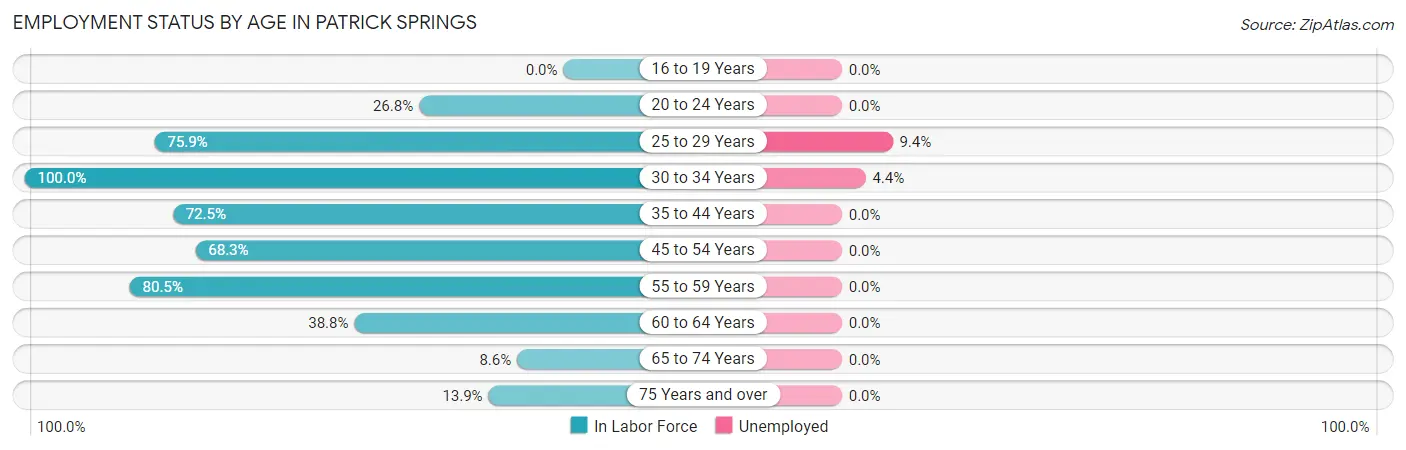
| Age Bracket | In Labor Force | Unemployed |
| 16 to 19 Years | 0 (0.0%) | 0 (0.0%) |
| 20 to 24 Years | 11 (26.8%) | 0 (0.0%) |
| 25 to 29 Years | 85 (75.9%) | 8 (9.4%) |
| 30 to 34 Years | 137 (100.0%) | 6 (4.4%) |
| 35 to 44 Years | 185 (72.5%) | 0 (0.0%) |
| 45 to 54 Years | 243 (68.3%) | 0 (0.0%) |
| 55 to 59 Years | 70 (80.5%) | 0 (0.0%) |
| 60 to 64 Years | 26 (38.8%) | 0 (0.0%) |
| 65 to 74 Years | 40 (8.6%) | 0 (0.0%) |
| 75 Years and over | 22 (13.9%) | 0 (0.0%) |
| Total | 818 (43.2%) | 14 (1.7%) |
Employment Status by Educational Attainment in Patrick Springs
According to labor force statistics for Patrick Springs, 73.6% of individuals (746) out of the total population between 25 and 64 years of age (1,014) are in the labor force, with 1.9% or 14 of them being unemployed. The group with the highest labor force participation rate are those with the educational attainment of bachelor's degree or higher, with 100.0% or 88 individuals in the labor force. Within the labor force, individuals with high school diploma education have the highest percentage of unemployment, with 4.2% or 14 of them being unemployed.
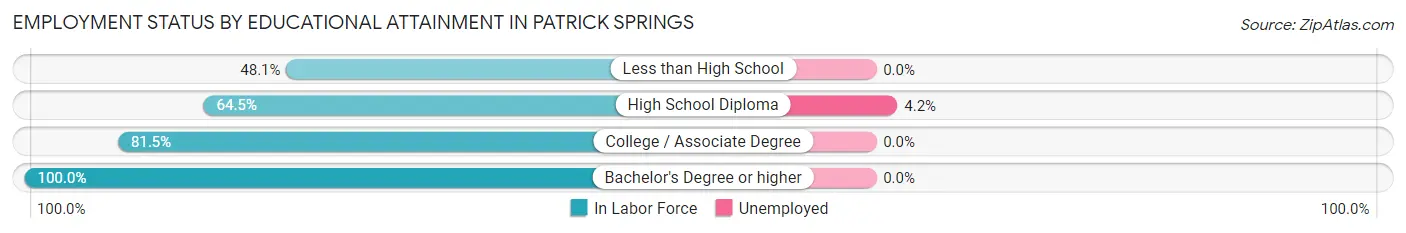
| Educational Attainment | In Labor Force | Unemployed |
| Less than High School | 13 (48.1%) | 0 (0.0%) |
| High School Diploma | 333 (64.5%) | 22 (4.2%) |
| College / Associate Degree | 312 (81.5%) | 0 (0.0%) |
| Bachelor's Degree or higher | 88 (100.0%) | 0 (0.0%) |
| Total | 746 (73.6%) | 19 (1.9%) |
Employment Occupations by Sex in Patrick Springs
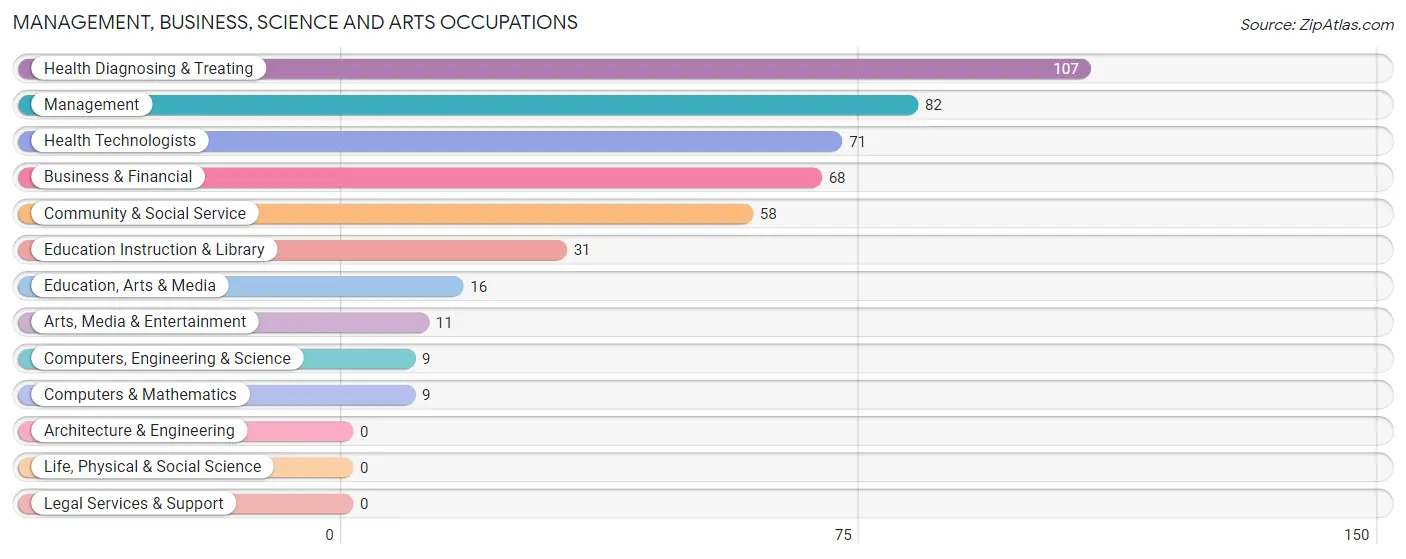
Management, Business, Science and Arts Occupations
The most common Management, Business, Science and Arts occupations in Patrick Springs are Health Diagnosing & Treating (107 | 13.3%), Management (82 | 10.2%), Health Technologists (71 | 8.8%), Business & Financial (68 | 8.5%), and Community & Social Service (58 | 7.2%).
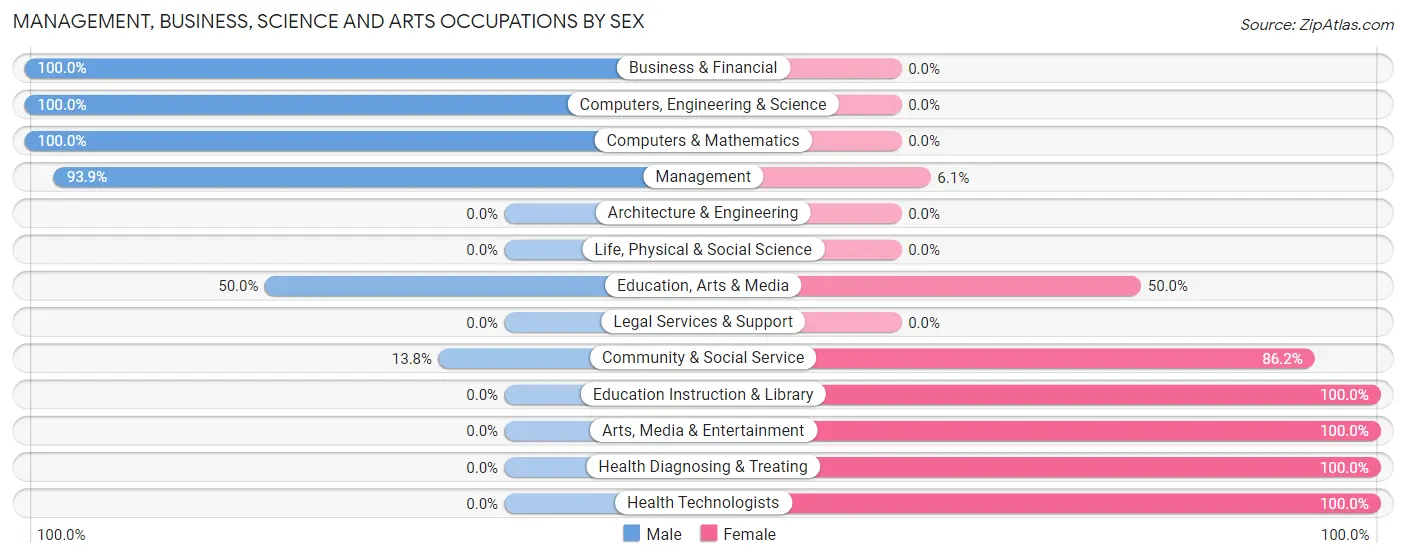
Management, Business, Science and Arts Occupations by Sex
Within the Management, Business, Science and Arts occupations in Patrick Springs, the most male-oriented occupations are Business & Financial (100.0%), Computers, Engineering & Science (100.0%), and Computers & Mathematics (100.0%), while the most female-oriented occupations are Education Instruction & Library (100.0%), Arts, Media & Entertainment (100.0%), and Health Diagnosing & Treating (100.0%).
| Occupation | Male | Female |
| Management | 77 (93.9%) | 5 (6.1%) |
| Business & Financial | 68 (100.0%) | 0 (0.0%) |
| Computers, Engineering & Science | 9 (100.0%) | 0 (0.0%) |
| Computers & Mathematics | 9 (100.0%) | 0 (0.0%) |
| Architecture & Engineering | 0 (0.0%) | 0 (0.0%) |
| Life, Physical & Social Science | 0 (0.0%) | 0 (0.0%) |
| Community & Social Service | 8 (13.8%) | 50 (86.2%) |
| Education, Arts & Media | 8 (50.0%) | 8 (50.0%) |
| Legal Services & Support | 0 (0.0%) | 0 (0.0%) |
| Education Instruction & Library | 0 (0.0%) | 31 (100.0%) |
| Arts, Media & Entertainment | 0 (0.0%) | 11 (100.0%) |
| Health Diagnosing & Treating | 0 (0.0%) | 107 (100.0%) |
| Health Technologists | 0 (0.0%) | 71 (100.0%) |
| Total (Category) | 162 (50.0%) | 162 (50.0%) |
| Total (Overall) | 466 (57.9%) | 339 (42.1%) |
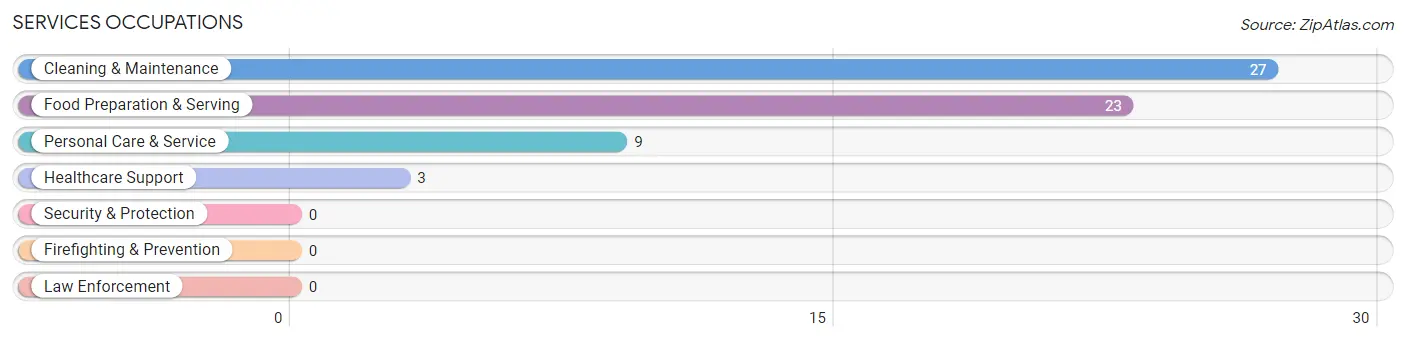
Services Occupations
The most common Services occupations in Patrick Springs are Cleaning & Maintenance (27 | 3.4%), Food Preparation & Serving (23 | 2.9%), Personal Care & Service (9 | 1.1%), and Healthcare Support (3 | 0.4%).
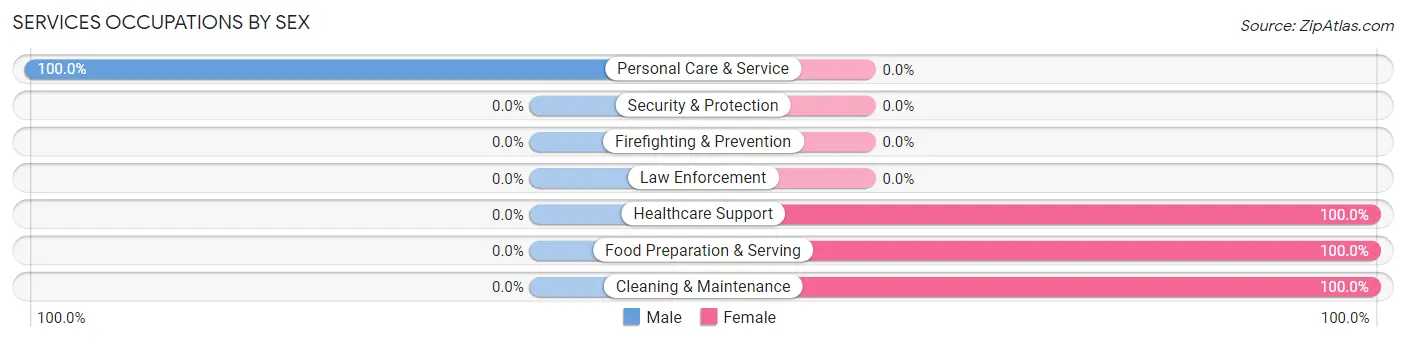
Services Occupations by Sex
| Occupation | Male | Female |
| Healthcare Support | 0 (0.0%) | 3 (100.0%) |
| Security & Protection | 0 (0.0%) | 0 (0.0%) |
| Firefighting & Prevention | 0 (0.0%) | 0 (0.0%) |
| Law Enforcement | 0 (0.0%) | 0 (0.0%) |
| Food Preparation & Serving | 0 (0.0%) | 23 (100.0%) |
| Cleaning & Maintenance | 0 (0.0%) | 27 (100.0%) |
| Personal Care & Service | 9 (100.0%) | 0 (0.0%) |
| Total (Category) | 9 (14.5%) | 53 (85.5%) |
| Total (Overall) | 466 (57.9%) | 339 (42.1%) |
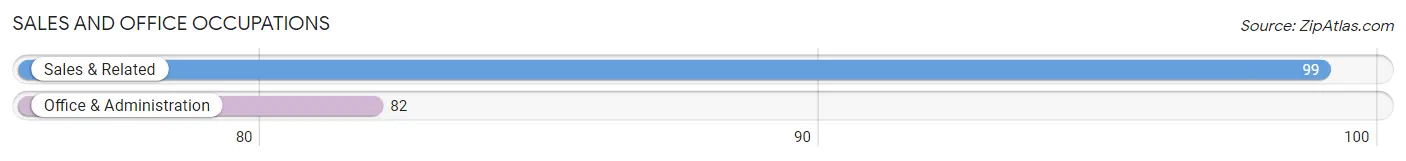
Sales and Office Occupations
The most common Sales and Office occupations in Patrick Springs are Sales & Related (99 | 12.3%), and Office & Administration (82 | 10.2%).
Sales and Office Occupations by Sex
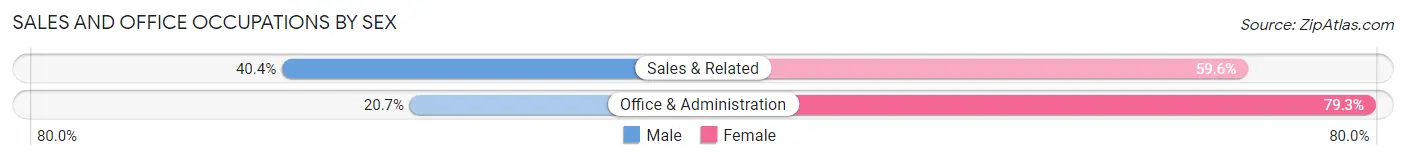
| Occupation | Male | Female |
| Sales & Related | 40 (40.4%) | 59 (59.6%) |
| Office & Administration | 17 (20.7%) | 65 (79.3%) |
| Total (Category) | 57 (31.5%) | 124 (68.5%) |
| Total (Overall) | 466 (57.9%) | 339 (42.1%) |
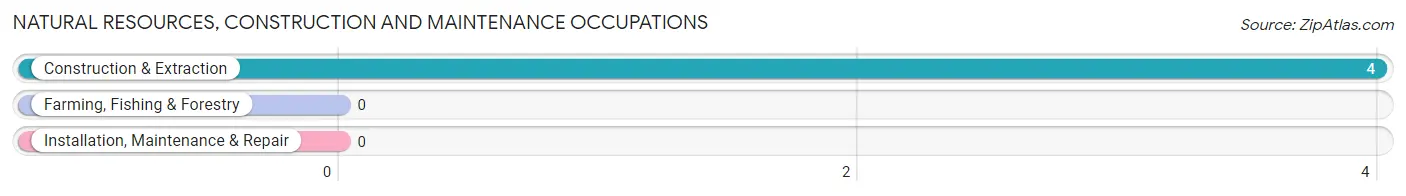
Natural Resources, Construction and Maintenance Occupations
The most common Natural Resources, Construction and Maintenance occupations in Patrick Springs are , and Construction & Extraction (4 | 0.5%).
Natural Resources, Construction and Maintenance Occupations by Sex
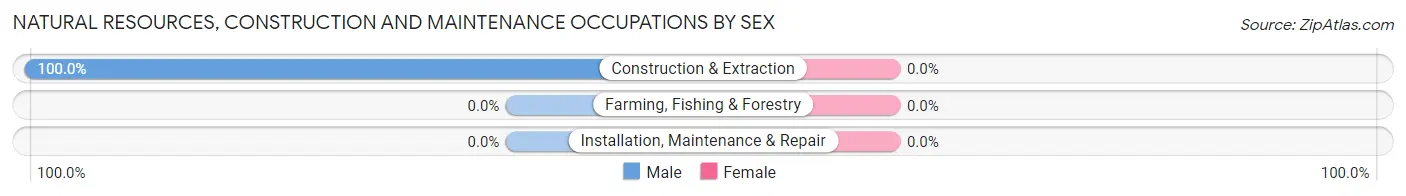
| Occupation | Male | Female |
| Farming, Fishing & Forestry | 0 (0.0%) | 0 (0.0%) |
| Construction & Extraction | 4 (100.0%) | 0 (0.0%) |
| Installation, Maintenance & Repair | 0 (0.0%) | 0 (0.0%) |
| Total (Category) | 4 (100.0%) | 0 (0.0%) |
| Total (Overall) | 466 (57.9%) | 339 (42.1%) |
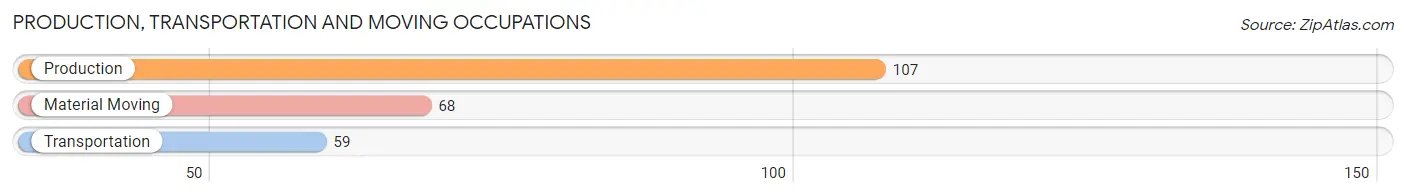
Production, Transportation and Moving Occupations
The most common Production, Transportation and Moving occupations in Patrick Springs are Production (107 | 13.3%), Material Moving (68 | 8.5%), and Transportation (59 | 7.3%).
Production, Transportation and Moving Occupations by Sex
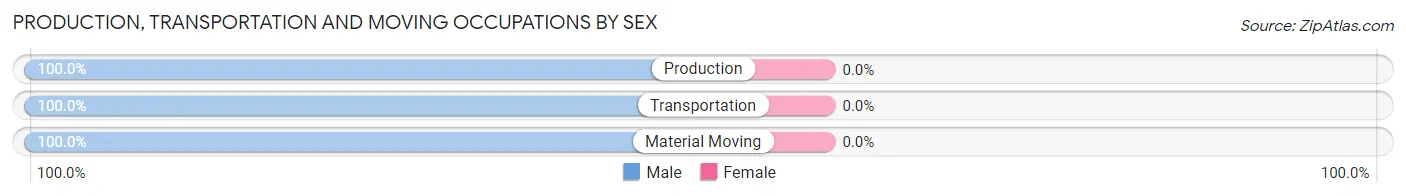
| Occupation | Male | Female |
| Production | 107 (100.0%) | 0 (0.0%) |
| Transportation | 59 (100.0%) | 0 (0.0%) |
| Material Moving | 68 (100.0%) | 0 (0.0%) |
| Total (Category) | 234 (100.0%) | 0 (0.0%) |
| Total (Overall) | 466 (57.9%) | 339 (42.1%) |
Employment Industries by Sex in Patrick Springs
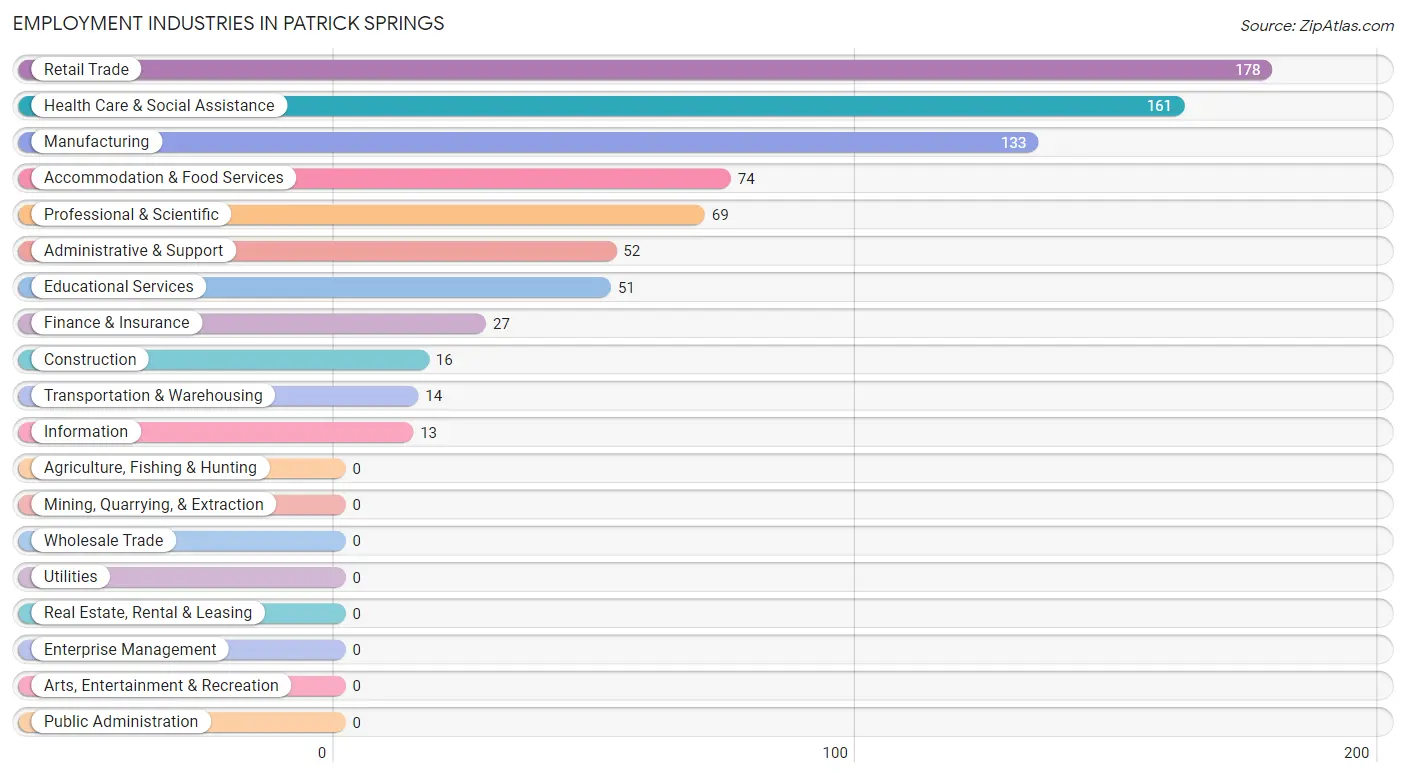
Employment Industries in Patrick Springs
The major employment industries in Patrick Springs include Retail Trade (178 | 22.1%), Health Care & Social Assistance (161 | 20.0%), Manufacturing (133 | 16.5%), Accommodation & Food Services (74 | 9.2%), and Professional & Scientific (69 | 8.6%).
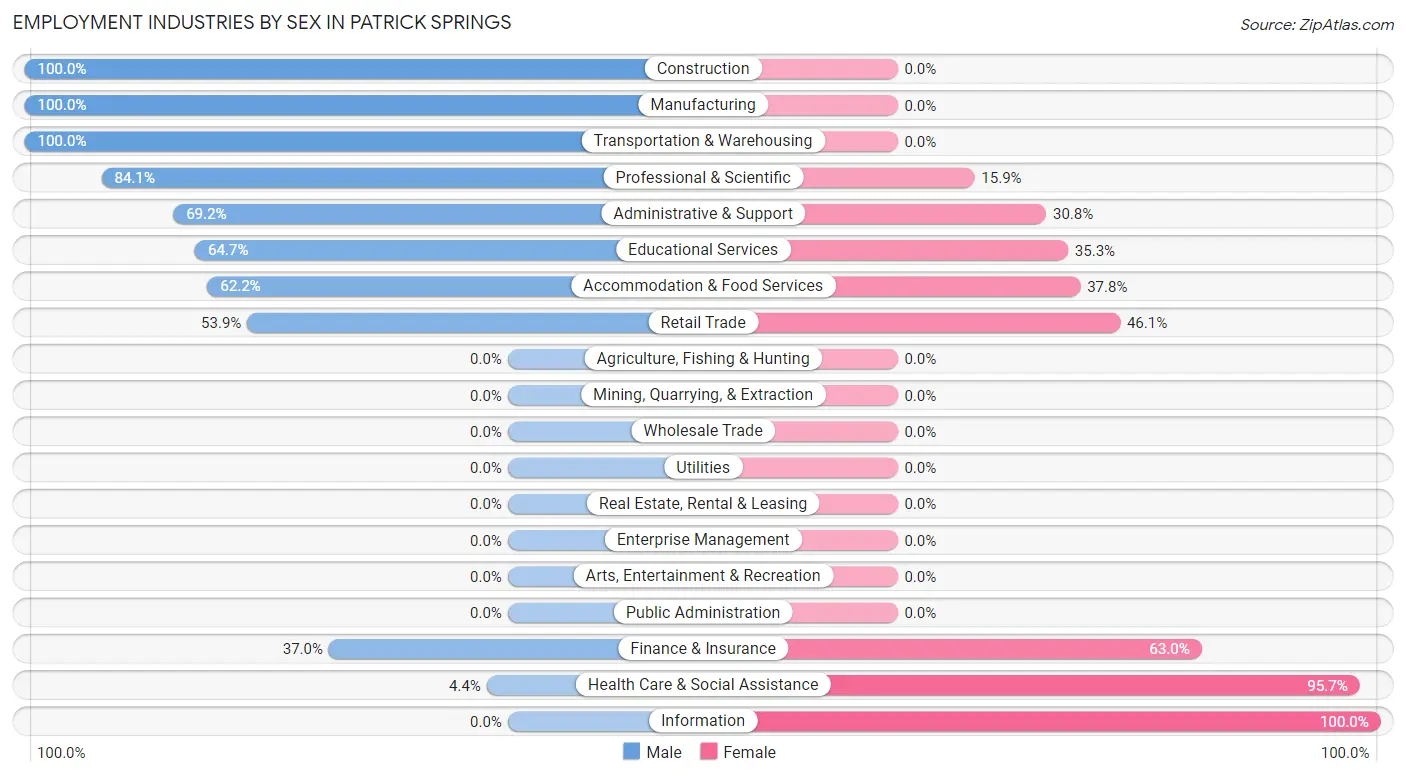
Employment Industries by Sex in Patrick Springs
The Patrick Springs industries that see more men than women are Construction (100.0%), Manufacturing (100.0%), and Transportation & Warehousing (100.0%), whereas the industries that tend to have a higher number of women are Information (100.0%), Health Care & Social Assistance (95.7%), and Finance & Insurance (63.0%).
| Industry | Male | Female |
| Agriculture, Fishing & Hunting | 0 (0.0%) | 0 (0.0%) |
| Mining, Quarrying, & Extraction | 0 (0.0%) | 0 (0.0%) |
| Construction | 16 (100.0%) | 0 (0.0%) |
| Manufacturing | 133 (100.0%) | 0 (0.0%) |
| Wholesale Trade | 0 (0.0%) | 0 (0.0%) |
| Retail Trade | 96 (53.9%) | 82 (46.1%) |
| Transportation & Warehousing | 14 (100.0%) | 0 (0.0%) |
| Utilities | 0 (0.0%) | 0 (0.0%) |
| Information | 0 (0.0%) | 13 (100.0%) |
| Finance & Insurance | 10 (37.0%) | 17 (63.0%) |
| Real Estate, Rental & Leasing | 0 (0.0%) | 0 (0.0%) |
| Professional & Scientific | 58 (84.1%) | 11 (15.9%) |
| Enterprise Management | 0 (0.0%) | 0 (0.0%) |
| Administrative & Support | 36 (69.2%) | 16 (30.8%) |
| Educational Services | 33 (64.7%) | 18 (35.3%) |
| Health Care & Social Assistance | 7 (4.3%) | 154 (95.7%) |
| Arts, Entertainment & Recreation | 0 (0.0%) | 0 (0.0%) |
| Accommodation & Food Services | 46 (62.2%) | 28 (37.8%) |
| Public Administration | 0 (0.0%) | 0 (0.0%) |
| Total | 466 (57.9%) | 339 (42.1%) |
Education in Patrick Springs
School Enrollment in Patrick Springs
The most common levels of schooling among the 402 students in Patrick Springs are high school (204 | 50.7%), elementary school (87 | 21.6%), and college / undergraduate (40 | 10.0%).
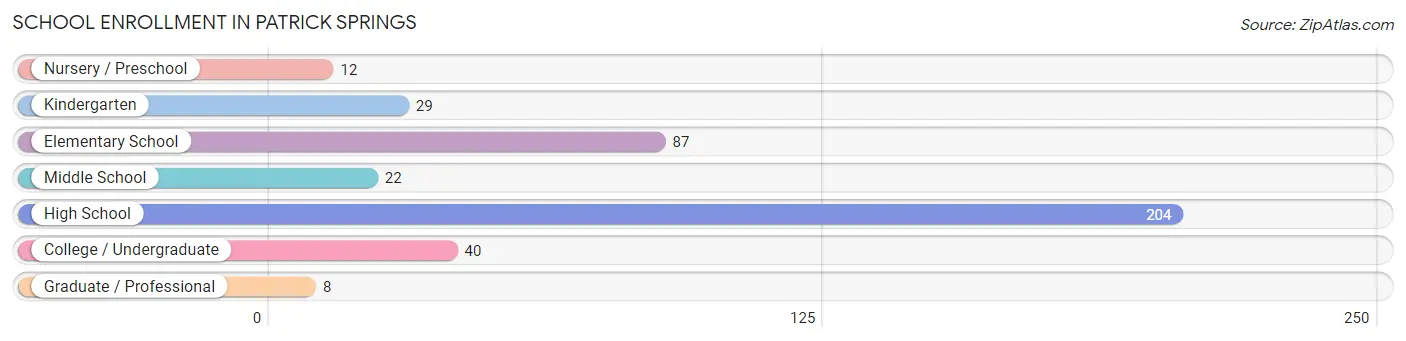
| School Level | # Students | % Students |
| Nursery / Preschool | 12 | 3.0% |
| Kindergarten | 29 | 7.2% |
| Elementary School | 87 | 21.6% |
| Middle School | 22 | 5.5% |
| High School | 204 | 50.7% |
| College / Undergraduate | 40 | 10.0% |
| Graduate / Professional | 8 | 2.0% |
| Total | 402 | 100.0% |
School Enrollment by Age by Funding Source in Patrick Springs
Out of a total of 402 students who are enrolled in schools in Patrick Springs, 17 (4.2%) attend a private institution, while the remaining 385 (95.8%) are enrolled in public schools. The age group of 20 to 24 year olds has the highest likelihood of being enrolled in private schools, with 17 (56.7% in the age bracket) enrolled. Conversely, the age group of 3 to 4 year olds has the lowest likelihood of being enrolled in a private school, with 12 (100.0% in the age bracket) attending a public institution.
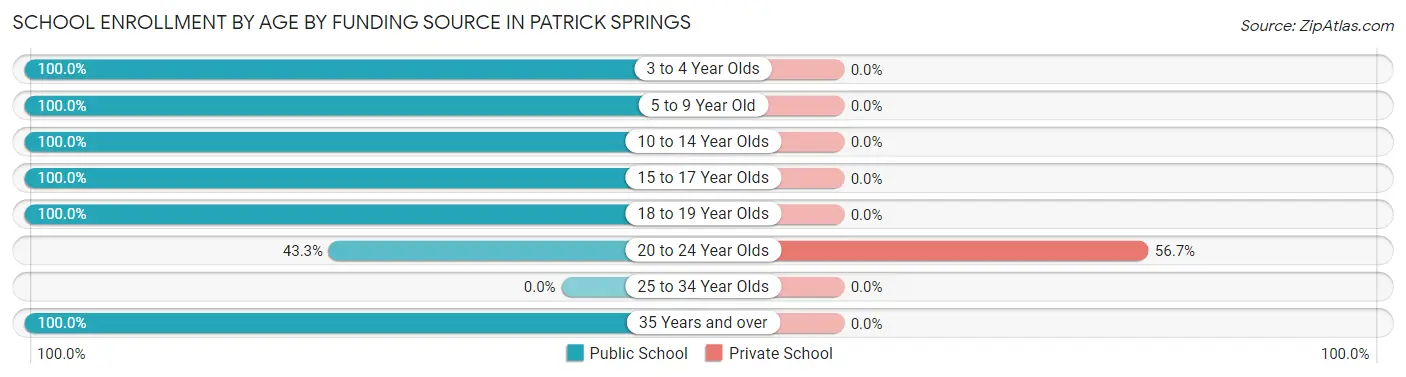
| Age Bracket | Public School | Private School |
| 3 to 4 Year Olds | 12 (100.0%) | 0 (0.0%) |
| 5 to 9 Year Old | 116 (100.0%) | 0 (0.0%) |
| 10 to 14 Year Olds | 22 (100.0%) | 0 (0.0%) |
| 15 to 17 Year Olds | 104 (100.0%) | 0 (0.0%) |
| 18 to 19 Year Olds | 110 (100.0%) | 0 (0.0%) |
| 20 to 24 Year Olds | 13 (43.3%) | 17 (56.7%) |
| 25 to 34 Year Olds | 0 (0.0%) | 0 (0.0%) |
| 35 Years and over | 8 (100.0%) | 0 (0.0%) |
| Total | 385 (95.8%) | 17 (4.2%) |
Educational Attainment by Field of Study in Patrick Springs
Engineering (134 | 47.3%), science & technology (47 | 16.6%), bio, nature & agricultural (28 | 9.9%), arts & humanities (20 | 7.1%), and physical & health sciences (13 | 4.6%) are the most common fields of study among 283 individuals in Patrick Springs who have obtained a bachelor's degree or higher.
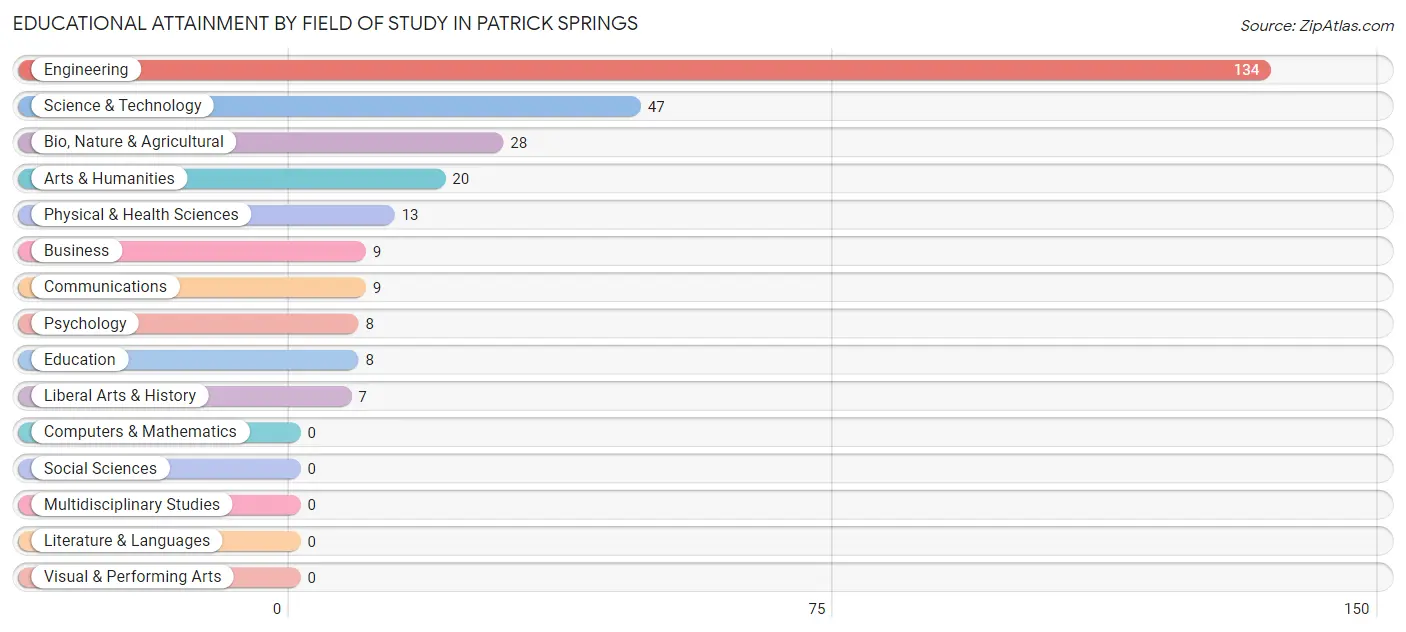
| Field of Study | # Graduates | % Graduates |
| Computers & Mathematics | 0 | 0.0% |
| Bio, Nature & Agricultural | 28 | 9.9% |
| Physical & Health Sciences | 13 | 4.6% |
| Psychology | 8 | 2.8% |
| Social Sciences | 0 | 0.0% |
| Engineering | 134 | 47.3% |
| Multidisciplinary Studies | 0 | 0.0% |
| Science & Technology | 47 | 16.6% |
| Business | 9 | 3.2% |
| Education | 8 | 2.8% |
| Literature & Languages | 0 | 0.0% |
| Liberal Arts & History | 7 | 2.5% |
| Visual & Performing Arts | 0 | 0.0% |
| Communications | 9 | 3.2% |
| Arts & Humanities | 20 | 7.1% |
| Total | 283 | 100.0% |
Transportation & Commute in Patrick Springs
Vehicle Availability by Sex in Patrick Springs
The most prevalent vehicle ownership categories in Patrick Springs are males with 2 vehicles (170, accounting for 36.5%) and females with 2 vehicles (101, making up 59.4%).
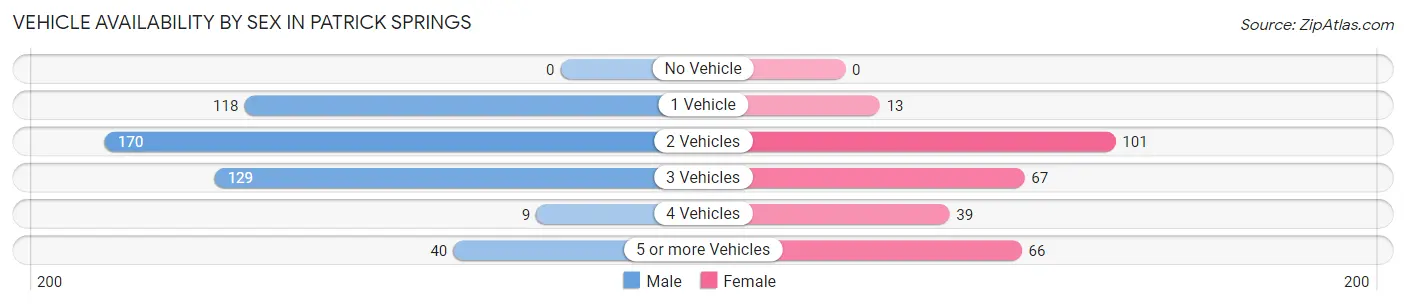
| Vehicles Available | Male | Female |
| No Vehicle | 0 (0.0%) | 0 (0.0%) |
| 1 Vehicle | 118 (25.3%) | 13 (4.5%) |
| 2 Vehicles | 170 (36.5%) | 101 (35.3%) |
| 3 Vehicles | 129 (27.7%) | 67 (23.4%) |
| 4 Vehicles | 9 (1.9%) | 39 (13.6%) |
| 5 or more Vehicles | 40 (8.6%) | 66 (23.1%) |
| Total | 466 (100.0%) | 286 (100.0%) |
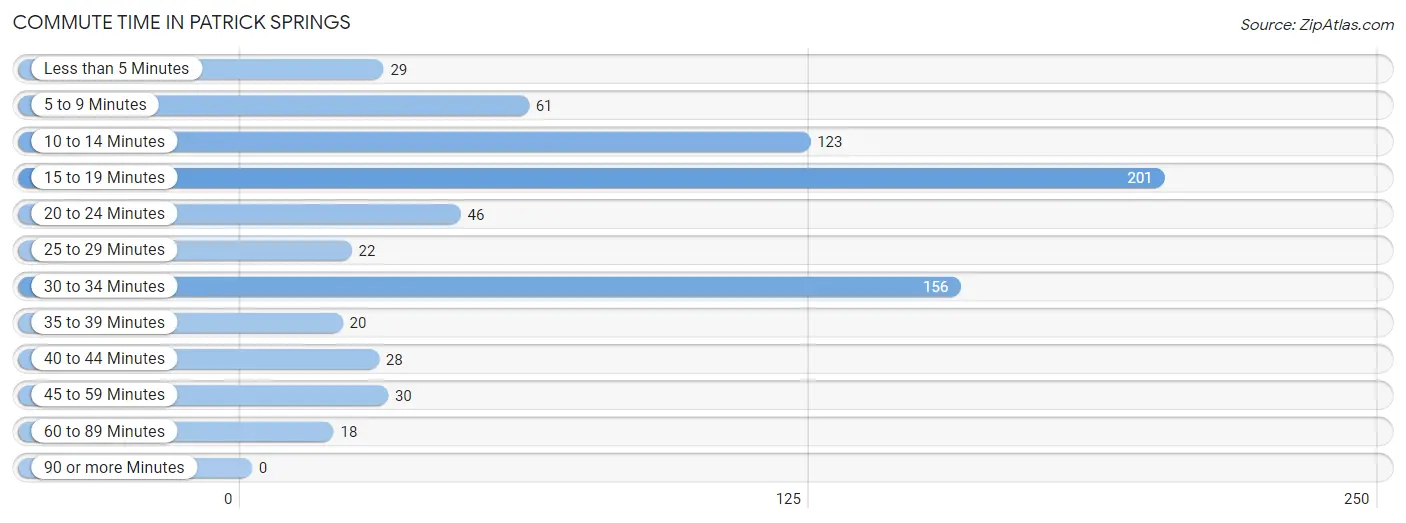
Commute Time in Patrick Springs
The most frequently occuring commute durations in Patrick Springs are 15 to 19 minutes (201 commuters, 27.4%), 30 to 34 minutes (156 commuters, 21.2%), and 10 to 14 minutes (123 commuters, 16.8%).
| Commute Time | # Commuters | % Commuters |
| Less than 5 Minutes | 29 | 4.0% |
| 5 to 9 Minutes | 61 | 8.3% |
| 10 to 14 Minutes | 123 | 16.8% |
| 15 to 19 Minutes | 201 | 27.4% |
| 20 to 24 Minutes | 46 | 6.3% |
| 25 to 29 Minutes | 22 | 3.0% |
| 30 to 34 Minutes | 156 | 21.2% |
| 35 to 39 Minutes | 20 | 2.7% |
| 40 to 44 Minutes | 28 | 3.8% |
| 45 to 59 Minutes | 30 | 4.1% |
| 60 to 89 Minutes | 18 | 2.5% |
| 90 or more Minutes | 0 | 0.0% |
Commute Time by Sex in Patrick Springs
The most common commute times in Patrick Springs are 15 to 19 minutes (124 commuters, 26.6%) for males and 30 to 34 minutes (84 commuters, 31.3%) for females.
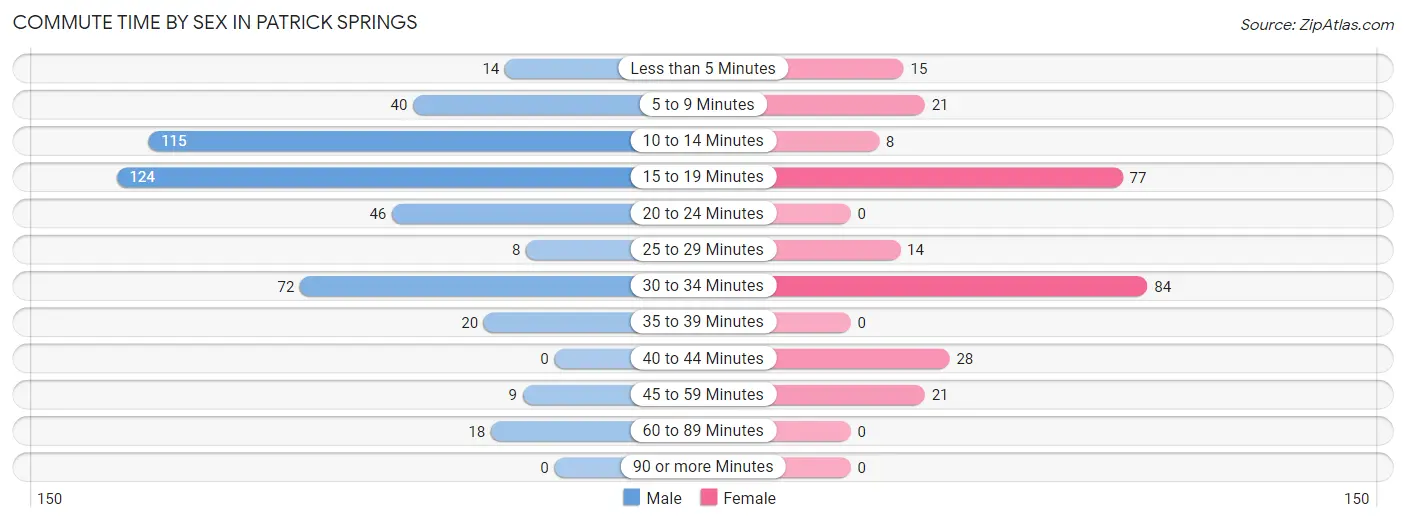
| Commute Time | Male | Female |
| Less than 5 Minutes | 14 (3.0%) | 15 (5.6%) |
| 5 to 9 Minutes | 40 (8.6%) | 21 (7.8%) |
| 10 to 14 Minutes | 115 (24.7%) | 8 (3.0%) |
| 15 to 19 Minutes | 124 (26.6%) | 77 (28.7%) |
| 20 to 24 Minutes | 46 (9.9%) | 0 (0.0%) |
| 25 to 29 Minutes | 8 (1.7%) | 14 (5.2%) |
| 30 to 34 Minutes | 72 (15.4%) | 84 (31.3%) |
| 35 to 39 Minutes | 20 (4.3%) | 0 (0.0%) |
| 40 to 44 Minutes | 0 (0.0%) | 28 (10.4%) |
| 45 to 59 Minutes | 9 (1.9%) | 21 (7.8%) |
| 60 to 89 Minutes | 18 (3.9%) | 0 (0.0%) |
| 90 or more Minutes | 0 (0.0%) | 0 (0.0%) |
Time of Departure to Work by Sex in Patrick Springs
The most frequent times of departure to work in Patrick Springs are 7:00 AM to 7:29 AM (152, 32.6%) for males and 6:30 AM to 6:59 AM (89, 33.2%) for females.
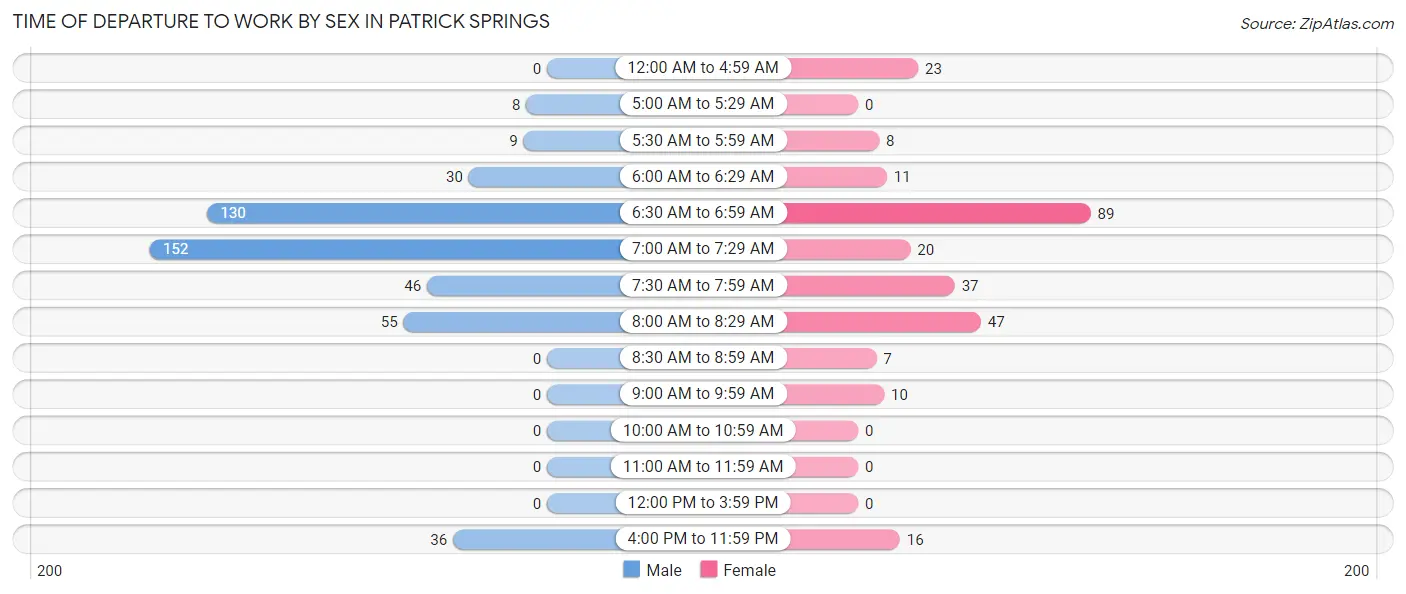
| Time of Departure | Male | Female |
| 12:00 AM to 4:59 AM | 0 (0.0%) | 23 (8.6%) |
| 5:00 AM to 5:29 AM | 8 (1.7%) | 0 (0.0%) |
| 5:30 AM to 5:59 AM | 9 (1.9%) | 8 (3.0%) |
| 6:00 AM to 6:29 AM | 30 (6.4%) | 11 (4.1%) |
| 6:30 AM to 6:59 AM | 130 (27.9%) | 89 (33.2%) |
| 7:00 AM to 7:29 AM | 152 (32.6%) | 20 (7.5%) |
| 7:30 AM to 7:59 AM | 46 (9.9%) | 37 (13.8%) |
| 8:00 AM to 8:29 AM | 55 (11.8%) | 47 (17.5%) |
| 8:30 AM to 8:59 AM | 0 (0.0%) | 7 (2.6%) |
| 9:00 AM to 9:59 AM | 0 (0.0%) | 10 (3.7%) |
| 10:00 AM to 10:59 AM | 0 (0.0%) | 0 (0.0%) |
| 11:00 AM to 11:59 AM | 0 (0.0%) | 0 (0.0%) |
| 12:00 PM to 3:59 PM | 0 (0.0%) | 0 (0.0%) |
| 4:00 PM to 11:59 PM | 36 (7.7%) | 16 (6.0%) |
| Total | 466 (100.0%) | 268 (100.0%) |
Housing Occupancy in Patrick Springs
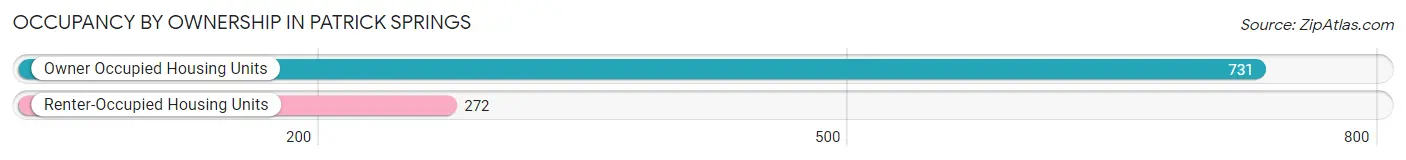
Occupancy by Ownership in Patrick Springs
Of the total 1,003 dwellings in Patrick Springs, owner-occupied units account for 731 (72.9%), while renter-occupied units make up 272 (27.1%).
| Occupancy | # Housing Units | % Housing Units |
| Owner Occupied Housing Units | 731 | 72.9% |
| Renter-Occupied Housing Units | 272 | 27.1% |
| Total Occupied Housing Units | 1,003 | 100.0% |
Occupancy by Household Size in Patrick Springs
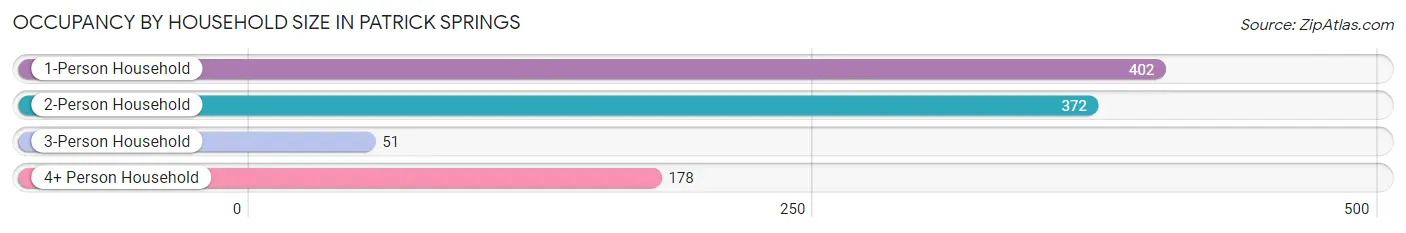
| Household Size | # Housing Units | % Housing Units |
| 1-Person Household | 402 | 40.1% |
| 2-Person Household | 372 | 37.1% |
| 3-Person Household | 51 | 5.1% |
| 4+ Person Household | 178 | 17.7% |
| Total Housing Units | 1,003 | 100.0% |
Occupancy by Ownership by Household Size in Patrick Springs
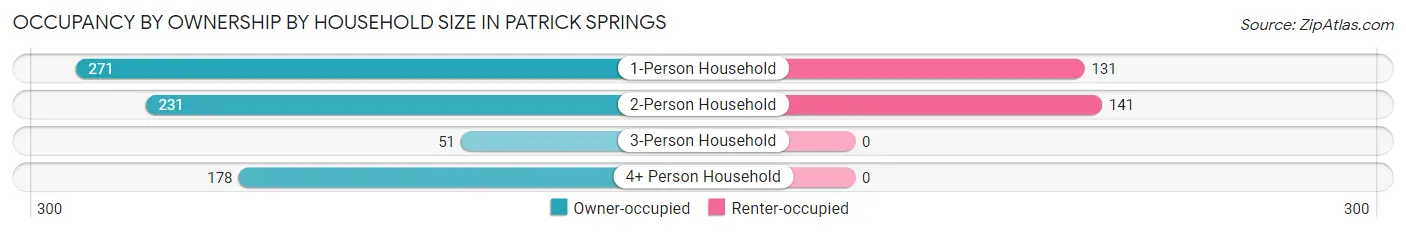
| Household Size | Owner-occupied | Renter-occupied |
| 1-Person Household | 271 (67.4%) | 131 (32.6%) |
| 2-Person Household | 231 (62.1%) | 141 (37.9%) |
| 3-Person Household | 51 (100.0%) | 0 (0.0%) |
| 4+ Person Household | 178 (100.0%) | 0 (0.0%) |
| Total Housing Units | 731 (72.9%) | 272 (27.1%) |
Occupancy by Educational Attainment in Patrick Springs
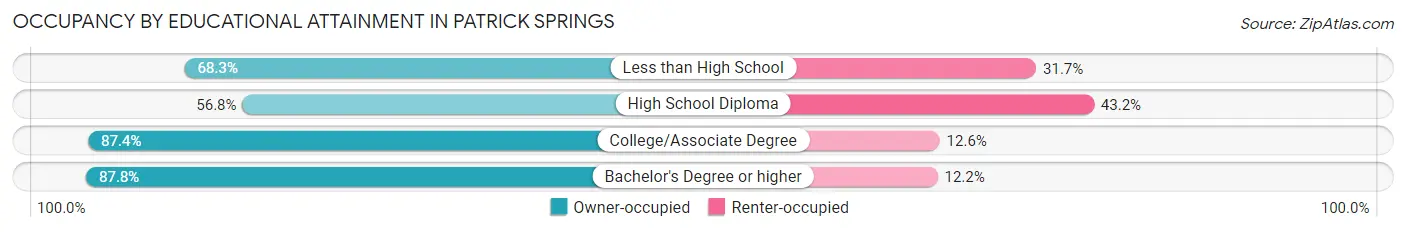
| Household Size | Owner-occupied | Renter-occupied |
| Less than High School | 28 (68.3%) | 13 (31.7%) |
| High School Diploma | 258 (56.8%) | 196 (43.2%) |
| College/Associate Degree | 243 (87.4%) | 35 (12.6%) |
| Bachelor's Degree or higher | 202 (87.8%) | 28 (12.2%) |
Occupancy by Age of Householder in Patrick Springs
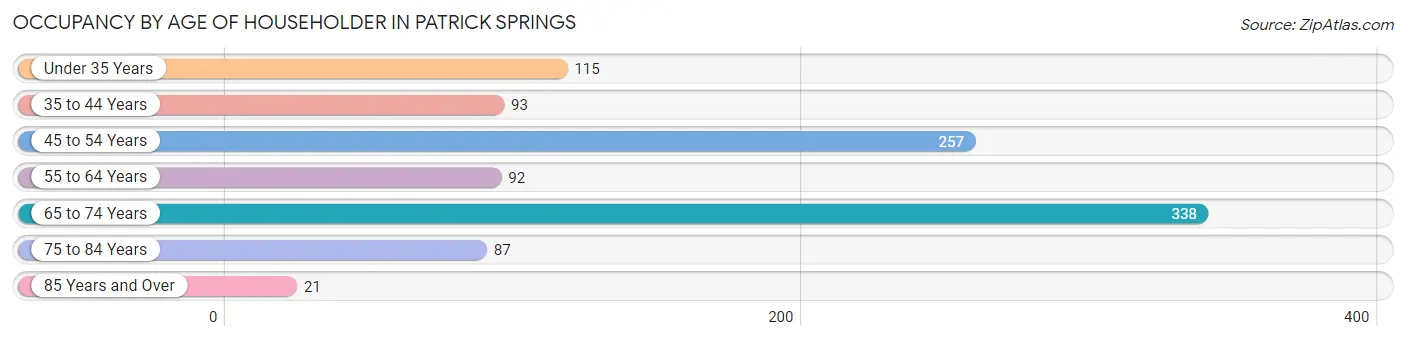
| Age Bracket | # Households | % Households |
| Under 35 Years | 115 | 11.5% |
| 35 to 44 Years | 93 | 9.3% |
| 45 to 54 Years | 257 | 25.6% |
| 55 to 64 Years | 92 | 9.2% |
| 65 to 74 Years | 338 | 33.7% |
| 75 to 84 Years | 87 | 8.7% |
| 85 Years and Over | 21 | 2.1% |
| Total | 1,003 | 100.0% |
Housing Finances in Patrick Springs
Median Income by Occupancy in Patrick Springs
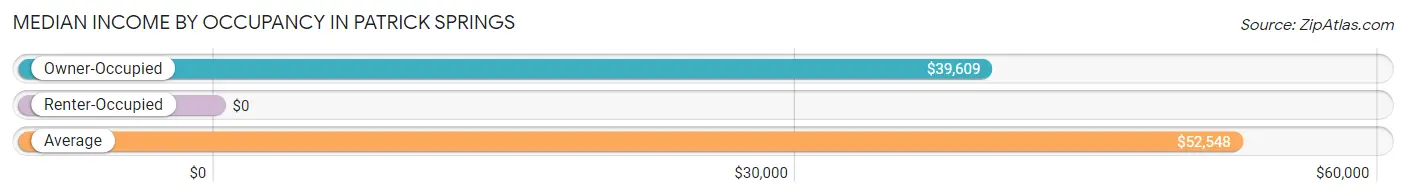
| Occupancy Type | # Households | Median Income |
| Owner-Occupied | 731 (72.9%) | $39,609 |
| Renter-Occupied | 272 (27.1%) | $0 |
| Average | 1,003 (100.0%) | $52,548 |
Occupancy by Householder Income Bracket in Patrick Springs
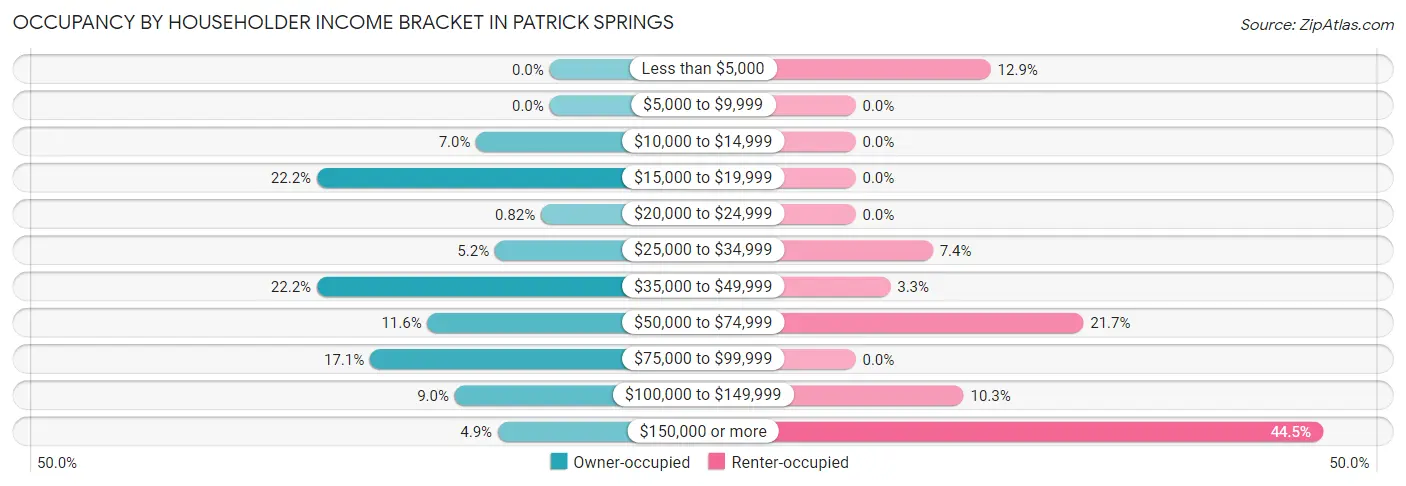
| Income Bracket | Owner-occupied | Renter-occupied |
| Less than $5,000 | 0 (0.0%) | 35 (12.9%) |
| $5,000 to $9,999 | 0 (0.0%) | 0 (0.0%) |
| $10,000 to $14,999 | 51 (7.0%) | 0 (0.0%) |
| $15,000 to $19,999 | 162 (22.2%) | 0 (0.0%) |
| $20,000 to $24,999 | 6 (0.8%) | 0 (0.0%) |
| $25,000 to $34,999 | 38 (5.2%) | 20 (7.3%) |
| $35,000 to $49,999 | 162 (22.2%) | 9 (3.3%) |
| $50,000 to $74,999 | 85 (11.6%) | 59 (21.7%) |
| $75,000 to $99,999 | 125 (17.1%) | 0 (0.0%) |
| $100,000 to $149,999 | 66 (9.0%) | 28 (10.3%) |
| $150,000 or more | 36 (4.9%) | 121 (44.5%) |
| Total | 731 (100.0%) | 272 (100.0%) |
Monthly Housing Cost Tiers in Patrick Springs
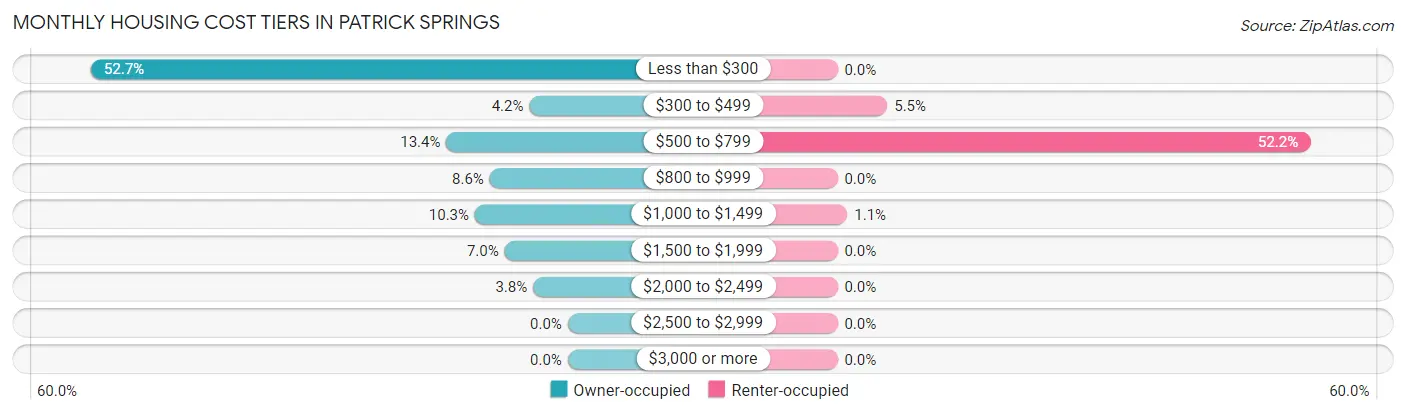
| Monthly Cost | Owner-occupied | Renter-occupied |
| Less than $300 | 385 (52.7%) | 0 (0.0%) |
| $300 to $499 | 31 (4.2%) | 15 (5.5%) |
| $500 to $799 | 98 (13.4%) | 142 (52.2%) |
| $800 to $999 | 63 (8.6%) | 0 (0.0%) |
| $1,000 to $1,499 | 75 (10.3%) | 3 (1.1%) |
| $1,500 to $1,999 | 51 (7.0%) | 0 (0.0%) |
| $2,000 to $2,499 | 28 (3.8%) | 0 (0.0%) |
| $2,500 to $2,999 | 0 (0.0%) | 0 (0.0%) |
| $3,000 or more | 0 (0.0%) | 0 (0.0%) |
| Total | 731 (100.0%) | 272 (100.0%) |
Physical Housing Characteristics in Patrick Springs
Housing Structures in Patrick Springs
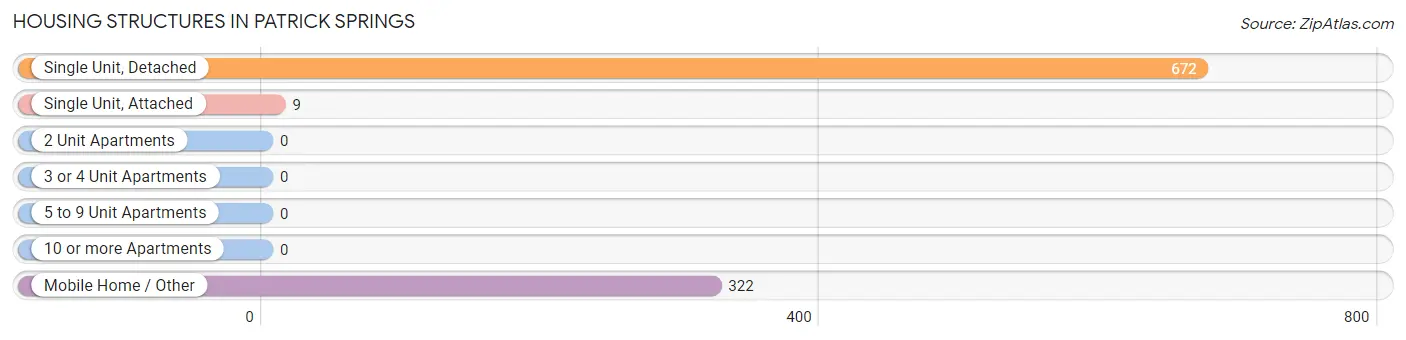
| Structure Type | # Housing Units | % Housing Units |
| Single Unit, Detached | 672 | 67.0% |
| Single Unit, Attached | 9 | 0.9% |
| 2 Unit Apartments | 0 | 0.0% |
| 3 or 4 Unit Apartments | 0 | 0.0% |
| 5 to 9 Unit Apartments | 0 | 0.0% |
| 10 or more Apartments | 0 | 0.0% |
| Mobile Home / Other | 322 | 32.1% |
| Total | 1,003 | 100.0% |
Housing Structures by Occupancy in Patrick Springs
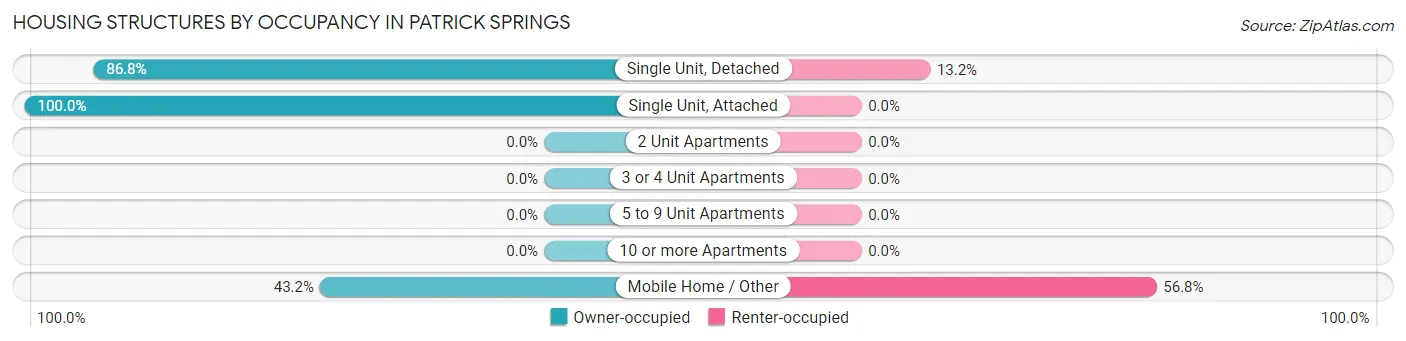
| Structure Type | Owner-occupied | Renter-occupied |
| Single Unit, Detached | 583 (86.8%) | 89 (13.2%) |
| Single Unit, Attached | 9 (100.0%) | 0 (0.0%) |
| 2 Unit Apartments | 0 (0.0%) | 0 (0.0%) |
| 3 or 4 Unit Apartments | 0 (0.0%) | 0 (0.0%) |
| 5 to 9 Unit Apartments | 0 (0.0%) | 0 (0.0%) |
| 10 or more Apartments | 0 (0.0%) | 0 (0.0%) |
| Mobile Home / Other | 139 (43.2%) | 183 (56.8%) |
| Total | 731 (72.9%) | 272 (27.1%) |
Housing Structures by Number of Rooms in Patrick Springs
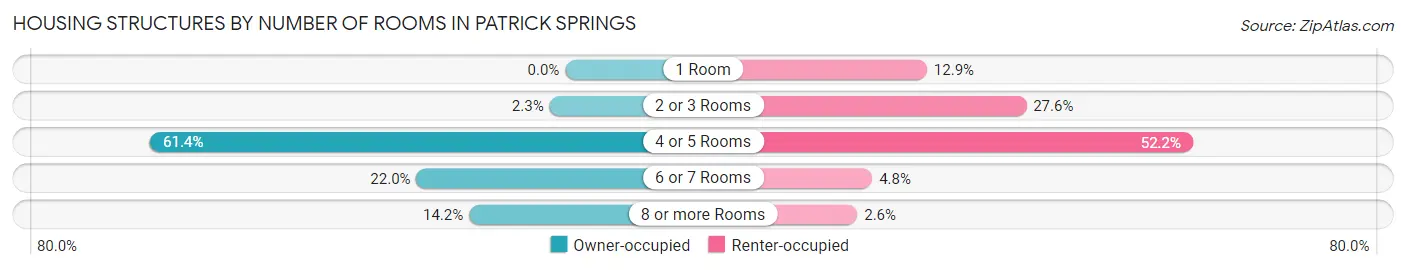
| Number of Rooms | Owner-occupied | Renter-occupied |
| 1 Room | 0 (0.0%) | 35 (12.9%) |
| 2 or 3 Rooms | 17 (2.3%) | 75 (27.6%) |
| 4 or 5 Rooms | 449 (61.4%) | 142 (52.2%) |
| 6 or 7 Rooms | 161 (22.0%) | 13 (4.8%) |
| 8 or more Rooms | 104 (14.2%) | 7 (2.6%) |
| Total | 731 (100.0%) | 272 (100.0%) |
Housing Structure by Heating Type in Patrick Springs
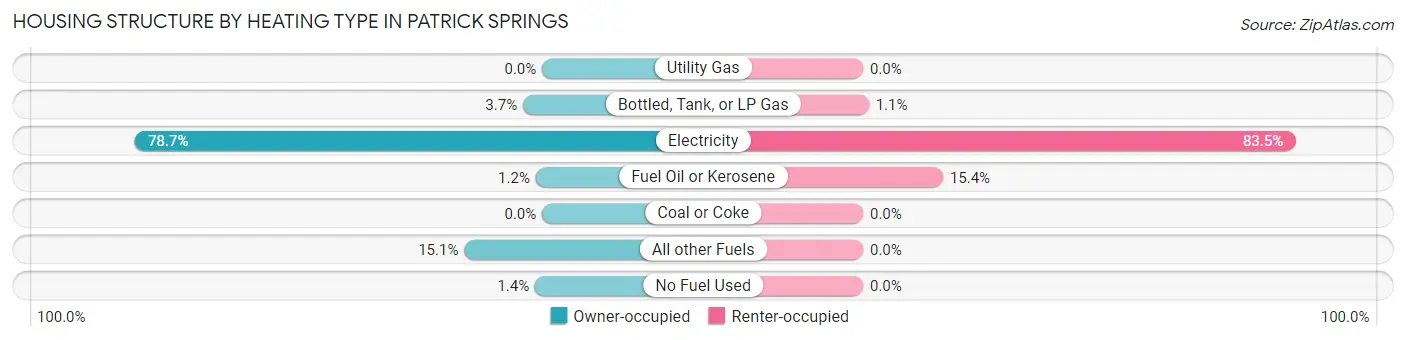
| Heating Type | Owner-occupied | Renter-occupied |
| Utility Gas | 0 (0.0%) | 0 (0.0%) |
| Bottled, Tank, or LP Gas | 27 (3.7%) | 3 (1.1%) |
| Electricity | 575 (78.7%) | 227 (83.5%) |
| Fuel Oil or Kerosene | 9 (1.2%) | 42 (15.4%) |
| Coal or Coke | 0 (0.0%) | 0 (0.0%) |
| All other Fuels | 110 (15.0%) | 0 (0.0%) |
| No Fuel Used | 10 (1.4%) | 0 (0.0%) |
| Total | 731 (100.0%) | 272 (100.0%) |
Household Vehicle Usage in Patrick Springs
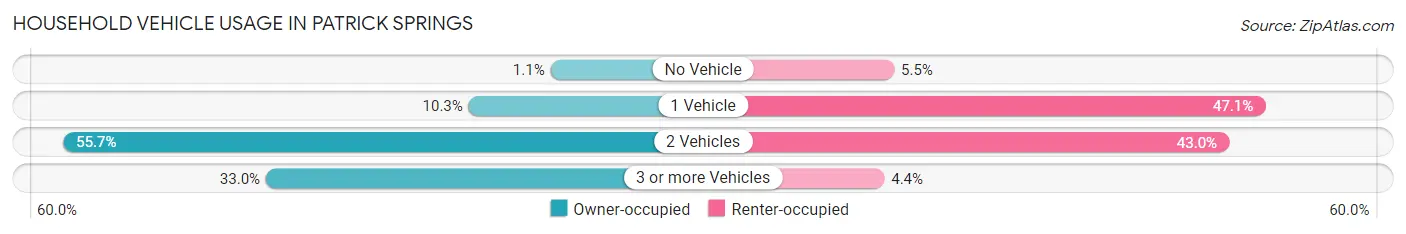
| Vehicles per Household | Owner-occupied | Renter-occupied |
| No Vehicle | 8 (1.1%) | 15 (5.5%) |
| 1 Vehicle | 75 (10.3%) | 128 (47.1%) |
| 2 Vehicles | 407 (55.7%) | 117 (43.0%) |
| 3 or more Vehicles | 241 (33.0%) | 12 (4.4%) |
| Total | 731 (100.0%) | 272 (100.0%) |
Real Estate & Mortgages in Patrick Springs
Real Estate and Mortgage Overview in Patrick Springs
| Characteristic | Without Mortgage | With Mortgage |
| Housing Units | 426 | 305 |
| Median Property Value | $66,700 | $139,600 |
| Median Household Income | $35,711 | $27 |
| Monthly Housing Costs | $270 | $0 |
| Real Estate Taxes | $487 | $20 |
Property Value by Mortgage Status in Patrick Springs
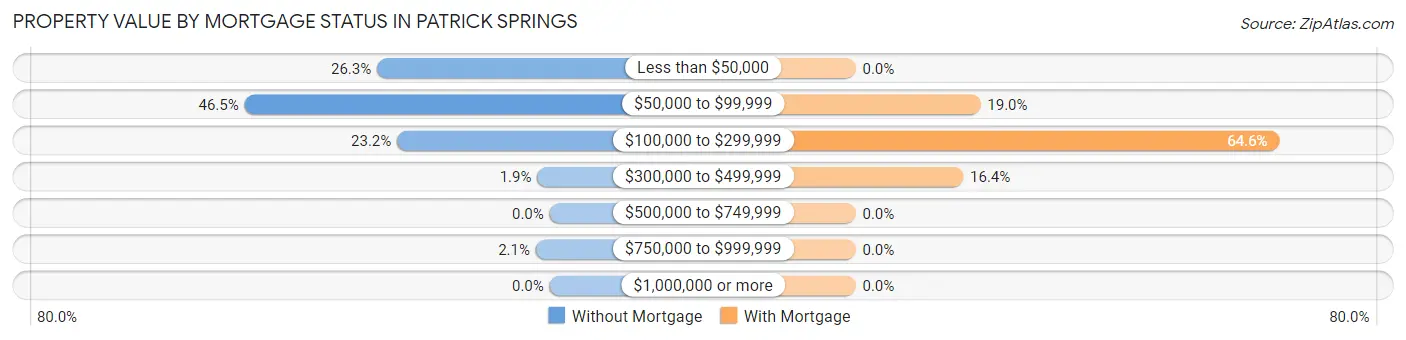
| Property Value | Without Mortgage | With Mortgage |
| Less than $50,000 | 112 (26.3%) | 0 (0.0%) |
| $50,000 to $99,999 | 198 (46.5%) | 58 (19.0%) |
| $100,000 to $299,999 | 99 (23.2%) | 197 (64.6%) |
| $300,000 to $499,999 | 8 (1.9%) | 50 (16.4%) |
| $500,000 to $749,999 | 0 (0.0%) | 0 (0.0%) |
| $750,000 to $999,999 | 9 (2.1%) | 0 (0.0%) |
| $1,000,000 or more | 0 (0.0%) | 0 (0.0%) |
| Total | 426 (100.0%) | 305 (100.0%) |
Household Income by Mortgage Status in Patrick Springs
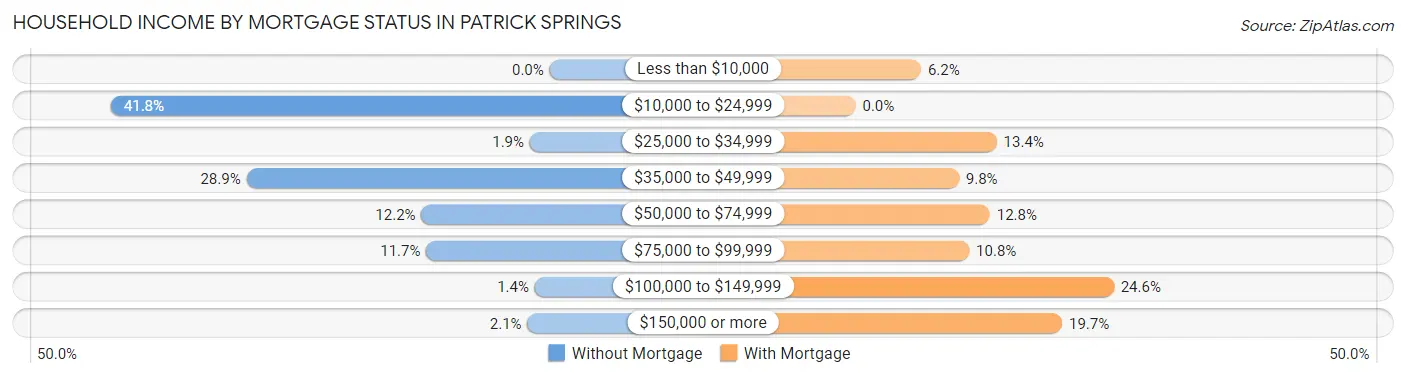
| Household Income | Without Mortgage | With Mortgage |
| Less than $10,000 | 0 (0.0%) | 19 (6.2%) |
| $10,000 to $24,999 | 178 (41.8%) | 0 (0.0%) |
| $25,000 to $34,999 | 8 (1.9%) | 41 (13.4%) |
| $35,000 to $49,999 | 123 (28.9%) | 30 (9.8%) |
| $50,000 to $74,999 | 52 (12.2%) | 39 (12.8%) |
| $75,000 to $99,999 | 50 (11.7%) | 33 (10.8%) |
| $100,000 to $149,999 | 6 (1.4%) | 75 (24.6%) |
| $150,000 or more | 9 (2.1%) | 60 (19.7%) |
| Total | 426 (100.0%) | 305 (100.0%) |
Property Value to Household Income Ratio in Patrick Springs
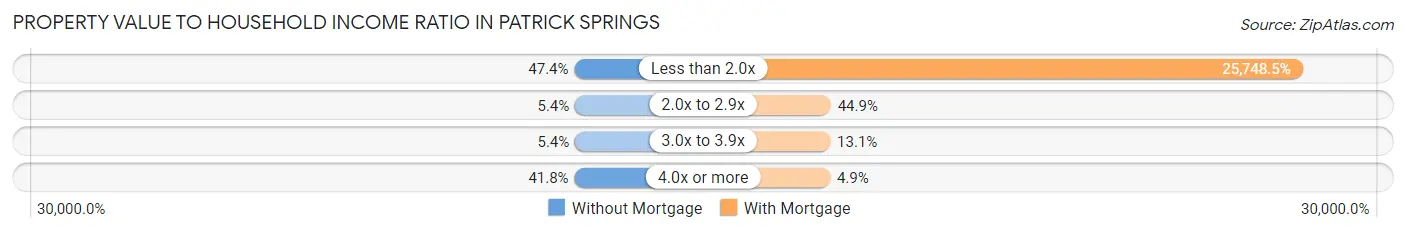
| Value-to-Income Ratio | Without Mortgage | With Mortgage |
| Less than 2.0x | 202 (47.4%) | 78,533 (25,748.5%) |
| 2.0x to 2.9x | 23 (5.4%) | 137 (44.9%) |
| 3.0x to 3.9x | 23 (5.4%) | 40 (13.1%) |
| 4.0x or more | 178 (41.8%) | 15 (4.9%) |
| Total | 426 (100.0%) | 305 (100.0%) |
Real Estate Taxes by Mortgage Status in Patrick Springs
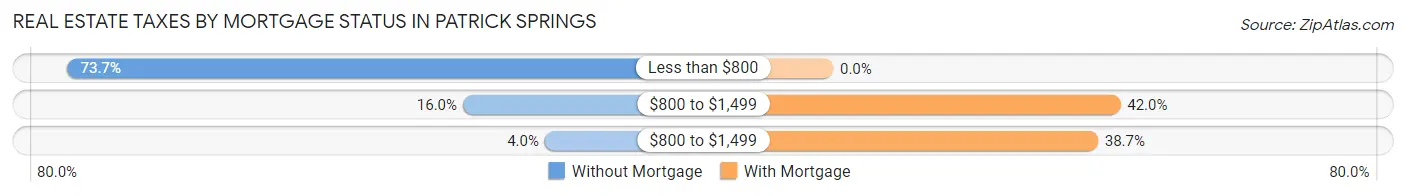
| Property Taxes | Without Mortgage | With Mortgage |
| Less than $800 | 314 (73.7%) | 0 (0.0%) |
| $800 to $1,499 | 68 (16.0%) | 128 (42.0%) |
| $800 to $1,499 | 17 (4.0%) | 118 (38.7%) |
| Total | 426 (100.0%) | 305 (100.0%) |
Health & Disability in Patrick Springs
Health Insurance Coverage by Age in Patrick Springs
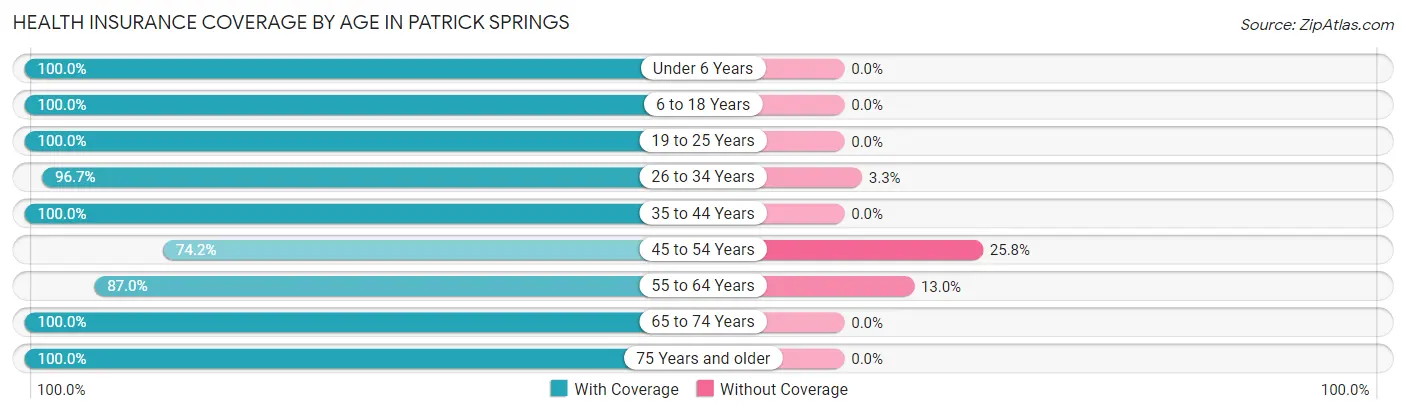
| Age Bracket | With Coverage | Without Coverage |
| Under 6 Years | 201 (100.0%) | 0 (0.0%) |
| 6 to 18 Years | 313 (100.0%) | 0 (0.0%) |
| 19 to 25 Years | 56 (100.0%) | 0 (0.0%) |
| 26 to 34 Years | 236 (96.7%) | 8 (3.3%) |
| 35 to 44 Years | 255 (100.0%) | 0 (0.0%) |
| 45 to 54 Years | 264 (74.2%) | 92 (25.8%) |
| 55 to 64 Years | 134 (87.0%) | 20 (13.0%) |
| 65 to 74 Years | 467 (100.0%) | 0 (0.0%) |
| 75 Years and older | 158 (100.0%) | 0 (0.0%) |
| Total | 2,084 (94.6%) | 120 (5.4%) |
Health Insurance Coverage by Citizenship Status in Patrick Springs
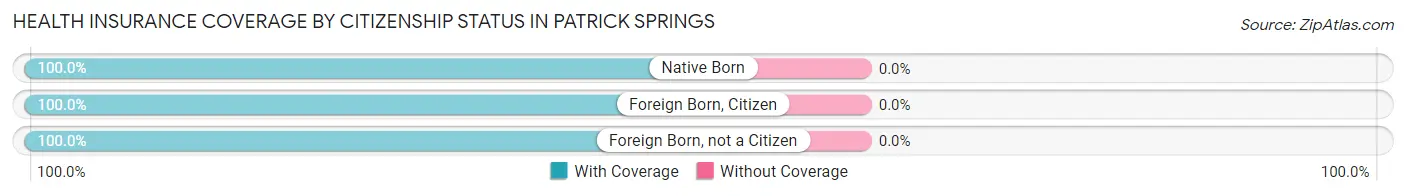
| Citizenship Status | With Coverage | Without Coverage |
| Native Born | 201 (100.0%) | 0 (0.0%) |
| Foreign Born, Citizen | 313 (100.0%) | 0 (0.0%) |
| Foreign Born, not a Citizen | 56 (100.0%) | 0 (0.0%) |
Health Insurance Coverage by Household Income in Patrick Springs
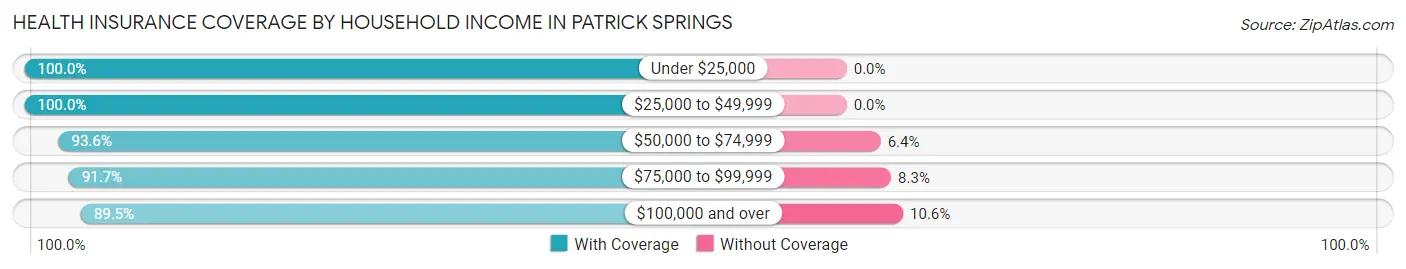
| Household Income | With Coverage | Without Coverage |
| Under $25,000 | 273 (100.0%) | 0 (0.0%) |
| $25,000 to $49,999 | 587 (100.0%) | 0 (0.0%) |
| $50,000 to $74,999 | 265 (93.6%) | 18 (6.4%) |
| $75,000 to $99,999 | 408 (91.7%) | 37 (8.3%) |
| $100,000 and over | 551 (89.4%) | 65 (10.5%) |
Public vs Private Health Insurance Coverage by Age in Patrick Springs
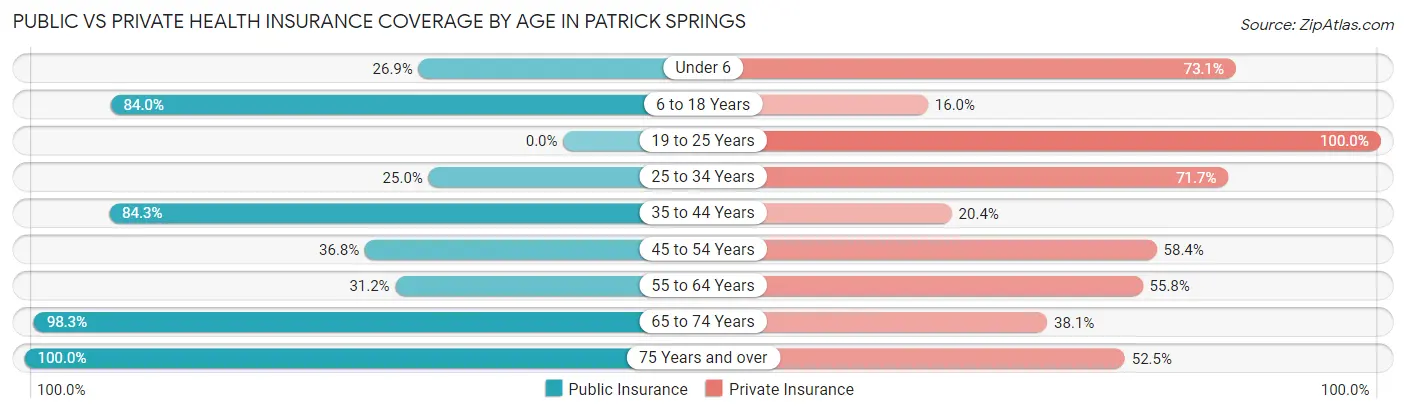
| Age Bracket | Public Insurance | Private Insurance |
| Under 6 | 54 (26.9%) | 147 (73.1%) |
| 6 to 18 Years | 263 (84.0%) | 50 (16.0%) |
| 19 to 25 Years | 0 (0.0%) | 56 (100.0%) |
| 25 to 34 Years | 61 (25.0%) | 175 (71.7%) |
| 35 to 44 Years | 215 (84.3%) | 52 (20.4%) |
| 45 to 54 Years | 131 (36.8%) | 208 (58.4%) |
| 55 to 64 Years | 48 (31.2%) | 86 (55.8%) |
| 65 to 74 Years | 459 (98.3%) | 178 (38.1%) |
| 75 Years and over | 158 (100.0%) | 83 (52.5%) |
| Total | 1,389 (63.0%) | 1,035 (47.0%) |
Disability Status by Sex by Age in Patrick Springs
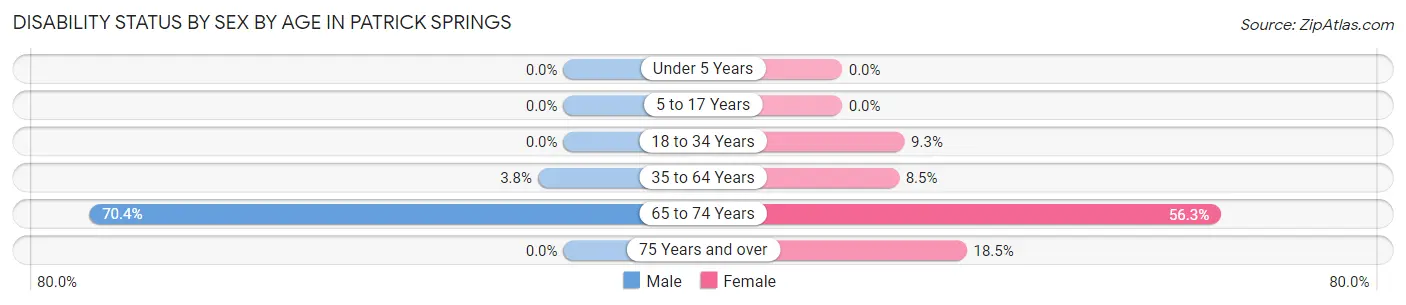
| Age Bracket | Male | Female |
| Under 5 Years | 0 (0.0%) | 0 (0.0%) |
| 5 to 17 Years | 0 (0.0%) | 0 (0.0%) |
| 18 to 34 Years | 0 (0.0%) | 15 (9.3%) |
| 35 to 64 Years | 16 (3.8%) | 29 (8.5%) |
| 65 to 74 Years | 245 (70.4%) | 67 (56.3%) |
| 75 Years and over | 0 (0.0%) | 25 (18.5%) |
Disability Class by Sex by Age in Patrick Springs
Disability Class: Hearing Difficulty
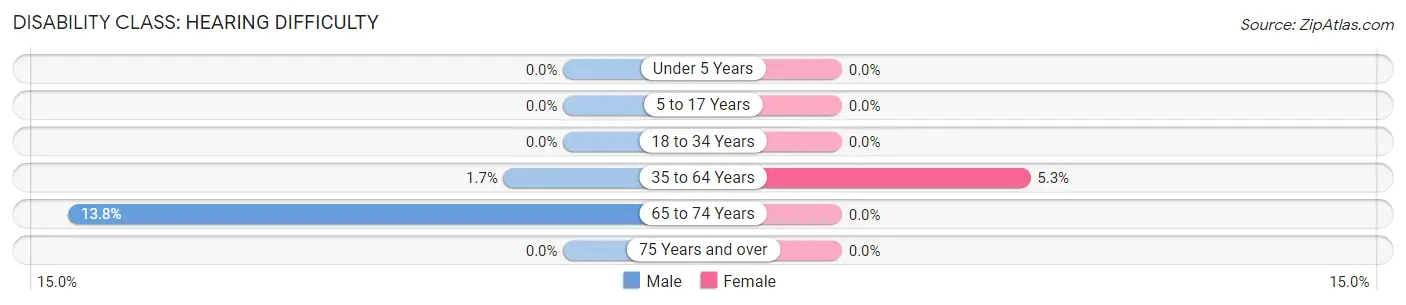
| Age Bracket | Male | Female |
| Under 5 Years | 0 (0.0%) | 0 (0.0%) |
| 5 to 17 Years | 0 (0.0%) | 0 (0.0%) |
| 18 to 34 Years | 0 (0.0%) | 0 (0.0%) |
| 35 to 64 Years | 7 (1.7%) | 18 (5.2%) |
| 65 to 74 Years | 48 (13.8%) | 0 (0.0%) |
| 75 Years and over | 0 (0.0%) | 0 (0.0%) |
Disability Class: Vision Difficulty
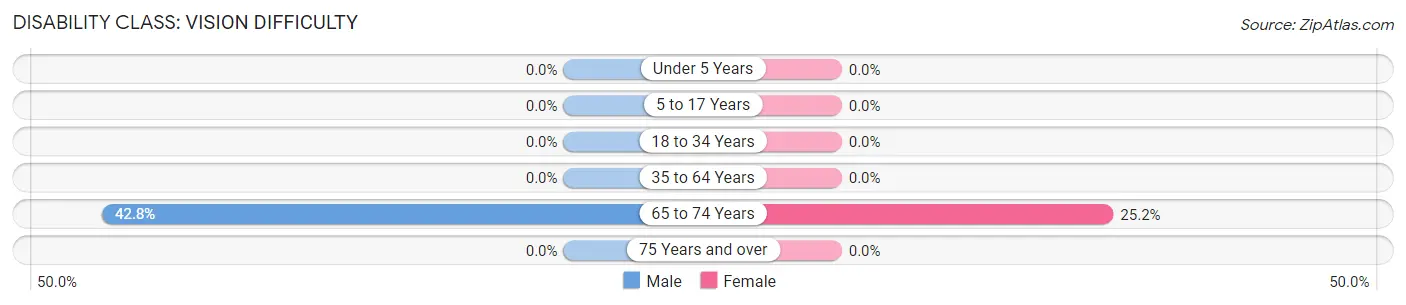
| Age Bracket | Male | Female |
| Under 5 Years | 0 (0.0%) | 0 (0.0%) |
| 5 to 17 Years | 0 (0.0%) | 0 (0.0%) |
| 18 to 34 Years | 0 (0.0%) | 0 (0.0%) |
| 35 to 64 Years | 0 (0.0%) | 0 (0.0%) |
| 65 to 74 Years | 149 (42.8%) | 30 (25.2%) |
| 75 Years and over | 0 (0.0%) | 0 (0.0%) |
Disability Class: Cognitive Difficulty
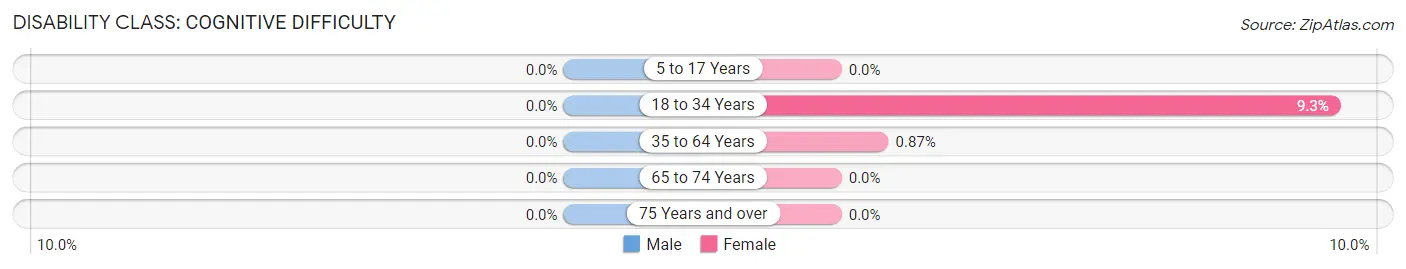
| Age Bracket | Male | Female |
| 5 to 17 Years | 0 (0.0%) | 0 (0.0%) |
| 18 to 34 Years | 0 (0.0%) | 15 (9.3%) |
| 35 to 64 Years | 0 (0.0%) | 3 (0.9%) |
| 65 to 74 Years | 0 (0.0%) | 0 (0.0%) |
| 75 Years and over | 0 (0.0%) | 0 (0.0%) |
Disability Class: Ambulatory Difficulty
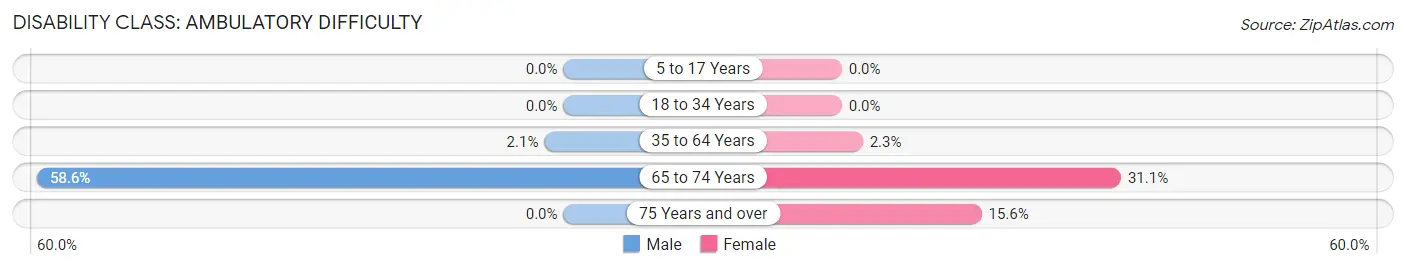
| Age Bracket | Male | Female |
| 5 to 17 Years | 0 (0.0%) | 0 (0.0%) |
| 18 to 34 Years | 0 (0.0%) | 0 (0.0%) |
| 35 to 64 Years | 9 (2.1%) | 8 (2.3%) |
| 65 to 74 Years | 204 (58.6%) | 37 (31.1%) |
| 75 Years and over | 0 (0.0%) | 21 (15.6%) |
Disability Class: Self-Care Difficulty
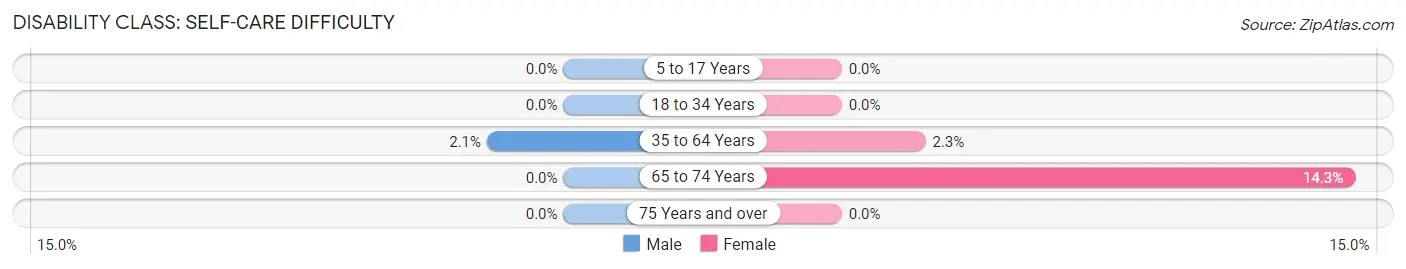
| Age Bracket | Male | Female |
| 5 to 17 Years | 0 (0.0%) | 0 (0.0%) |
| 18 to 34 Years | 0 (0.0%) | 0 (0.0%) |
| 35 to 64 Years | 9 (2.1%) | 8 (2.3%) |
| 65 to 74 Years | 0 (0.0%) | 17 (14.3%) |
| 75 Years and over | 0 (0.0%) | 0 (0.0%) |
Technology Access in Patrick Springs
Computing Device Access in Patrick Springs
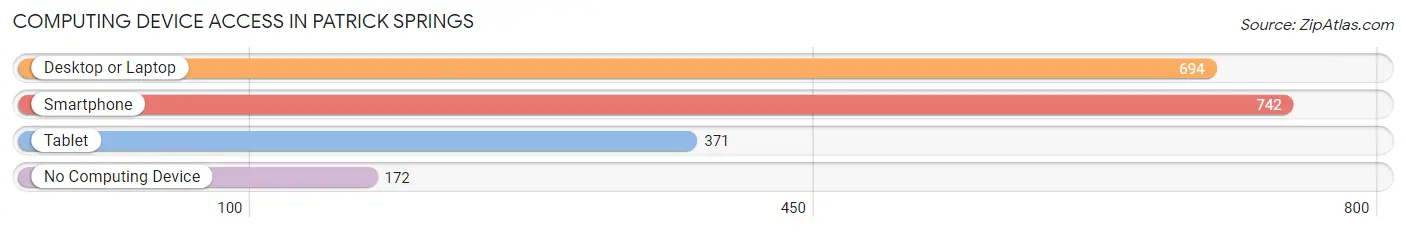
| Device Type | # Households | % Households |
| Desktop or Laptop | 694 | 69.2% |
| Smartphone | 742 | 74.0% |
| Tablet | 371 | 37.0% |
| No Computing Device | 172 | 17.2% |
| Total | 1,003 | 100.0% |
Internet Access in Patrick Springs
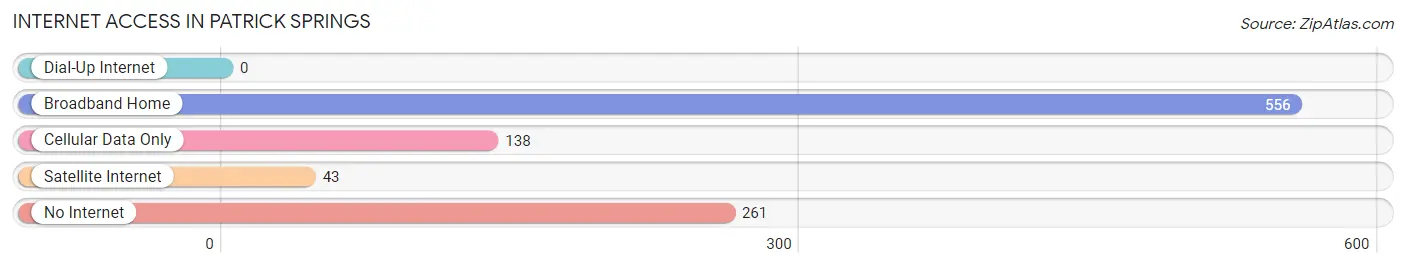
| Internet Type | # Households | % Households |
| Dial-Up Internet | 0 | 0.0% |
| Broadband Home | 556 | 55.4% |
| Cellular Data Only | 138 | 13.8% |
| Satellite Internet | 43 | 4.3% |
| No Internet | 261 | 26.0% |
| Total | 1,003 | 100.0% |
Patrick Springs Summary
History
Patrick Springs is a small town located in Patrick County, Virginia. It is situated in the foothills of the Blue Ridge Mountains and is part of the Dan River Region. The town was founded in 1790 by William Patrick, a Revolutionary War veteran, and was originally known as Patrick’s Store. The town was officially incorporated in 1872 and was named after William Patrick.
Patrick Springs has a rich history that is closely tied to the development of the railroad in the area. In 1856, the Danville and Wytheville Railroad was built through the town, connecting it to the larger cities of Danville and Wytheville. This allowed for the growth of the town and the development of the local economy. The railroad also allowed for the transportation of goods and services to and from the town, which helped to further its growth.
The town was also home to a number of prominent figures in the Civil War. Confederate General Robert E. Lee was born in Patrick Springs in 1807 and his family owned a large plantation in the area. Confederate General Stonewall Jackson also had ties to the town, as he was born in nearby Clarksville.
Geography
Patrick Springs is located in the foothills of the Blue Ridge Mountains in Patrick County, Virginia. The town is situated along the Dan River, which is a tributary of the Roanoke River. The town is located approximately 30 miles northwest of the city of Danville and is about an hour and a half drive from the state capital of Richmond.
The town is surrounded by rolling hills and is home to a number of small farms and rural communities. The town is also home to a number of parks and recreational areas, including the Patrick Springs Recreation Area, which offers camping, fishing, and hiking opportunities.
Economy
The economy of Patrick Springs is largely based on agriculture and manufacturing. The town is home to a number of small farms, which produce a variety of crops, including corn, soybeans, and tobacco. The town is also home to a number of manufacturing companies, which produce a variety of products, including furniture, textiles, and automotive parts.
The town is also home to a number of small businesses, including restaurants, retail stores, and service providers. The town is also home to a number of tourist attractions, including the Patrick Springs Recreation Area, which offers camping, fishing, and hiking opportunities.
Demographics
As of the 2010 census, the population of Patrick Springs was 1,845. The town has a population that is largely white (94.3%) and African American (3.7%). The median household income in the town is $37,917 and the median age is 43.7 years. The town has a poverty rate of 17.3%, which is higher than the national average.
Conclusion
Patrick Springs is a small town located in Patrick County, Virginia. It is situated in the foothills of the Blue Ridge Mountains and is part of the Dan River Region. The town has a rich history that is closely tied to the development of the railroad in the area and is home to a number of prominent figures in the Civil War. The economy of Patrick Springs is largely based on agriculture and manufacturing and the town is home to a number of small businesses, tourist attractions, and recreational areas. The population of Patrick Springs is largely white and the median household income is $37,917.
Common Questions
What is Per Capita Income in Patrick Springs?
Per Capita income in Patrick Springs is $35,750.
What is the Median Family Income in Patrick Springs?
Median Family Income in Patrick Springs is $66,477.
What is the Median Household income in Patrick Springs?
Median Household Income in Patrick Springs is $52,548.
What is Income or Wage Gap in Patrick Springs?
Income or Wage Gap in Patrick Springs is 17.6%.
Women in Patrick Springs earn 82.4 cents for every dollar earned by a man.
What is Inequality or Gini Index in Patrick Springs?
Inequality or Gini Index in Patrick Springs is 0.50.
What is the Total Population of Patrick Springs?
Total Population of Patrick Springs is 2,204.
What is the Total Male Population of Patrick Springs?
Total Male Population of Patrick Springs is 1,129.
What is the Total Female Population of Patrick Springs?
Total Female Population of Patrick Springs is 1,075.
What is the Ratio of Males per 100 Females in Patrick Springs?
There are 105.02 Males per 100 Females in Patrick Springs.
What is the Ratio of Females per 100 Males in Patrick Springs?
There are 95.22 Females per 100 Males in Patrick Springs.
What is the Median Population Age in Patrick Springs?
Median Population Age in Patrick Springs is 46.1 Years.
What is the Average Family Size in Patrick Springs
Average Family Size in Patrick Springs is 3.3 People.
What is the Average Household Size in Patrick Springs
Average Household Size in Patrick Springs is 2.2 People.
How Large is the Labor Force in Patrick Springs?
There are 818 People in the Labor Forcein in Patrick Springs.
What is the Percentage of People in the Labor Force in Patrick Springs?
43.2% of People are in the Labor Force in Patrick Springs.
What is the Unemployment Rate in Patrick Springs?
Unemployment Rate in Patrick Springs is 1.7%.