Zip Codes with the Largest Hispanic or Latino Community in Tyler, TX
RELATED REPORTS & OPTIONS
Hispanic or Latino
Tyler
Compare Zip Codes
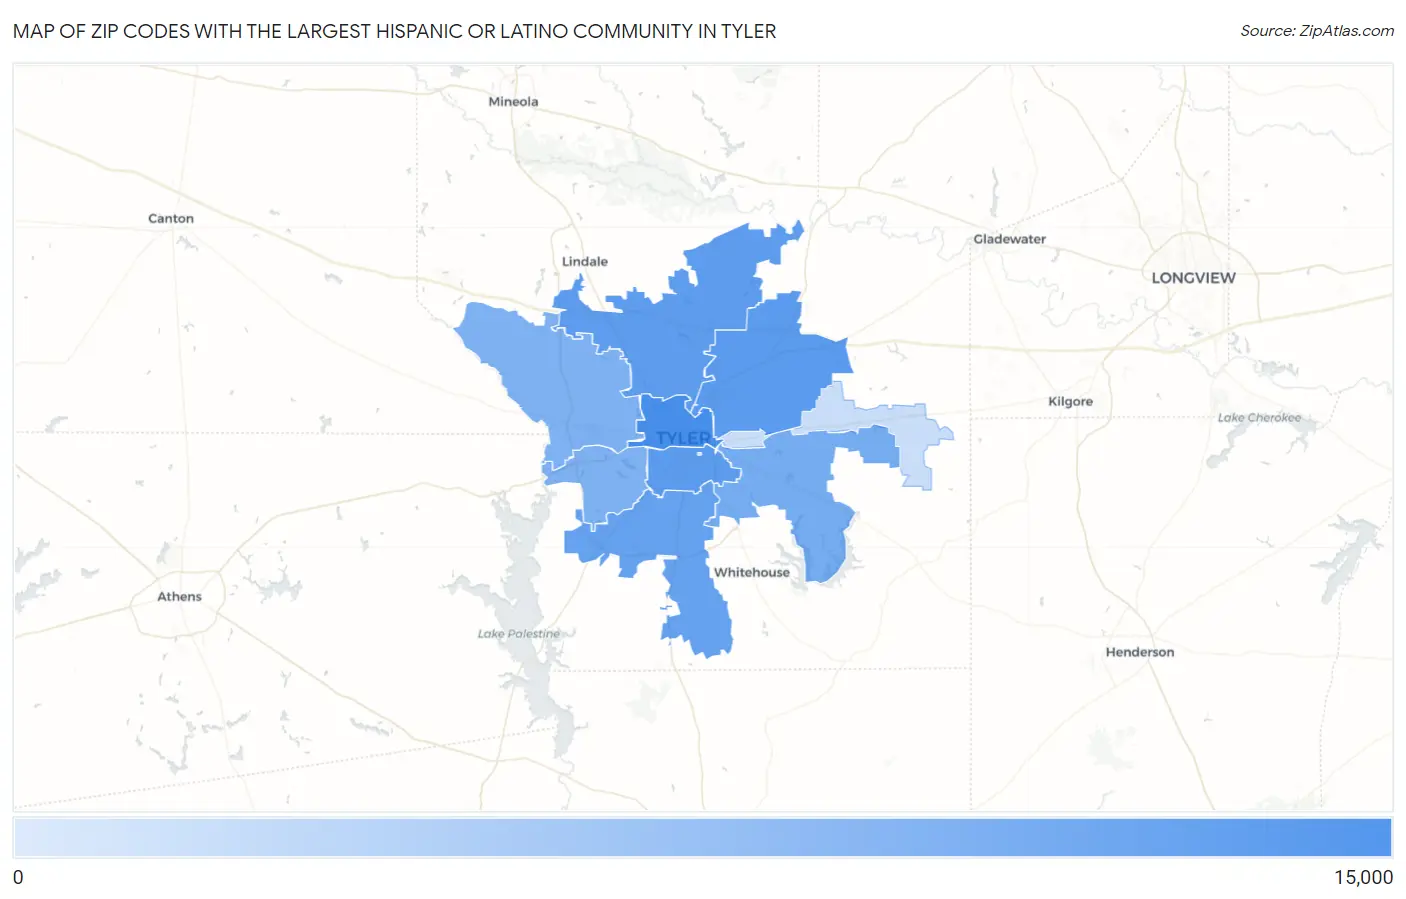
Map of Zip Codes with the Largest Hispanic or Latino Community in Tyler
34
13,077
Zip Codes with the Largest Hispanic or Latino Community in Tyler, TX
| Zip Code | Hispanic or Latino | vs State | vs National | |
| 1. | 75702 | 13,077 | 11,665,280(0.11%)#285 | 61,755,866(0.02%)#1,280 |
| 2. | 75708 | 6,080 | 11,665,280(0.05%)#537 | 61,755,866(0.01%)#2,690 |
| 3. | 75701 | 5,960 | 11,665,280(0.05%)#551 | 61,755,866(0.01%)#2,746 |
| 4. | 75706 | 5,229 | 11,665,280(0.04%)#598 | 61,755,866(0.01%)#3,056 |
| 5. | 75703 | 4,042 | 11,665,280(0.03%)#683 | 61,755,866(0.01%)#3,715 |
| 6. | 75707 | 2,083 | 11,665,280(0.02%)#877 | 61,755,866(0.00%)#5,674 |
| 7. | 75704 | 1,524 | 11,665,280(0.01%)#945 | 61,755,866(0.00%)#6,710 |
| 8. | 75709 | 1,420 | 11,665,280(0.01%)#965 | 61,755,866(0.00%)#6,956 |
| 9. | 75705 | 76 | 11,665,280(0.00%)#1,575 | 61,755,866(0.00%)#17,907 |
| 10. | 75711 | 34 | 11,665,280(0.00%)#1,700 | 61,755,866(0.00%)#21,063 |
1
Common Questions
What are the Top 5 Zip Codes with the Largest Hispanic or Latino Community in Tyler, TX?
Top 5 Zip Codes with the Largest Hispanic or Latino Community in Tyler, TX are:
What zip code has the Largest Hispanic or Latino Community in Tyler, TX?
75702 has the Largest Hispanic or Latino Community in Tyler, TX with 13,077.
What is the Total Hispanic or Latino Population in Tyler, TX?
Total Hispanic or Latino Population in Tyler is 23,070.
What is the Total Hispanic or Latino Population in Texas?
Total Hispanic or Latino Population in Texas is 11,665,280.
What is the Total Hispanic or Latino Population in the United States?
Total Hispanic or Latino Population in the United States is 61,755,866.