Zip Codes with the Highest Percentage of Population Employed in Real Estate, Rental & Leasing in Richmond, TX
RELATED REPORTS & OPTIONS
Real Estate, Rental & Leasing
Richmond
Compare Zip Codes
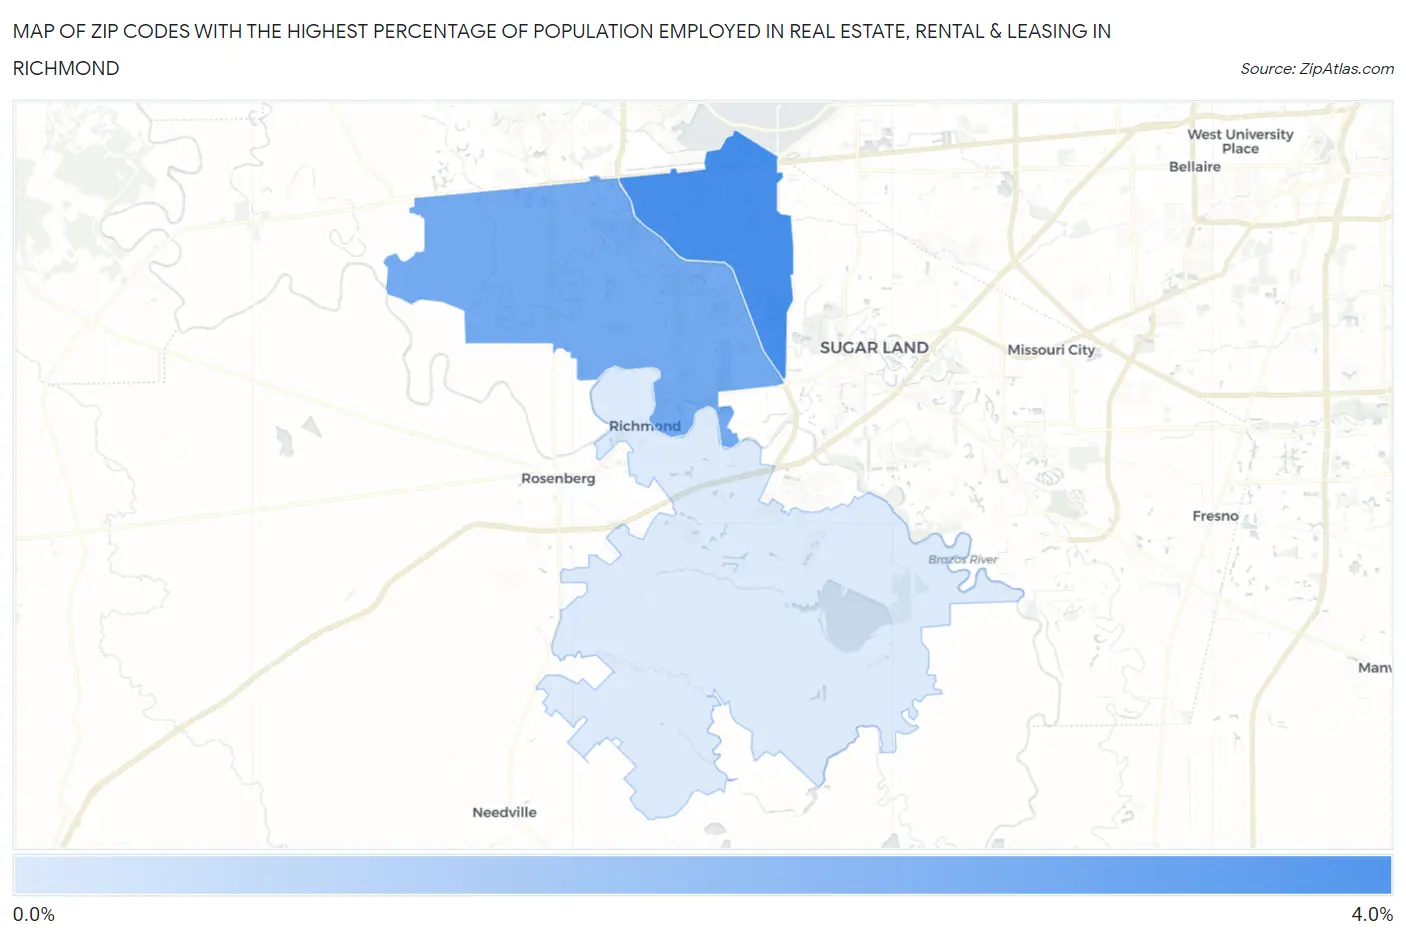
Map of Zip Codes with the Highest Percentage of Population Employed in Real Estate, Rental & Leasing in Richmond
0.95%
3.3%
Zip Codes with the Highest Percentage of Population Employed in Real Estate, Rental & Leasing in Richmond, TX
| Zip Code | % Employed | vs State | vs National | |
| 1. | 77407 | 3.3% | 2.0%(+1.29)#203 | 1.9%(+1.41)#3,203 |
| 2. | 77406 | 2.6% | 2.0%(+0.611)#347 | 1.9%(+0.727)#5,041 |
| 3. | 77469 | 0.95% | 2.0%(-1.06)#1,053 | 1.9%(-0.945)#15,583 |
1
Common Questions
What are the Top Zip Codes with the Highest Percentage of Population Employed in Real Estate, Rental & Leasing in Richmond, TX?
Top Zip Codes with the Highest Percentage of Population Employed in Real Estate, Rental & Leasing in Richmond, TX are:
What zip code has the Highest Percentage of Population Employed in Real Estate, Rental & Leasing in Richmond, TX?
77407 has the Highest Percentage of Population Employed in Real Estate, Rental & Leasing in Richmond, TX with 3.3%.
What is the Percentage of Population Employed in Real Estate, Rental & Leasing in Richmond, TX?
Percentage of Population Employed in Real Estate, Rental & Leasing in Richmond is 0.18%.
What is the Percentage of Population Employed in Real Estate, Rental & Leasing in Texas?
Percentage of Population Employed in Real Estate, Rental & Leasing in Texas is 2.0%.
What is the Percentage of Population Employed in Real Estate, Rental & Leasing in the United States?
Percentage of Population Employed in Real Estate, Rental & Leasing in the United States is 1.9%.