Zip Codes with the Highest Percentage of Population Employed in Administrative & Support Services in New Braunfels, TX
RELATED REPORTS & OPTIONS
Administrative & Support Services
New Braunfels
Compare Zip Codes
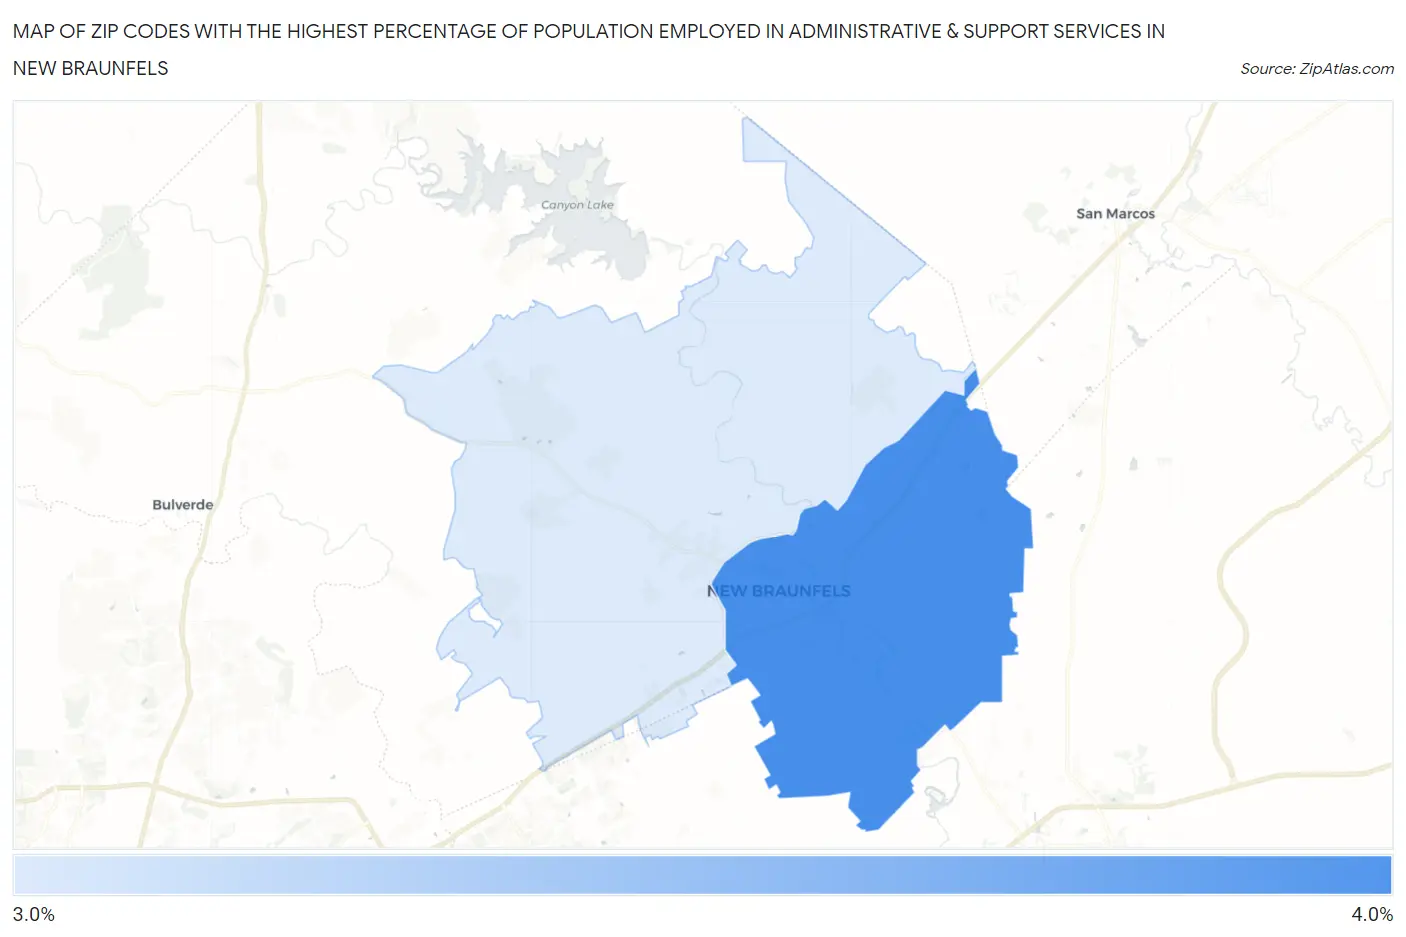
Map of Zip Codes with the Highest Percentage of Population Employed in Administrative & Support Services in New Braunfels
3.1%
3.9%
Zip Codes with the Highest Percentage of Population Employed in Administrative & Support Services in New Braunfels, TX
| Zip Code | % Employed | vs State | vs National | |
| 1. | 78130 | 3.9% | 4.4%(-0.526)#771 | 4.1%(-0.260)#11,162 |
| 2. | 78132 | 3.1% | 4.4%(-1.35)#1,012 | 4.1%(-1.08)#15,146 |
1
Common Questions
What are the Top Zip Codes with the Highest Percentage of Population Employed in Administrative & Support Services in New Braunfels, TX?
Top Zip Codes with the Highest Percentage of Population Employed in Administrative & Support Services in New Braunfels, TX are:
What zip code has the Highest Percentage of Population Employed in Administrative & Support Services in New Braunfels, TX?
78130 has the Highest Percentage of Population Employed in Administrative & Support Services in New Braunfels, TX with 3.9%.
What is the Percentage of Population Employed in Administrative & Support Services in New Braunfels, TX?
Percentage of Population Employed in Administrative & Support Services in New Braunfels is 3.5%.
What is the Percentage of Population Employed in Administrative & Support Services in Texas?
Percentage of Population Employed in Administrative & Support Services in Texas is 4.4%.
What is the Percentage of Population Employed in Administrative & Support Services in the United States?
Percentage of Population Employed in Administrative & Support Services in the United States is 4.1%.