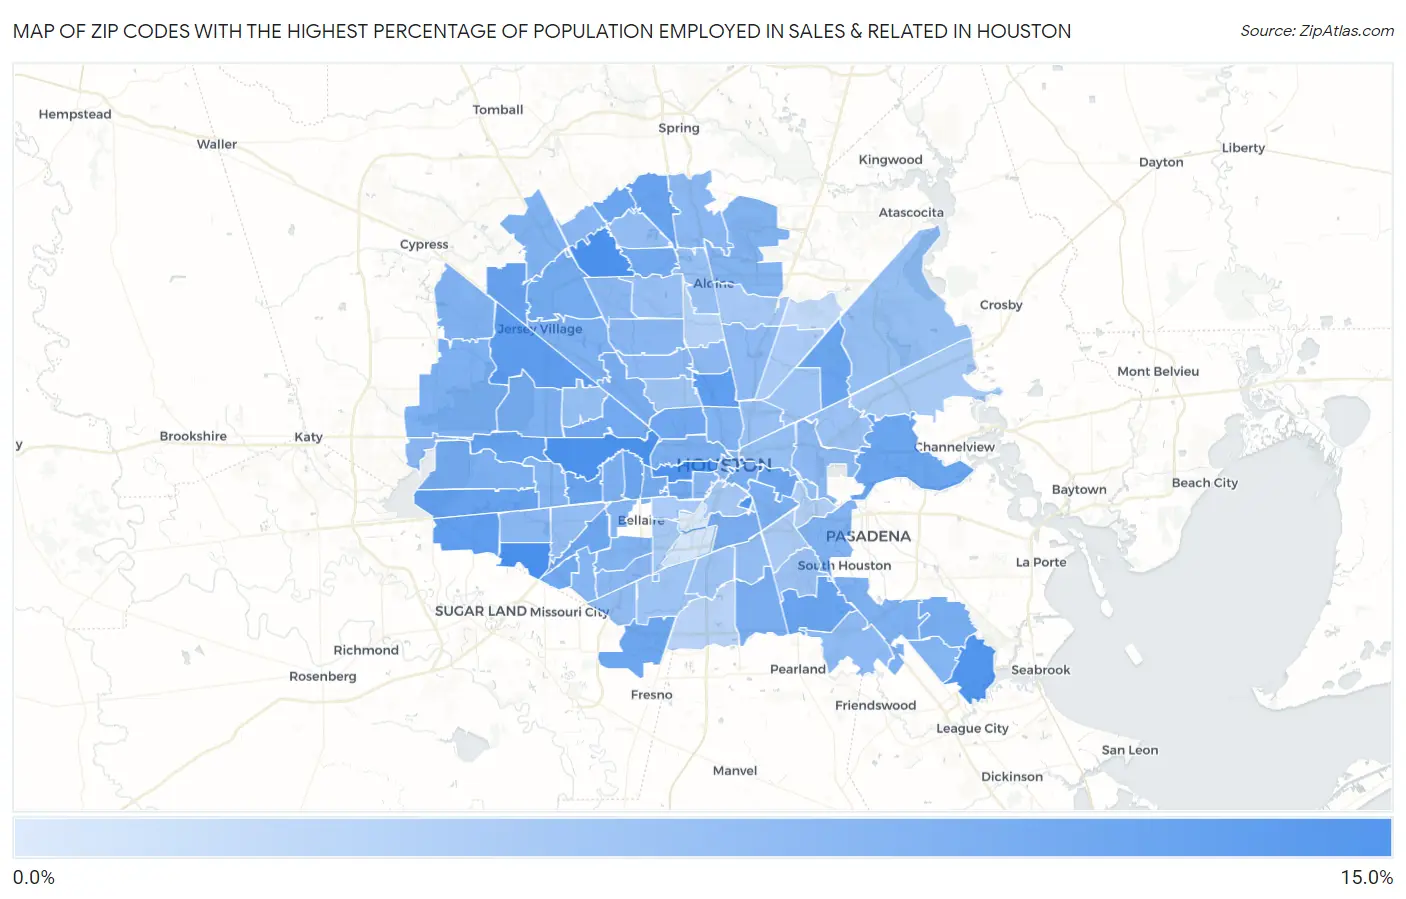
Zip Codes with the Highest Percentage of Population Employed in Sales & Related in Houston, TX
RELATED REPORTS & OPTIONS
Sales & Related
Houston
Compare Zip Codes
Map of Zip Codes with the Highest Percentage of Population Employed in Sales & Related in Houston
0.0%
15.0%
Zip Codes with the Highest Percentage of Population Employed in Sales & Related in Houston, TX
| Zip Code | % Employed | vs State | vs National | |
| 1. | 77010 | 14.0% | 10.2%(+3.79)#212 | 9.6%(+4.42)#3,467 |
| 2. | 77099 | 13.8% | 10.2%(+3.63)#224 | 9.6%(+4.25)#3,597 |
| 3. | 77024 | 13.7% | 10.2%(+3.51)#233 | 9.6%(+4.14)#3,711 |
| 4. | 77066 | 13.6% | 10.2%(+3.37)#246 | 9.6%(+4.00)#3,852 |
| 5. | 77019 | 13.5% | 10.2%(+3.32)#251 | 9.6%(+3.95)#3,904 |
| 6. | 77204 | 13.3% | 10.2%(+3.10)#266 | 9.6%(+3.73)#4,135 |
| 7. | 77058 | 13.2% | 10.2%(+2.96)#283 | 9.6%(+3.58)#4,301 |
| 8. | 77046 | 12.8% | 10.2%(+2.58)#321 | 9.6%(+3.21)#4,745 |
| 9. | 77041 | 12.3% | 10.2%(+2.08)#395 | 9.6%(+2.71)#5,468 |
| 10. | 77083 | 12.2% | 10.2%(+1.93)#417 | 9.6%(+2.56)#5,760 |
| 11. | 77022 | 12.1% | 10.2%(+1.92)#419 | 9.6%(+2.55)#5,775 |
| 12. | 77079 | 11.9% | 10.2%(+1.64)#449 | 9.6%(+2.27)#6,300 |
| 13. | 77090 | 11.7% | 10.2%(+1.50)#467 | 9.6%(+2.13)#6,559 |
| 14. | 77082 | 11.7% | 10.2%(+1.49)#469 | 9.6%(+2.12)#6,575 |
| 15. | 77065 | 11.6% | 10.2%(+1.41)#484 | 9.6%(+2.04)#6,737 |
| 16. | 77063 | 11.6% | 10.2%(+1.37)#490 | 9.6%(+2.00)#6,803 |
| 17. | 77075 | 11.4% | 10.2%(+1.22)#510 | 9.6%(+1.85)#7,147 |
| 18. | 77078 | 11.4% | 10.2%(+1.18)#518 | 9.6%(+1.81)#7,248 |
| 19. | 77015 | 11.4% | 10.2%(+1.14)#525 | 9.6%(+1.77)#7,318 |
| 20. | 77068 | 11.3% | 10.2%(+1.06)#536 | 9.6%(+1.69)#7,503 |
| 21. | 77056 | 11.2% | 10.2%(+1.02)#542 | 9.6%(+1.65)#7,594 |
| 22. | 77074 | 11.2% | 10.2%(+1.00)#546 | 9.6%(+1.63)#7,639 |
| 23. | 77011 | 11.2% | 10.2%(+0.928)#566 | 9.6%(+1.56)#7,813 |
| 24. | 77053 | 11.1% | 10.2%(+0.914)#568 | 9.6%(+1.54)#7,853 |
| 25. | 77098 | 11.0% | 10.2%(+0.819)#590 | 9.6%(+1.45)#8,102 |
| 26. | 77008 | 11.0% | 10.2%(+0.815)#591 | 9.6%(+1.44)#8,112 |
| 27. | 77067 | 10.8% | 10.2%(+0.605)#633 | 9.6%(+1.23)#8,638 |
| 28. | 77055 | 10.8% | 10.2%(+0.604)#634 | 9.6%(+1.23)#8,640 |
| 29. | 77031 | 10.8% | 10.2%(+0.552)#644 | 9.6%(+1.18)#8,787 |
| 30. | 77064 | 10.7% | 10.2%(+0.509)#654 | 9.6%(+1.14)#8,891 |
| 31. | 77027 | 10.5% | 10.2%(+0.287)#689 | 9.6%(+0.916)#9,498 |
| 32. | 77059 | 10.5% | 10.2%(+0.275)#693 | 9.6%(+0.905)#9,527 |
| 33. | 77003 | 10.4% | 10.2%(+0.182)#705 | 9.6%(+0.811)#9,793 |
| 34. | 77092 | 10.4% | 10.2%(+0.166)#708 | 9.6%(+0.795)#9,838 |
| 35. | 77021 | 10.3% | 10.2%(+0.069)#727 | 9.6%(+0.698)#10,135 |
| 36. | 77048 | 10.3% | 10.2%(+0.027)#736 | 9.6%(+0.656)#10,242 |
| 37. | 77057 | 10.2% | 10.2%(+0.017)#739 | 9.6%(+0.646)#10,277 |
| 38. | 77007 | 10.2% | 10.2%(-0.019)#746 | 9.6%(+0.610)#10,409 |
| 39. | 77077 | 10.1% | 10.2%(-0.140)#772 | 9.6%(+0.490)#10,756 |
| 40. | 77034 | 10.1% | 10.2%(-0.158)#775 | 9.6%(+0.471)#10,798 |
| 41. | 77040 | 10.1% | 10.2%(-0.161)#777 | 9.6%(+0.468)#10,808 |
| 42. | 77043 | 10.1% | 10.2%(-0.170)#780 | 9.6%(+0.459)#10,838 |
| 43. | 77084 | 10.0% | 10.2%(-0.200)#787 | 9.6%(+0.429)#10,930 |
| 44. | 77023 | 9.9% | 10.2%(-0.302)#809 | 9.6%(+0.327)#11,253 |
| 45. | 77009 | 9.9% | 10.2%(-0.312)#811 | 9.6%(+0.317)#11,280 |
| 46. | 77095 | 9.9% | 10.2%(-0.329)#816 | 9.6%(+0.300)#11,333 |
| 47. | 77017 | 9.9% | 10.2%(-0.369)#823 | 9.6%(+0.260)#11,462 |
| 48. | 77070 | 9.9% | 10.2%(-0.370)#824 | 9.6%(+0.259)#11,464 |
| 49. | 77096 | 9.7% | 10.2%(-0.481)#854 | 9.6%(+0.148)#11,886 |
| 50. | 77062 | 9.7% | 10.2%(-0.499)#856 | 9.6%(+0.130)#11,951 |
| 51. | 77042 | 9.7% | 10.2%(-0.553)#876 | 9.6%(+0.077)#12,139 |
| 52. | 77032 | 9.6% | 10.2%(-0.609)#896 | 9.6%(+0.020)#12,346 |
| 53. | 77081 | 9.5% | 10.2%(-0.689)#912 | 9.6%(-0.060)#12,626 |
| 54. | 77006 | 9.4% | 10.2%(-0.863)#938 | 9.6%(-0.234)#13,204 |
| 55. | 77071 | 9.4% | 10.2%(-0.866)#939 | 9.6%(-0.237)#13,211 |
| 56. | 77069 | 9.3% | 10.2%(-0.972)#962 | 9.6%(-0.342)#13,593 |
| 57. | 77072 | 9.2% | 10.2%(-1.01)#969 | 9.6%(-0.377)#13,716 |
| 58. | 77073 | 9.2% | 10.2%(-1.03)#976 | 9.6%(-0.401)#13,811 |
| 59. | 77035 | 9.1% | 10.2%(-1.08)#985 | 9.6%(-0.446)#13,978 |
| 60. | 77086 | 9.1% | 10.2%(-1.09)#986 | 9.6%(-0.463)#14,023 |
| 61. | 77088 | 9.1% | 10.2%(-1.09)#987 | 9.6%(-0.464)#14,033 |
| 62. | 77094 | 9.1% | 10.2%(-1.11)#992 | 9.6%(-0.480)#14,100 |
| 63. | 77091 | 9.1% | 10.2%(-1.15)#999 | 9.6%(-0.517)#14,229 |
| 64. | 77076 | 9.1% | 10.2%(-1.17)#1,002 | 9.6%(-0.543)#14,327 |
| 65. | 77029 | 9.0% | 10.2%(-1.22)#1,010 | 9.6%(-0.592)#14,494 |
| 66. | 77002 | 9.0% | 10.2%(-1.26)#1,019 | 9.6%(-0.630)#14,641 |
| 67. | 77093 | 8.9% | 10.2%(-1.29)#1,024 | 9.6%(-0.663)#14,770 |
| 68. | 77089 | 8.9% | 10.2%(-1.36)#1,035 | 9.6%(-0.727)#15,001 |
| 69. | 77085 | 8.7% | 10.2%(-1.52)#1,063 | 9.6%(-0.894)#15,631 |
| 70. | 77033 | 8.6% | 10.2%(-1.64)#1,083 | 9.6%(-1.01)#16,031 |
| 71. | 77036 | 8.5% | 10.2%(-1.71)#1,103 | 9.6%(-1.08)#16,305 |
| 72. | 77014 | 8.5% | 10.2%(-1.74)#1,110 | 9.6%(-1.11)#16,403 |
| 73. | 77080 | 8.4% | 10.2%(-1.82)#1,122 | 9.6%(-1.19)#16,682 |
| 74. | 77020 | 8.4% | 10.2%(-1.87)#1,132 | 9.6%(-1.24)#16,869 |
| 75. | 77044 | 8.3% | 10.2%(-1.93)#1,145 | 9.6%(-1.30)#17,092 |
| 76. | 77038 | 8.3% | 10.2%(-1.96)#1,153 | 9.6%(-1.33)#17,188 |
| 77. | 77026 | 8.3% | 10.2%(-1.97)#1,157 | 9.6%(-1.34)#17,217 |
| 78. | 77060 | 8.2% | 10.2%(-2.06)#1,178 | 9.6%(-1.43)#17,543 |
| 79. | 77013 | 8.1% | 10.2%(-2.12)#1,186 | 9.6%(-1.49)#17,702 |
| 80. | 77061 | 8.1% | 10.2%(-2.14)#1,190 | 9.6%(-1.51)#17,780 |
| 81. | 77018 | 7.7% | 10.2%(-2.49)#1,230 | 9.6%(-1.87)#18,891 |
| 82. | 77051 | 7.7% | 10.2%(-2.51)#1,234 | 9.6%(-1.88)#18,944 |
| 83. | 77028 | 7.7% | 10.2%(-2.53)#1,237 | 9.6%(-1.90)#18,998 |
| 84. | 77045 | 7.7% | 10.2%(-2.54)#1,240 | 9.6%(-1.91)#19,050 |
| 85. | 77039 | 7.2% | 10.2%(-3.00)#1,312 | 9.6%(-2.37)#20,572 |
| 86. | 77004 | 7.2% | 10.2%(-3.04)#1,320 | 9.6%(-2.42)#20,699 |
| 87. | 77049 | 7.1% | 10.2%(-3.08)#1,324 | 9.6%(-2.45)#20,783 |
| 88. | 77025 | 7.1% | 10.2%(-3.14)#1,329 | 9.6%(-2.51)#20,945 |
| 89. | 77005 | 6.9% | 10.2%(-3.28)#1,345 | 9.6%(-2.65)#21,343 |
| 90. | 77087 | 6.9% | 10.2%(-3.32)#1,349 | 9.6%(-2.70)#21,485 |
| 91. | 77016 | 6.8% | 10.2%(-3.38)#1,353 | 9.6%(-2.75)#21,616 |
| 92. | 77012 | 6.6% | 10.2%(-3.66)#1,389 | 9.6%(-3.03)#22,271 |
| 93. | 77037 | 6.2% | 10.2%(-4.00)#1,425 | 9.6%(-3.37)#23,148 |
| 94. | 77047 | 6.0% | 10.2%(-4.18)#1,439 | 9.6%(-3.55)#23,563 |
| 95. | 77050 | 5.3% | 10.2%(-4.91)#1,507 | 9.6%(-4.28)#25,014 |
| 96. | 77054 | 4.1% | 10.2%(-6.08)#1,598 | 9.6%(-5.46)#26,851 |
| 97. | 77030 | 3.5% | 10.2%(-6.76)#1,637 | 9.6%(-6.13)#27,666 |
1
Common Questions
What are the Top 10 Zip Codes with the Highest Percentage of Population Employed in Sales & Related in Houston, TX?
Top 10 Zip Codes with the Highest Percentage of Population Employed in Sales & Related in Houston, TX are:
What zip code has the Highest Percentage of Population Employed in Sales & Related in Houston, TX?
77010 has the Highest Percentage of Population Employed in Sales & Related in Houston, TX with 14.0%.
What is the Percentage of Population Employed in Sales & Related in Houston, TX?
Percentage of Population Employed in Sales & Related in Houston is 9.8%.
What is the Percentage of Population Employed in Sales & Related in Texas?
Percentage of Population Employed in Sales & Related in Texas is 10.2%.
What is the Percentage of Population Employed in Sales & Related in the United States?
Percentage of Population Employed in Sales & Related in the United States is 9.6%.