Zip Codes with the Highest Percentage of Population Employed in Administrative & Support Services in Rowlett, TX
RELATED REPORTS & OPTIONS
Administrative & Support Services
Rowlett
Compare Zip Codes
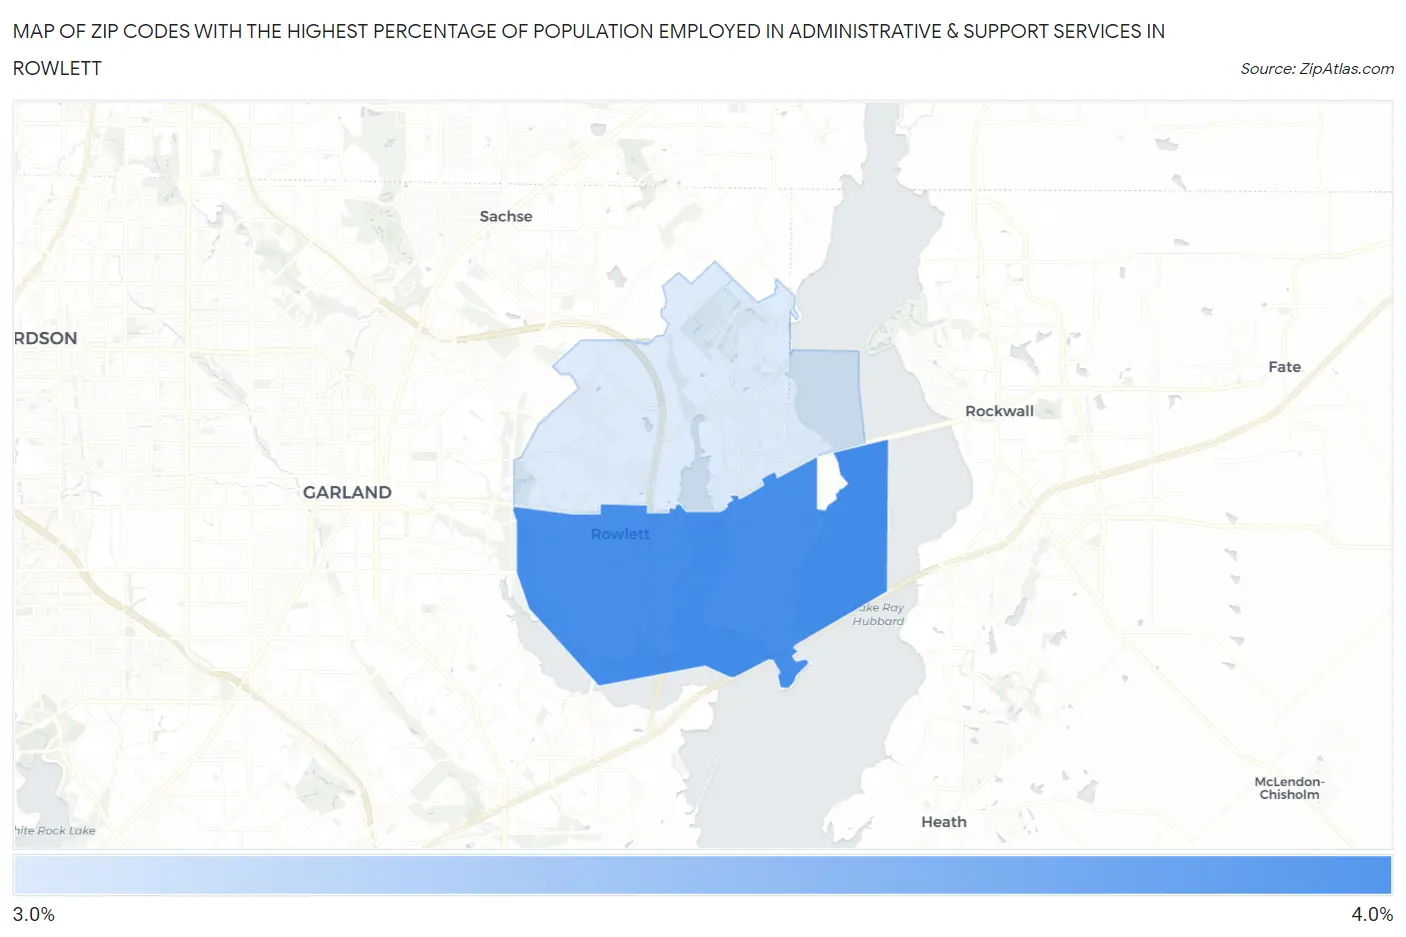
Map of Zip Codes with the Highest Percentage of Population Employed in Administrative & Support Services in Rowlett
3.2%
3.6%
Zip Codes with the Highest Percentage of Population Employed in Administrative & Support Services in Rowlett, TX
| Zip Code | % Employed | vs State | vs National | |
| 1. | 75088 | 3.6% | 4.4%(-0.864)#863 | 4.1%(-0.597)#12,701 |
| 2. | 75089 | 3.2% | 4.4%(-1.18)#956 | 4.1%(-0.911)#14,260 |
1
Common Questions
What are the Top Zip Codes with the Highest Percentage of Population Employed in Administrative & Support Services in Rowlett, TX?
Top Zip Codes with the Highest Percentage of Population Employed in Administrative & Support Services in Rowlett, TX are:
What zip code has the Highest Percentage of Population Employed in Administrative & Support Services in Rowlett, TX?
75088 has the Highest Percentage of Population Employed in Administrative & Support Services in Rowlett, TX with 3.6%.
What is the Percentage of Population Employed in Administrative & Support Services in Rowlett, TX?
Percentage of Population Employed in Administrative & Support Services in Rowlett is 3.3%.
What is the Percentage of Population Employed in Administrative & Support Services in Texas?
Percentage of Population Employed in Administrative & Support Services in Texas is 4.4%.
What is the Percentage of Population Employed in Administrative & Support Services in the United States?
Percentage of Population Employed in Administrative & Support Services in the United States is 4.1%.