Zip Codes with the Highest Percentage of Population Employed in Administrative & Support Services in Lufkin, TX
RELATED REPORTS & OPTIONS
Administrative & Support Services
Lufkin
Compare Zip Codes
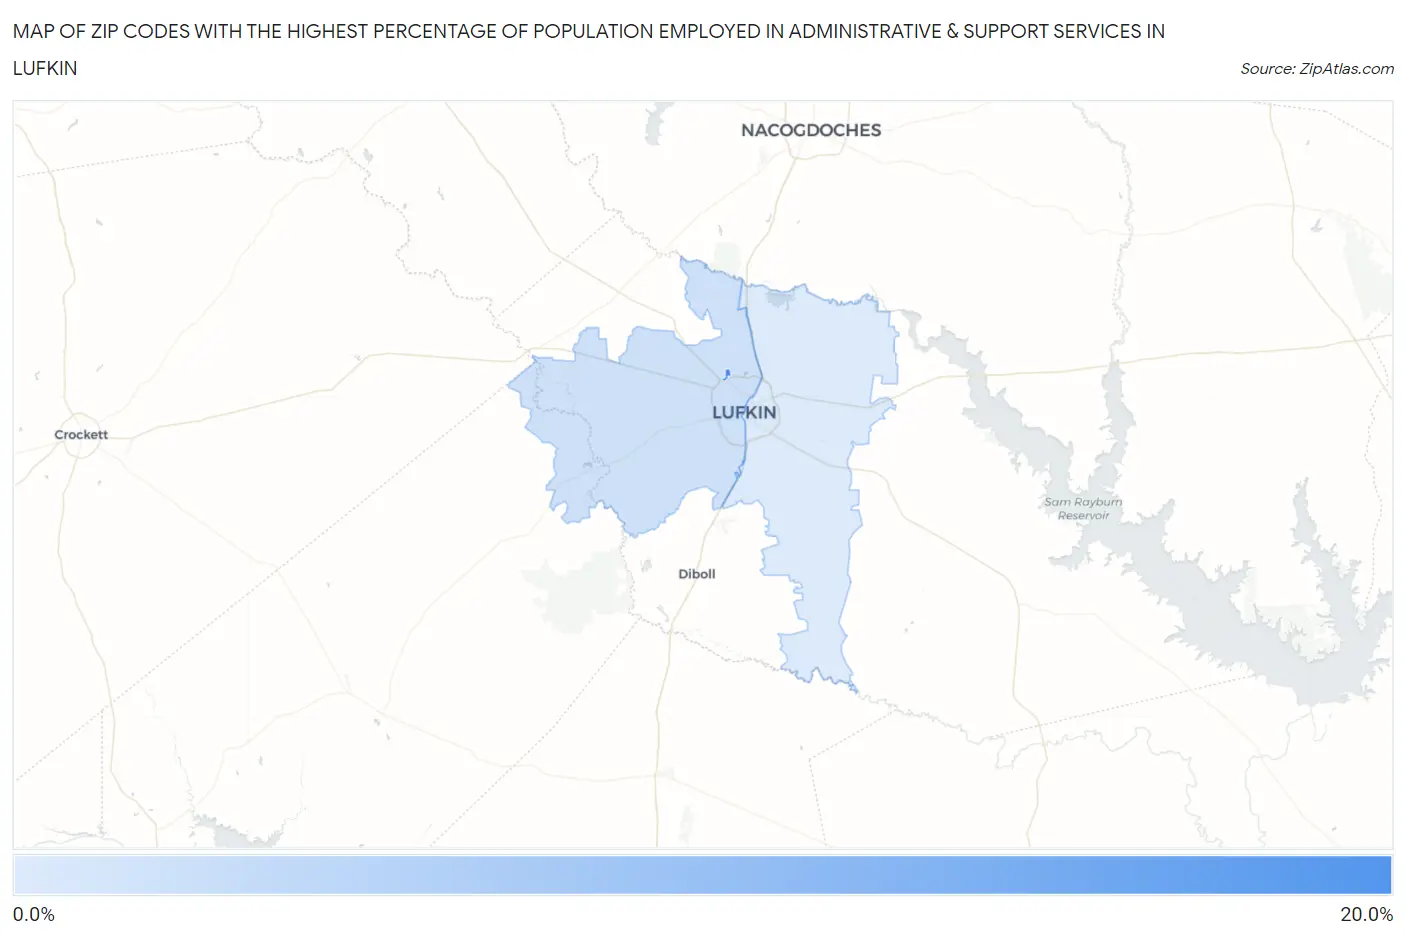
Map of Zip Codes with the Highest Percentage of Population Employed in Administrative & Support Services in Lufkin
4.3%
19.1%
Zip Codes with the Highest Percentage of Population Employed in Administrative & Support Services in Lufkin, TX
| Zip Code | % Employed | vs State | vs National | |
| 1. | 75903 | 19.1% | 4.4%(+14.7)#15 | 4.1%(+15.0)#318 |
| 2. | 75904 | 5.6% | 4.4%(+1.20)#408 | 4.1%(+1.47)#5,551 |
| 3. | 75901 | 4.3% | 4.4%(-0.134)#668 | 4.1%(+0.132)#9,515 |
1
Common Questions
What are the Top Zip Codes with the Highest Percentage of Population Employed in Administrative & Support Services in Lufkin, TX?
Top Zip Codes with the Highest Percentage of Population Employed in Administrative & Support Services in Lufkin, TX are:
What zip code has the Highest Percentage of Population Employed in Administrative & Support Services in Lufkin, TX?
75903 has the Highest Percentage of Population Employed in Administrative & Support Services in Lufkin, TX with 19.1%.
What is the Percentage of Population Employed in Administrative & Support Services in Lufkin, TX?
Percentage of Population Employed in Administrative & Support Services in Lufkin is 4.5%.
What is the Percentage of Population Employed in Administrative & Support Services in Texas?
Percentage of Population Employed in Administrative & Support Services in Texas is 4.4%.
What is the Percentage of Population Employed in Administrative & Support Services in the United States?
Percentage of Population Employed in Administrative & Support Services in the United States is 4.1%.