Zip Codes with the Highest Percentage of Population Employed in Administrative & Support Services in Corsicana, TX
RELATED REPORTS & OPTIONS
Administrative & Support Services
Corsicana
Compare Zip Codes
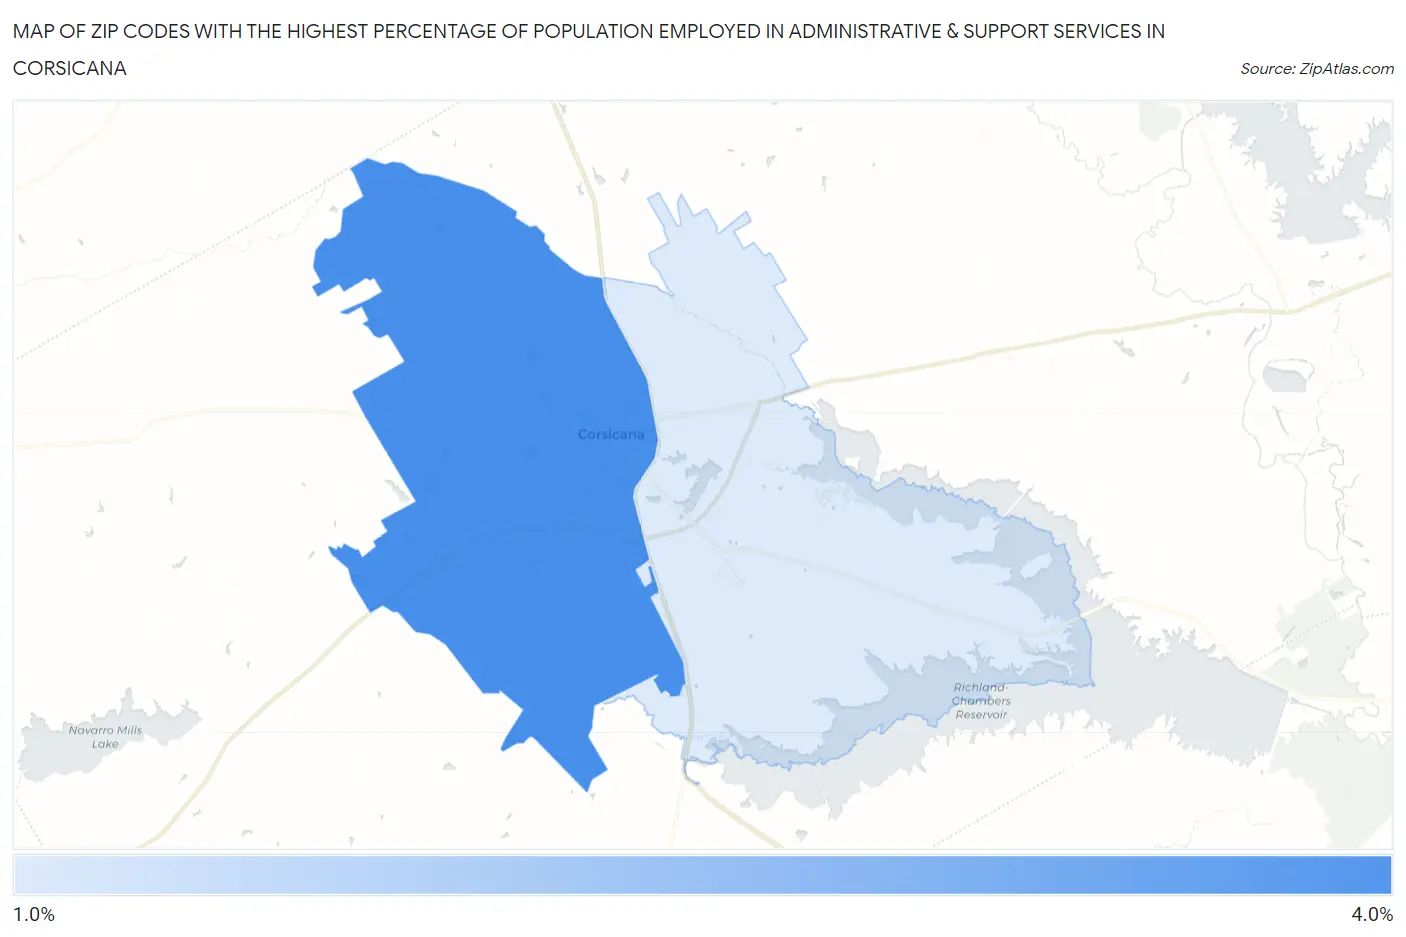
Map of Zip Codes with the Highest Percentage of Population Employed in Administrative & Support Services in Corsicana
0.0%
4.0%
Zip Codes with the Highest Percentage of Population Employed in Administrative & Support Services in Corsicana, TX
| Zip Code | % Employed | vs State | vs National | |
| 1. | 75110 | 3.4% | 4.4%(-0.998)#895 | 4.1%(-0.732)#13,348 |
| 2. | 75109 | 1.6% | 4.4%(-2.85)#1,373 | 4.1%(-2.58)#22,462 |
1
Common Questions
What are the Top Zip Codes with the Highest Percentage of Population Employed in Administrative & Support Services in Corsicana, TX?
Top Zip Codes with the Highest Percentage of Population Employed in Administrative & Support Services in Corsicana, TX are:
What zip code has the Highest Percentage of Population Employed in Administrative & Support Services in Corsicana, TX?
75110 has the Highest Percentage of Population Employed in Administrative & Support Services in Corsicana, TX with 3.4%.
What is the Percentage of Population Employed in Administrative & Support Services in Corsicana, TX?
Percentage of Population Employed in Administrative & Support Services in Corsicana is 3.6%.
What is the Percentage of Population Employed in Administrative & Support Services in Texas?
Percentage of Population Employed in Administrative & Support Services in Texas is 4.4%.
What is the Percentage of Population Employed in Administrative & Support Services in the United States?
Percentage of Population Employed in Administrative & Support Services in the United States is 4.1%.