Zip Codes with the Highest Percentage of Population Employed in Installation, Maintenance & Repair in Allen, TX
RELATED REPORTS & OPTIONS
Installation, Maintenance & Repair
Allen
Compare Zip Codes
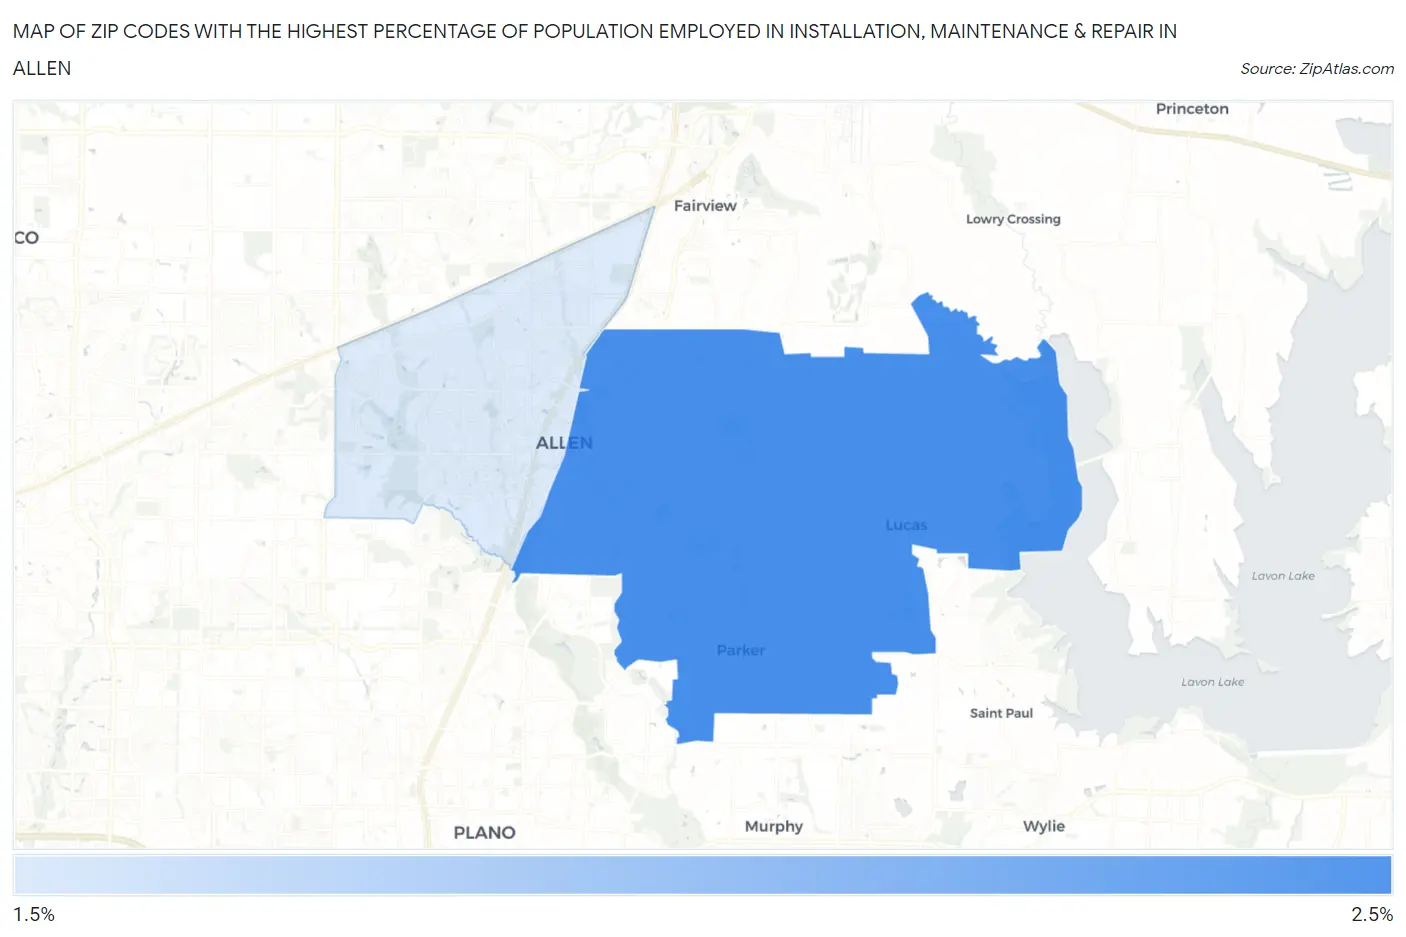
Map of Zip Codes with the Highest Percentage of Population Employed in Installation, Maintenance & Repair in Allen
1.6%
2.1%
Zip Codes with the Highest Percentage of Population Employed in Installation, Maintenance & Repair in Allen, TX
| Zip Code | % Employed | vs State | vs National | |
| 1. | 75002 | 2.1% | 3.4%(-1.31)#1,319 | 3.1%(-0.971)#21,554 |
| 2. | 75013 | 1.6% | 3.4%(-1.81)#1,436 | 3.1%(-1.48)#23,802 |
1
Common Questions
What are the Top Zip Codes with the Highest Percentage of Population Employed in Installation, Maintenance & Repair in Allen, TX?
Top Zip Codes with the Highest Percentage of Population Employed in Installation, Maintenance & Repair in Allen, TX are:
What zip code has the Highest Percentage of Population Employed in Installation, Maintenance & Repair in Allen, TX?
75002 has the Highest Percentage of Population Employed in Installation, Maintenance & Repair in Allen, TX with 2.1%.
What is the Percentage of Population Employed in Installation, Maintenance & Repair in Allen, TX?
Percentage of Population Employed in Installation, Maintenance & Repair in Allen is 1.9%.
What is the Percentage of Population Employed in Installation, Maintenance & Repair in Texas?
Percentage of Population Employed in Installation, Maintenance & Repair in Texas is 3.4%.
What is the Percentage of Population Employed in Installation, Maintenance & Repair in the United States?
Percentage of Population Employed in Installation, Maintenance & Repair in the United States is 3.1%.