Zip Codes with the Highest Percentage of Population Employed in Architecture & Engineering in Johnson City, TN
RELATED REPORTS & OPTIONS
Architecture & Engineering
Johnson City
Compare Zip Codes
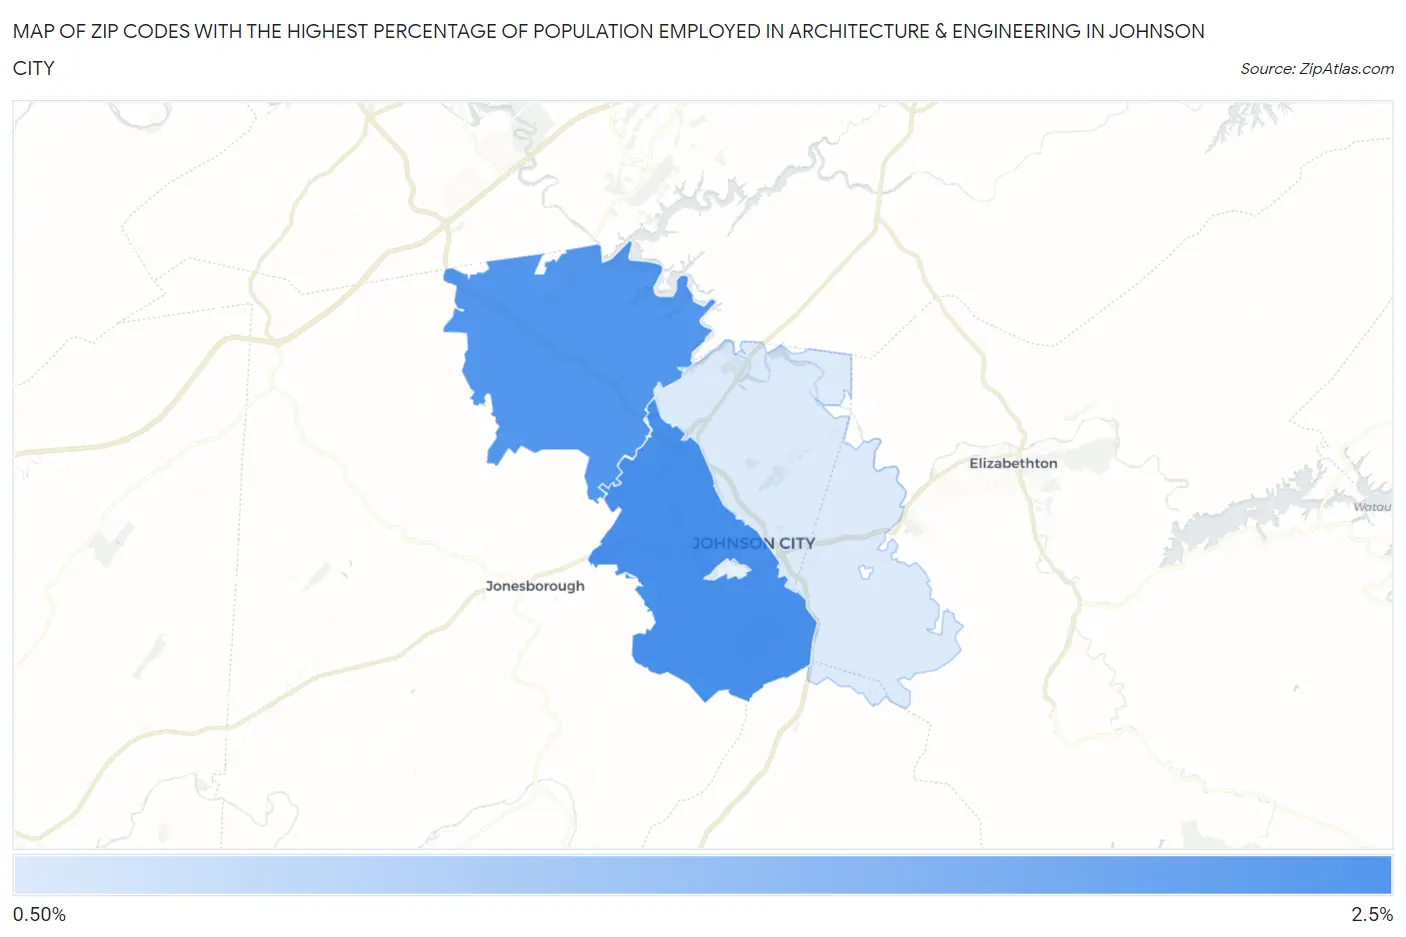
Map of Zip Codes with the Highest Percentage of Population Employed in Architecture & Engineering in Johnson City
1.1%
2.2%
Zip Codes with the Highest Percentage of Population Employed in Architecture & Engineering in Johnson City, TN
| Zip Code | % Employed | vs State | vs National | |
| 1. | 37604 | 2.2% | 1.7%(+0.555)#130 | 2.1%(+0.074)#8,351 |
| 2. | 37615 | 2.1% | 1.7%(+0.473)#143 | 2.1%(-0.009)#8,805 |
| 3. | 37601 | 1.1% | 1.7%(-0.555)#308 | 2.1%(-1.04)#15,747 |
1
Common Questions
What are the Top 3 Zip Codes with the Highest Percentage of Population Employed in Architecture & Engineering in Johnson City, TN?
Top 3 Zip Codes with the Highest Percentage of Population Employed in Architecture & Engineering in Johnson City, TN are:
What zip code has the Highest Percentage of Population Employed in Architecture & Engineering in Johnson City, TN?
37604 has the Highest Percentage of Population Employed in Architecture & Engineering in Johnson City, TN with 2.2%.
What is the Percentage of Population Employed in Architecture & Engineering in Johnson City, TN?
Percentage of Population Employed in Architecture & Engineering in Johnson City is 1.9%.
What is the Percentage of Population Employed in Architecture & Engineering in Tennessee?
Percentage of Population Employed in Architecture & Engineering in Tennessee is 1.7%.
What is the Percentage of Population Employed in Architecture & Engineering in the United States?
Percentage of Population Employed in Architecture & Engineering in the United States is 2.1%.