Zip Codes with the Highest Percentage of Population Employed in Architecture & Engineering in Germantown, TN
RELATED REPORTS & OPTIONS
Architecture & Engineering
Germantown
Compare Zip Codes
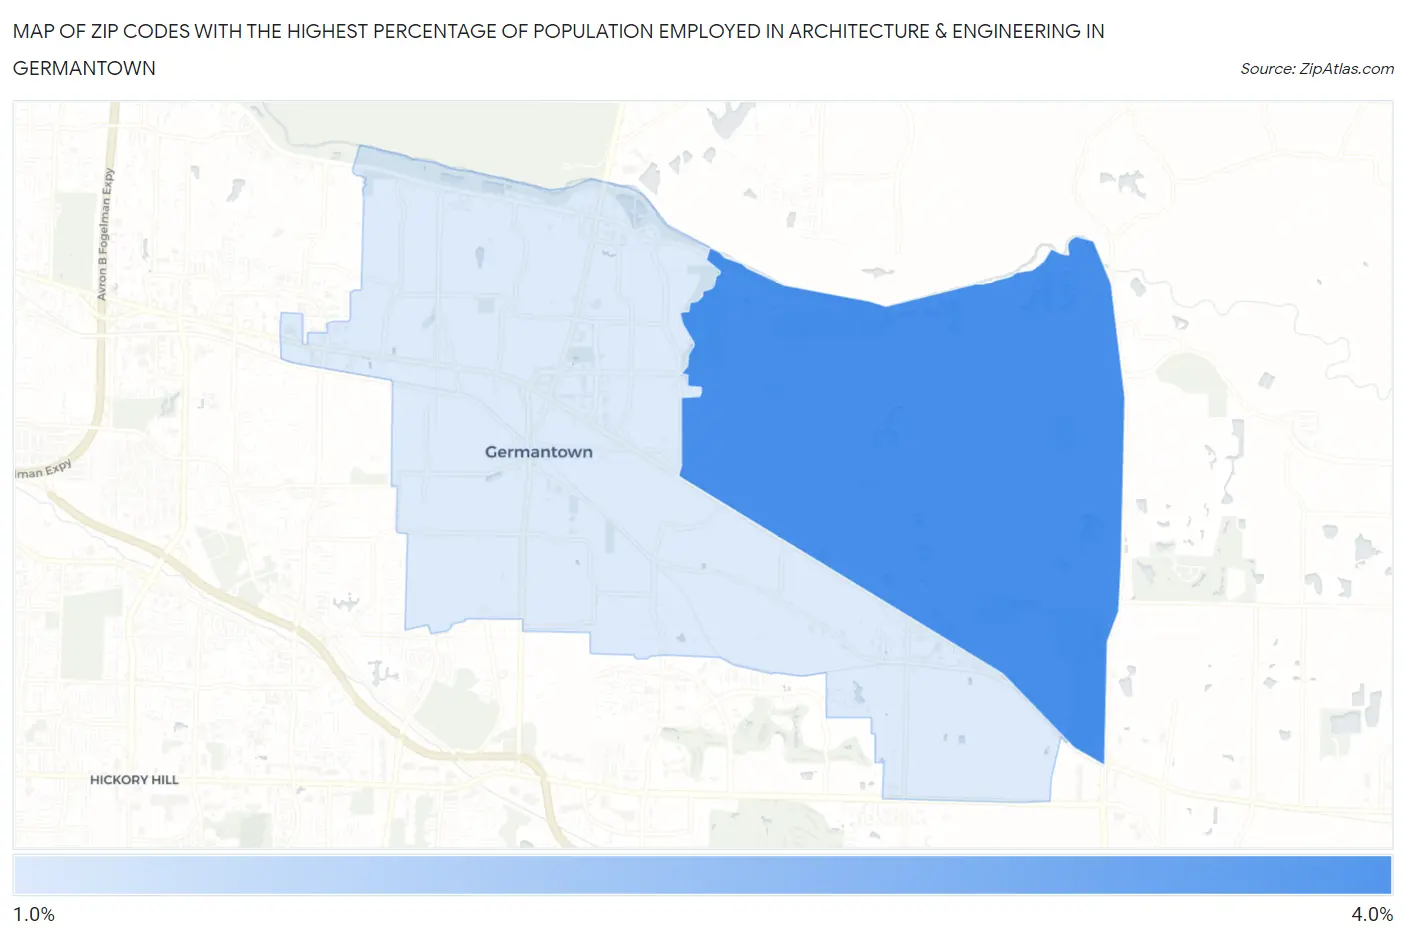
Map of Zip Codes with the Highest Percentage of Population Employed in Architecture & Engineering in Germantown
1.9%
3.3%
Zip Codes with the Highest Percentage of Population Employed in Architecture & Engineering in Germantown, TN
| Zip Code | % Employed | vs State | vs National | |
| 1. | 38139 | 3.3% | 1.7%(+1.60)#63 | 2.1%(+1.12)#4,282 |
| 2. | 38138 | 1.9% | 1.7%(+0.194)#189 | 2.1%(-0.288)#10,471 |
1
Common Questions
What are the Top Zip Codes with the Highest Percentage of Population Employed in Architecture & Engineering in Germantown, TN?
Top Zip Codes with the Highest Percentage of Population Employed in Architecture & Engineering in Germantown, TN are:
What zip code has the Highest Percentage of Population Employed in Architecture & Engineering in Germantown, TN?
38139 has the Highest Percentage of Population Employed in Architecture & Engineering in Germantown, TN with 3.3%.
What is the Percentage of Population Employed in Architecture & Engineering in Germantown, TN?
Percentage of Population Employed in Architecture & Engineering in Germantown is 2.4%.
What is the Percentage of Population Employed in Architecture & Engineering in Tennessee?
Percentage of Population Employed in Architecture & Engineering in Tennessee is 1.7%.
What is the Percentage of Population Employed in Architecture & Engineering in the United States?
Percentage of Population Employed in Architecture & Engineering in the United States is 2.1%.