Zip Codes with the Highest Percentage of Population Employed in Architecture & Engineering in Lebanon, TN
RELATED REPORTS & OPTIONS
Architecture & Engineering
Lebanon
Compare Zip Codes
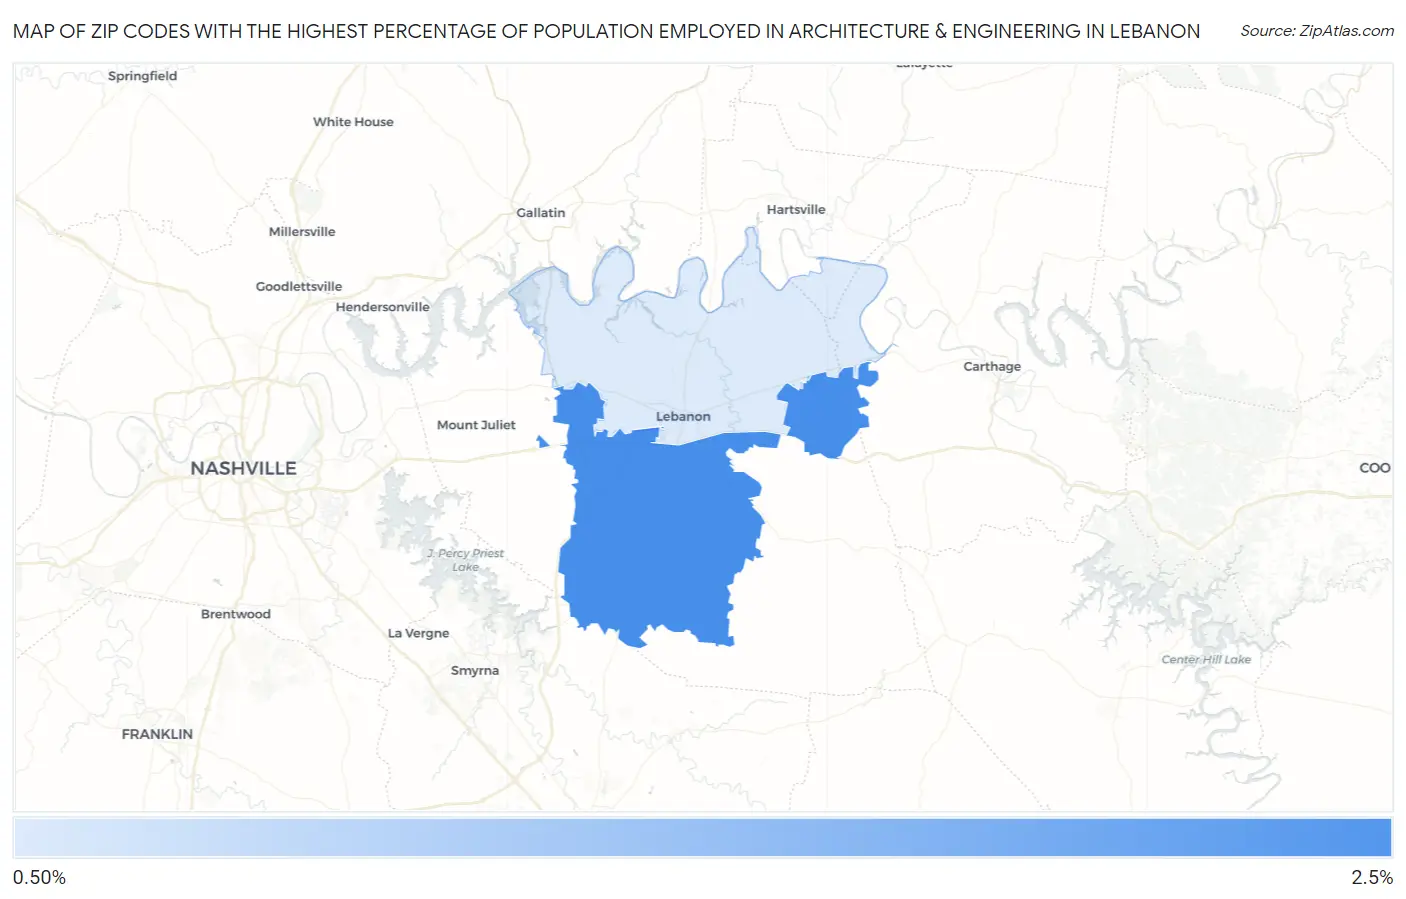
Map of Zip Codes with the Highest Percentage of Population Employed in Architecture & Engineering in Lebanon
1.4%
2.2%
Zip Codes with the Highest Percentage of Population Employed in Architecture & Engineering in Lebanon, TN
| Zip Code | % Employed | vs State | vs National | |
| 1. | 37090 | 2.2% | 1.7%(+0.518)#137 | 2.1%(+0.036)#8,564 |
| 2. | 37087 | 1.4% | 1.7%(-0.267)#261 | 2.1%(-0.748)#13,578 |
1
Common Questions
What are the Top Zip Codes with the Highest Percentage of Population Employed in Architecture & Engineering in Lebanon, TN?
Top Zip Codes with the Highest Percentage of Population Employed in Architecture & Engineering in Lebanon, TN are:
What zip code has the Highest Percentage of Population Employed in Architecture & Engineering in Lebanon, TN?
37090 has the Highest Percentage of Population Employed in Architecture & Engineering in Lebanon, TN with 2.2%.
What is the Percentage of Population Employed in Architecture & Engineering in Lebanon, TN?
Percentage of Population Employed in Architecture & Engineering in Lebanon is 1.8%.
What is the Percentage of Population Employed in Architecture & Engineering in Tennessee?
Percentage of Population Employed in Architecture & Engineering in Tennessee is 1.7%.
What is the Percentage of Population Employed in Architecture & Engineering in the United States?
Percentage of Population Employed in Architecture & Engineering in the United States is 2.1%.