Zip Codes with the Highest Percentage of Population Employed in Office & Administration in Johnson City, TN
RELATED REPORTS & OPTIONS
Office & Administration
Johnson City
Compare Zip Codes
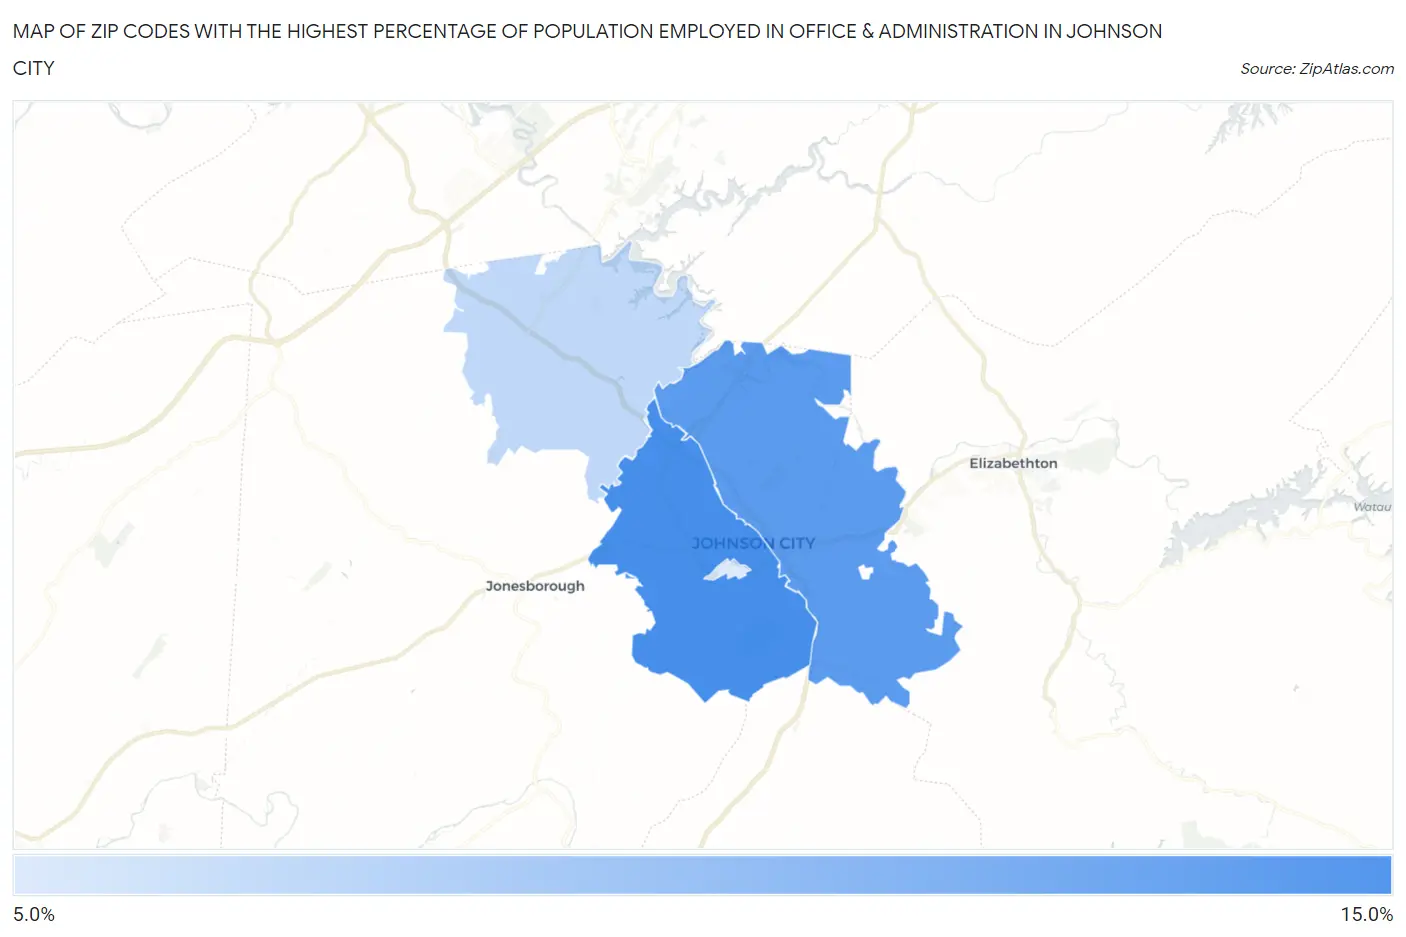
Map of Zip Codes with the Highest Percentage of Population Employed in Office & Administration in Johnson City
8.0%
13.4%
Zip Codes with the Highest Percentage of Population Employed in Office & Administration in Johnson City, TN
| Zip Code | % Employed | vs State | vs National | |
| 1. | 37604 | 13.4% | 11.3%(+2.08)#132 | 10.9%(+2.54)#7,160 |
| 2. | 37601 | 12.6% | 11.3%(+1.32)#165 | 10.9%(+1.78)#8,954 |
| 3. | 37615 | 9.1% | 11.3%(-2.24)#402 | 10.9%(-1.78)#20,031 |
| 4. | 37614 | 8.0% | 11.3%(-3.27)#454 | 10.9%(-2.81)#22,925 |
1
Common Questions
What are the Top 3 Zip Codes with the Highest Percentage of Population Employed in Office & Administration in Johnson City, TN?
Top 3 Zip Codes with the Highest Percentage of Population Employed in Office & Administration in Johnson City, TN are:
What zip code has the Highest Percentage of Population Employed in Office & Administration in Johnson City, TN?
37604 has the Highest Percentage of Population Employed in Office & Administration in Johnson City, TN with 13.4%.
What is the Percentage of Population Employed in Office & Administration in Johnson City, TN?
Percentage of Population Employed in Office & Administration in Johnson City is 12.2%.
What is the Percentage of Population Employed in Office & Administration in Tennessee?
Percentage of Population Employed in Office & Administration in Tennessee is 11.3%.
What is the Percentage of Population Employed in Office & Administration in the United States?
Percentage of Population Employed in Office & Administration in the United States is 10.9%.