Zip Codes with the Highest Percentage of Population with a Degree in Visual and Performing Arts in Johnson City, TN
RELATED REPORTS & OPTIONS
Visual and Performing Arts
Johnson City
Compare Zip Codes
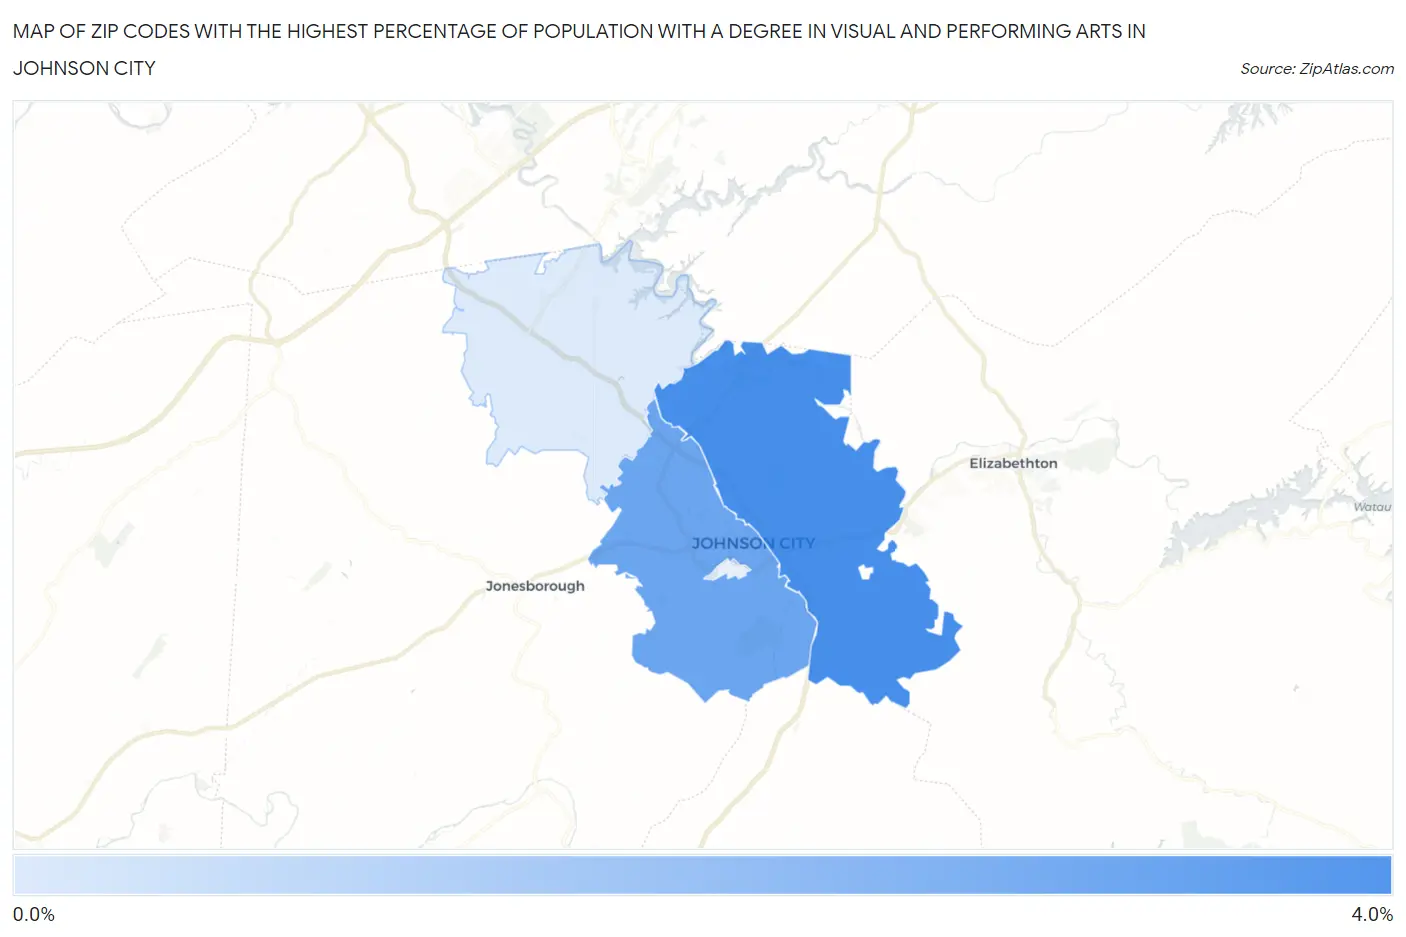
Map of Zip Codes with the Highest Percentage of Population with a Degree in Visual and Performing Arts in Johnson City
0.92%
3.2%
Zip Codes with the Highest Percentage of Population with a Degree in Visual and Performing Arts in Johnson City, TN
| Zip Code | % Graduates | vs State | vs National | |
| 1. | 37601 | 3.2% | 4.1%(-0.842)#223 | 4.3%(-1.03)#11,900 |
| 2. | 37604 | 2.7% | 4.1%(-1.40)#250 | 4.3%(-1.59)#14,052 |
| 3. | 37615 | 0.92% | 4.1%(-3.14)#369 | 4.3%(-3.33)#19,875 |
1
Common Questions
What are the Top 3 Zip Codes with the Highest Percentage of Population with a Degree in Visual and Performing Arts in Johnson City, TN?
Top 3 Zip Codes with the Highest Percentage of Population with a Degree in Visual and Performing Arts in Johnson City, TN are:
What zip code has the Highest Percentage of Population with a Degree in Visual and Performing Arts in Johnson City, TN?
37601 has the Highest Percentage of Population with a Degree in Visual and Performing Arts in Johnson City, TN with 3.2%.
What is the Percentage of Population with a Degree in Visual and Performing Arts in Johnson City, TN?
Percentage of Population with a Degree in Visual and Performing Arts in Johnson City is 2.2%.
What is the Percentage of Population with a Degree in Visual and Performing Arts in Tennessee?
Percentage of Population with a Degree in Visual and Performing Arts in Tennessee is 4.1%.
What is the Percentage of Population with a Degree in Visual and Performing Arts in the United States?
Percentage of Population with a Degree in Visual and Performing Arts in the United States is 4.3%.