Zip Codes with the Highest Percentage of Population Employed in Health Diagnosing & Treating in Johnson City, TN
RELATED REPORTS & OPTIONS
Health Diagnosing & Treating
Johnson City
Compare Zip Codes
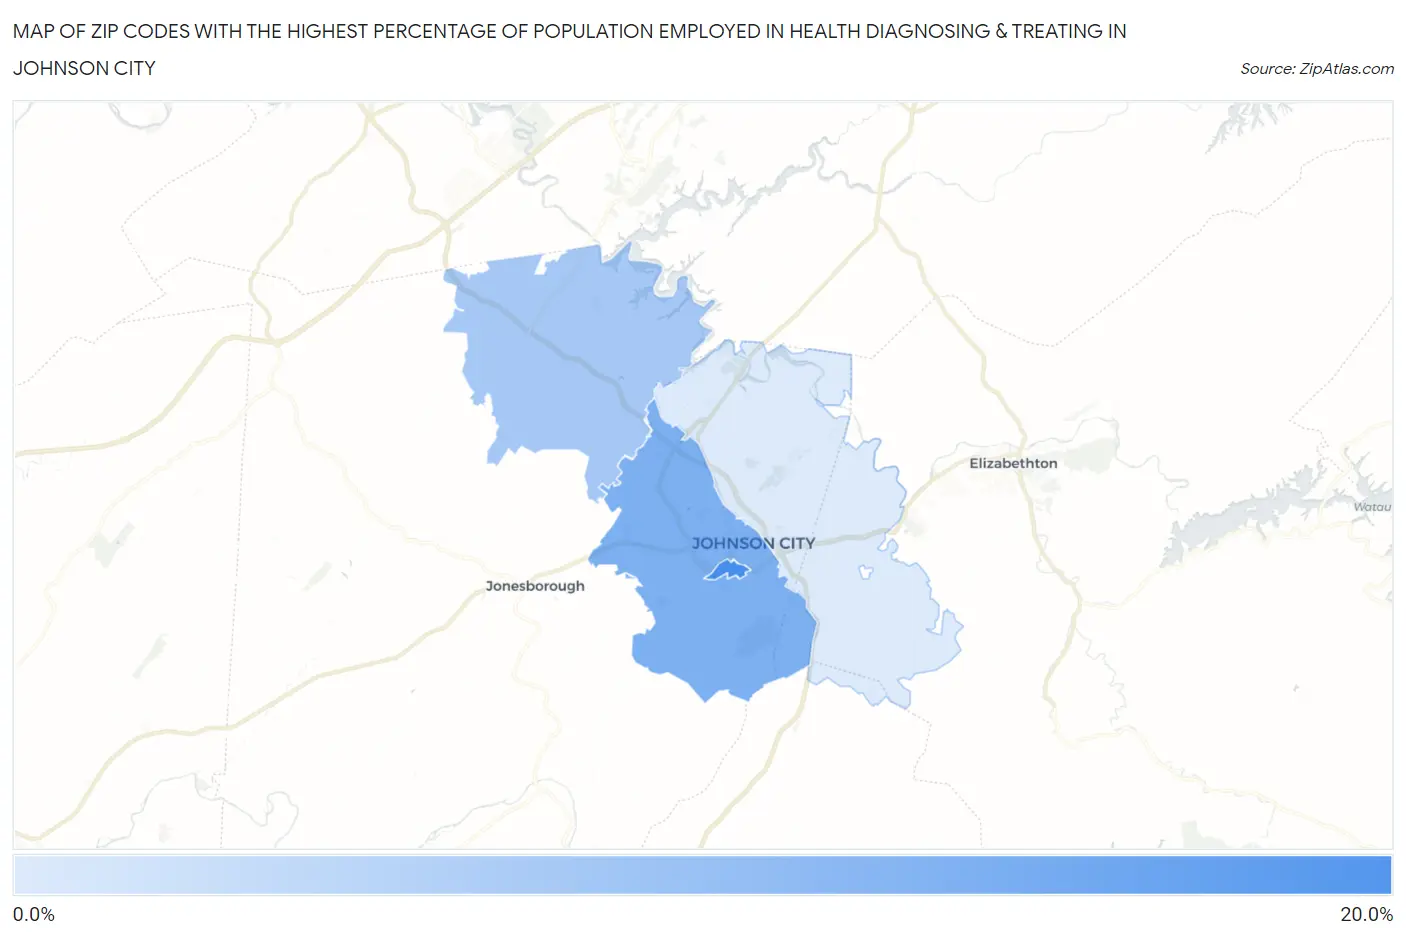
Map of Zip Codes with the Highest Percentage of Population Employed in Health Diagnosing & Treating in Johnson City
9.1%
17.2%
Zip Codes with the Highest Percentage of Population Employed in Health Diagnosing & Treating in Johnson City, TN
| Zip Code | % Employed | vs State | vs National | |
| 1. | 37614 | 17.2% | 6.9%(+10.3)#8 | 6.2%(+11.0)#794 |
| 2. | 37604 | 14.2% | 6.9%(+7.39)#20 | 6.2%(+8.00)#1,342 |
| 3. | 37615 | 12.1% | 6.9%(+5.25)#43 | 6.2%(+5.86)#2,161 |
| 4. | 37601 | 9.1% | 6.9%(+2.28)#121 | 6.2%(+2.90)#5,111 |
1
Common Questions
What are the Top 3 Zip Codes with the Highest Percentage of Population Employed in Health Diagnosing & Treating in Johnson City, TN?
Top 3 Zip Codes with the Highest Percentage of Population Employed in Health Diagnosing & Treating in Johnson City, TN are:
What zip code has the Highest Percentage of Population Employed in Health Diagnosing & Treating in Johnson City, TN?
37614 has the Highest Percentage of Population Employed in Health Diagnosing & Treating in Johnson City, TN with 17.2%.
What is the Percentage of Population Employed in Health Diagnosing & Treating in Johnson City, TN?
Percentage of Population Employed in Health Diagnosing & Treating in Johnson City is 14.2%.
What is the Percentage of Population Employed in Health Diagnosing & Treating in Tennessee?
Percentage of Population Employed in Health Diagnosing & Treating in Tennessee is 6.9%.
What is the Percentage of Population Employed in Health Diagnosing & Treating in the United States?
Percentage of Population Employed in Health Diagnosing & Treating in the United States is 6.2%.