Zip Codes with the Highest Percentage of Population Employed in Administrative & Support Services in Johnson City, TN
RELATED REPORTS & OPTIONS
Administrative & Support Services
Johnson City
Compare Zip Codes
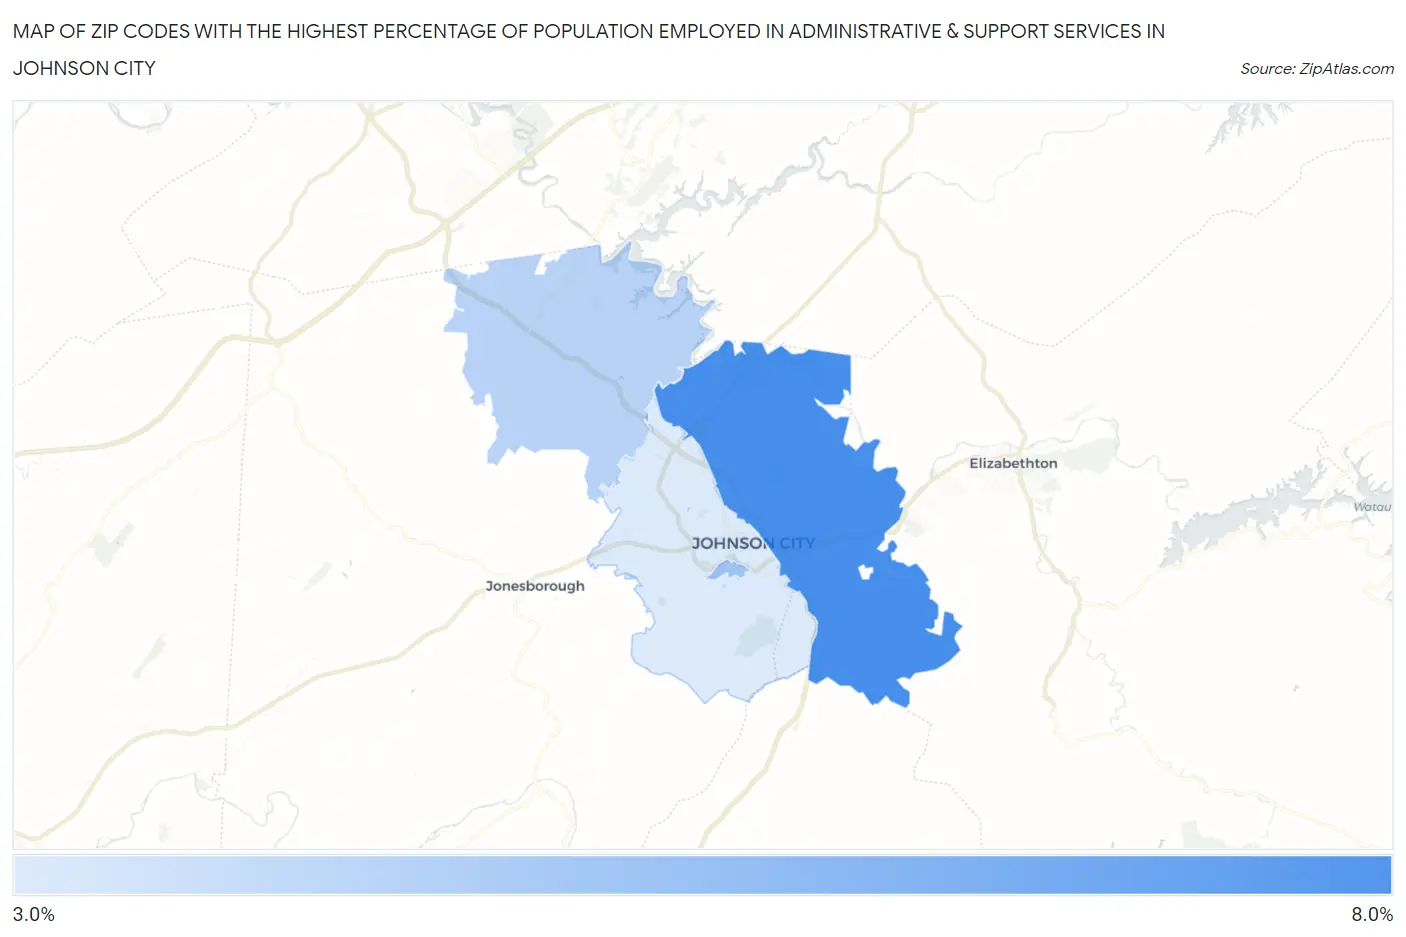
Map of Zip Codes with the Highest Percentage of Population Employed in Administrative & Support Services in Johnson City
3.0%
6.1%
Zip Codes with the Highest Percentage of Population Employed in Administrative & Support Services in Johnson City, TN
| Zip Code | % Employed | vs State | vs National | |
| 1. | 37601 | 6.1% | 4.4%(+1.78)#96 | 4.1%(+1.99)#4,525 |
| 2. | 37614 | 4.3% | 4.4%(-0.076)#204 | 4.1%(+0.127)#9,532 |
| 3. | 37615 | 3.8% | 4.4%(-0.595)#254 | 4.1%(-0.392)#11,724 |
| 4. | 37604 | 3.0% | 4.4%(-1.35)#341 | 4.1%(-1.14)#15,443 |
1
Common Questions
What are the Top 3 Zip Codes with the Highest Percentage of Population Employed in Administrative & Support Services in Johnson City, TN?
Top 3 Zip Codes with the Highest Percentage of Population Employed in Administrative & Support Services in Johnson City, TN are:
What zip code has the Highest Percentage of Population Employed in Administrative & Support Services in Johnson City, TN?
37601 has the Highest Percentage of Population Employed in Administrative & Support Services in Johnson City, TN with 6.1%.
What is the Percentage of Population Employed in Administrative & Support Services in Johnson City, TN?
Percentage of Population Employed in Administrative & Support Services in Johnson City is 4.3%.
What is the Percentage of Population Employed in Administrative & Support Services in Tennessee?
Percentage of Population Employed in Administrative & Support Services in Tennessee is 4.4%.
What is the Percentage of Population Employed in Administrative & Support Services in the United States?
Percentage of Population Employed in Administrative & Support Services in the United States is 4.1%.