Zip Codes with the Highest Percentage of Households Without a Vehicle in Johnson City, TN
RELATED REPORTS & OPTIONS
Households without a Cars
Johnson City
Compare Zip Codes
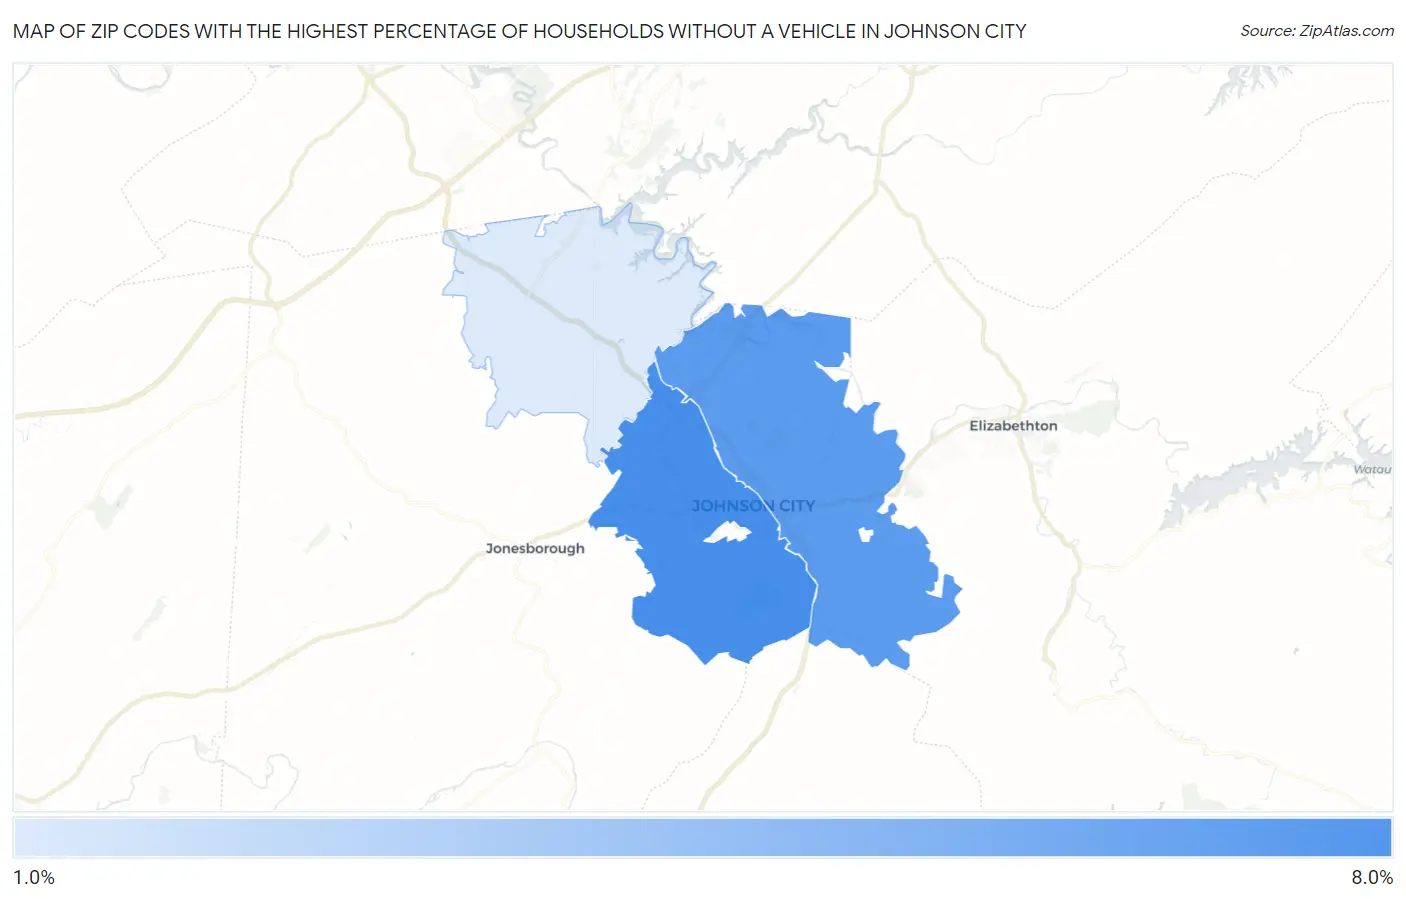
Map of Zip Codes with the Highest Percentage of Households Without a Vehicle in Johnson City
1.8%
7.5%
Zip Codes with the Highest Percentage of Households Without a Vehicle in Johnson City, TN
| Zip Code | Housholds Without a Car | vs State | vs National | |
| 1. | 37604 | 7.5% | 5.3%(+2.20)#124 | 8.3%(-0.800)#7,690 |
| 2. | 37601 | 6.7% | 5.3%(+1.40)#153 | 8.3%(-1.60)#9,014 |
| 3. | 37615 | 1.8% | 5.3%(-3.50)#462 | 8.3%(-6.50)#23,138 |
1
Common Questions
What are the Top Zip Codes with the Highest Percentage of Households Without a Vehicle in Johnson City, TN?
Top Zip Codes with the Highest Percentage of Households Without a Vehicle in Johnson City, TN are:
What zip code has the Highest Percentage of Households Without a Vehicle in Johnson City, TN?
37604 has the Highest Percentage of Households Without a Vehicle in Johnson City, TN with 7.5%.
What is the Percentage of Households Without a Vehicle in Johnson City, TN?
Percentage of Households Without a Vehicle in Johnson City is 7.6%.
What is the Percentage of Households Without a Vehicle in Tennessee?
Percentage of Households Without a Vehicle in Tennessee is 5.3%.
What is the Percentage of Households Without a Vehicle in the United States?
Percentage of Households Without a Vehicle in the United States is 8.3%.