Zip Codes with the Highest Percentage of Population Employed in Food Preparation & Serving in Johnson City, TN
RELATED REPORTS & OPTIONS
Food Preparation & Serving
Johnson City
Compare Zip Codes
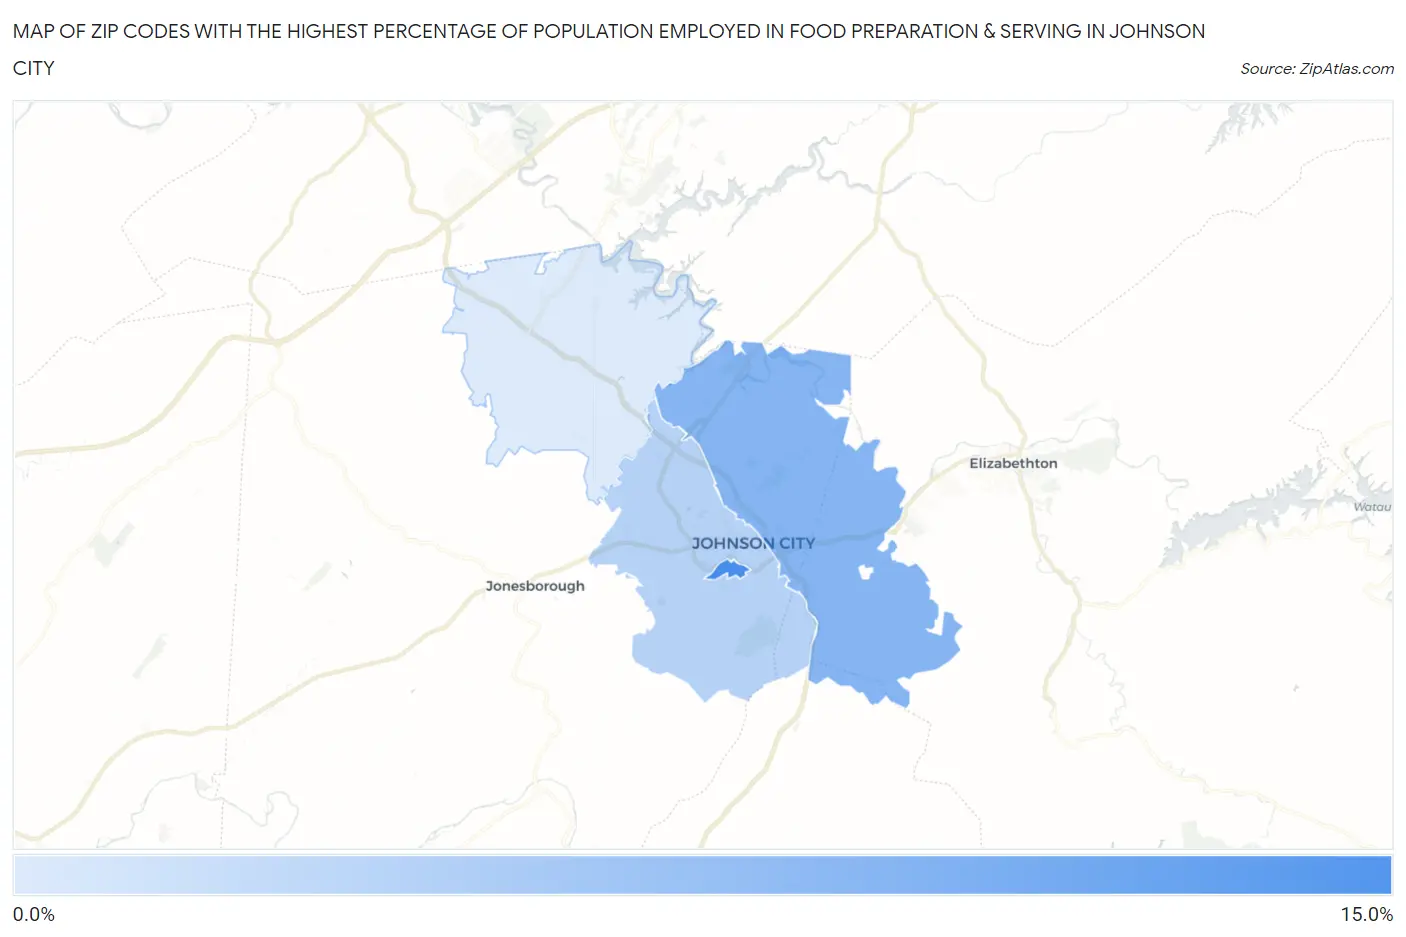
Map of Zip Codes with the Highest Percentage of Population Employed in Food Preparation & Serving in Johnson City
4.7%
13.3%
Zip Codes with the Highest Percentage of Population Employed in Food Preparation & Serving in Johnson City, TN
| Zip Code | % Employed | vs State | vs National | |
| 1. | 37614 | 13.3% | 5.4%(+7.92)#18 | 5.3%(+8.05)#1,304 |
| 2. | 37601 | 9.6% | 5.4%(+4.19)#51 | 5.3%(+4.32)#2,964 |
| 3. | 37604 | 7.0% | 5.4%(+1.55)#139 | 5.3%(+1.68)#6,653 |
| 4. | 37615 | 4.7% | 5.4%(-0.711)#281 | 5.3%(-0.578)#14,126 |
1
Common Questions
What are the Top 3 Zip Codes with the Highest Percentage of Population Employed in Food Preparation & Serving in Johnson City, TN?
Top 3 Zip Codes with the Highest Percentage of Population Employed in Food Preparation & Serving in Johnson City, TN are:
What zip code has the Highest Percentage of Population Employed in Food Preparation & Serving in Johnson City, TN?
37614 has the Highest Percentage of Population Employed in Food Preparation & Serving in Johnson City, TN with 13.3%.
What is the Percentage of Population Employed in Food Preparation & Serving in Johnson City, TN?
Percentage of Population Employed in Food Preparation & Serving in Johnson City is 7.8%.
What is the Percentage of Population Employed in Food Preparation & Serving in Tennessee?
Percentage of Population Employed in Food Preparation & Serving in Tennessee is 5.4%.
What is the Percentage of Population Employed in Food Preparation & Serving in the United States?
Percentage of Population Employed in Food Preparation & Serving in the United States is 5.3%.