Zip Codes with the Highest Percentage of Population Employed in Legal Services & Support in Johnson City, TN
RELATED REPORTS & OPTIONS
Legal Services & Support
Johnson City
Compare Zip Codes
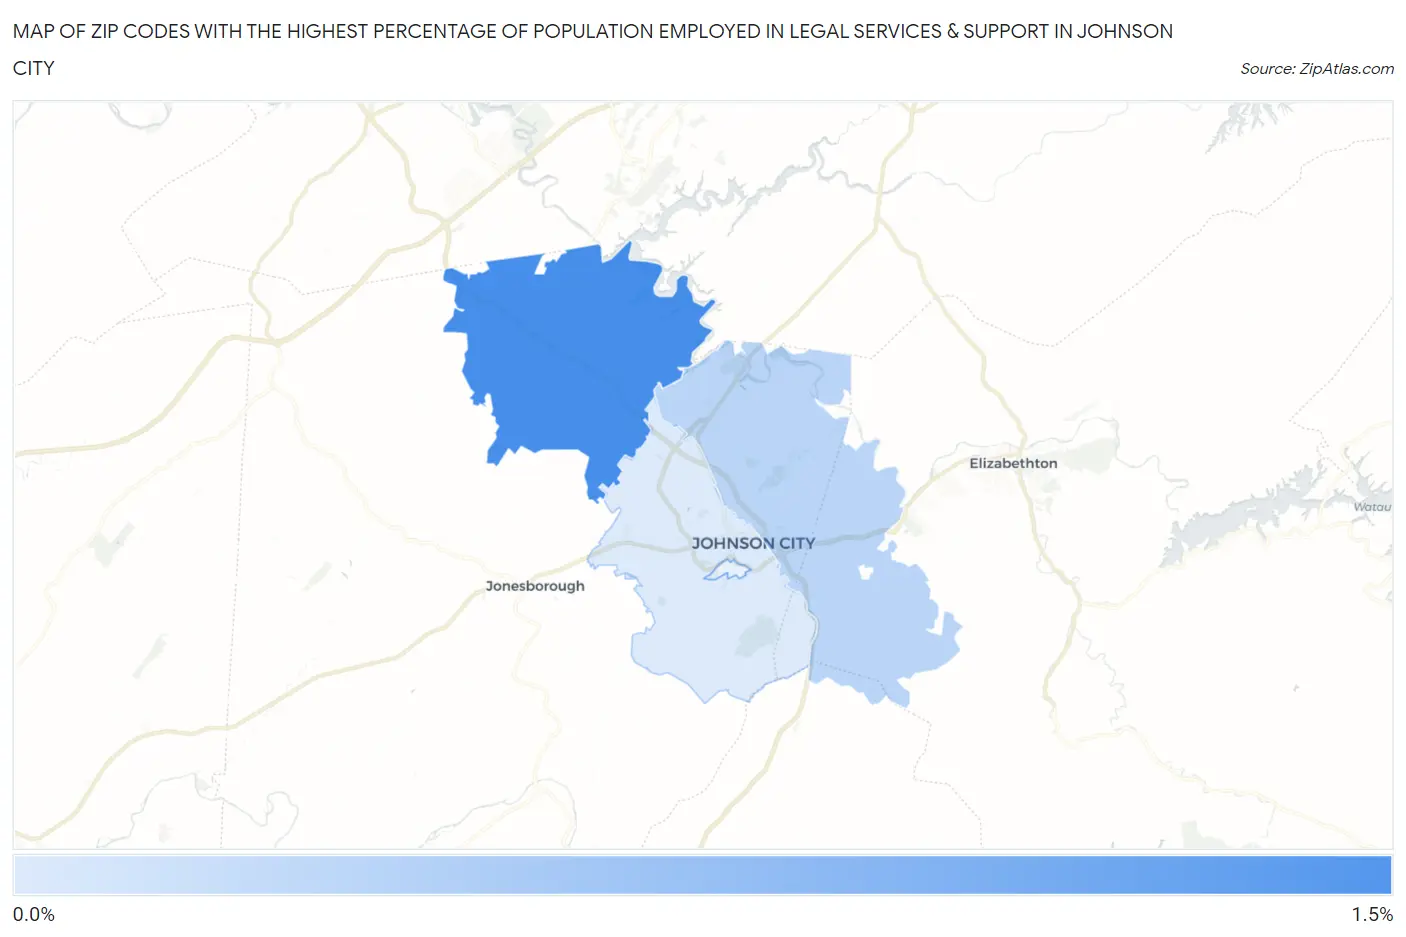
Map of Zip Codes with the Highest Percentage of Population Employed in Legal Services & Support in Johnson City
0.18%
1.2%
Zip Codes with the Highest Percentage of Population Employed in Legal Services & Support in Johnson City, TN
| Zip Code | % Employed | vs State | vs National | |
| 1. | 37615 | 1.2% | 0.90%(+0.266)#99 | 1.2%(-0.020)#6,749 |
| 2. | 37601 | 0.40% | 0.90%(-0.498)#243 | 1.2%(-0.784)#13,839 |
| 3. | 37604 | 0.18% | 0.90%(-0.723)#298 | 1.2%(-1.01)#16,451 |
1
Common Questions
What are the Top 3 Zip Codes with the Highest Percentage of Population Employed in Legal Services & Support in Johnson City, TN?
Top 3 Zip Codes with the Highest Percentage of Population Employed in Legal Services & Support in Johnson City, TN are:
What zip code has the Highest Percentage of Population Employed in Legal Services & Support in Johnson City, TN?
37615 has the Highest Percentage of Population Employed in Legal Services & Support in Johnson City, TN with 1.2%.
What is the Percentage of Population Employed in Legal Services & Support in Johnson City, TN?
Percentage of Population Employed in Legal Services & Support in Johnson City is 0.46%.
What is the Percentage of Population Employed in Legal Services & Support in Tennessee?
Percentage of Population Employed in Legal Services & Support in Tennessee is 0.90%.
What is the Percentage of Population Employed in Legal Services & Support in the United States?
Percentage of Population Employed in Legal Services & Support in the United States is 1.2%.