Zip Codes with the Highest Percentage of Population Employed in Real Estate, Rental & Leasing in Johnson City, TN
RELATED REPORTS & OPTIONS
Real Estate, Rental & Leasing
Johnson City
Compare Zip Codes
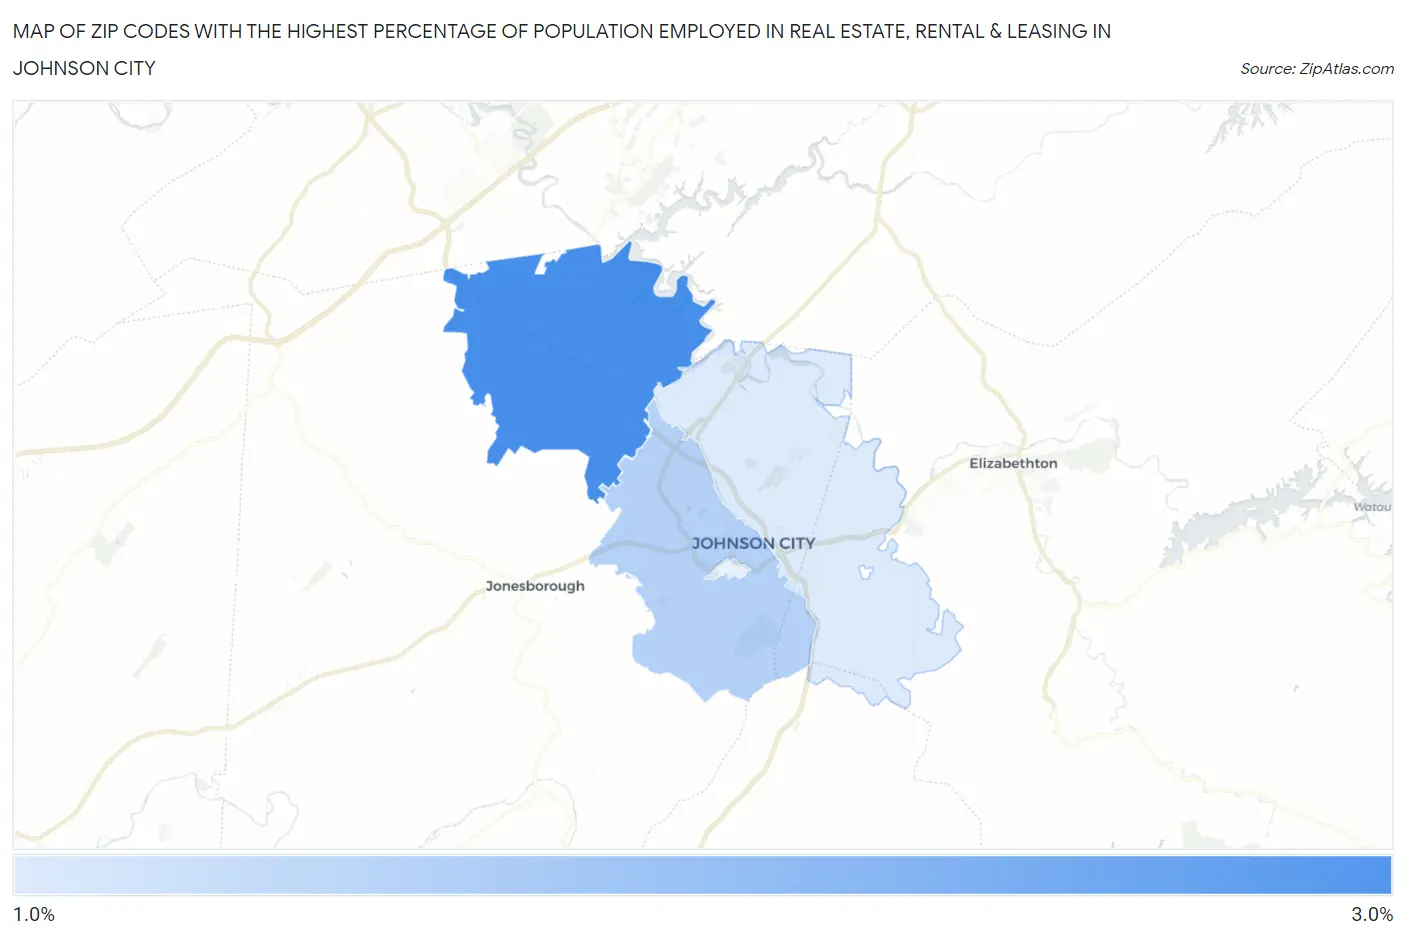
Map of Zip Codes with the Highest Percentage of Population Employed in Real Estate, Rental & Leasing in Johnson City
1.4%
2.5%
Zip Codes with the Highest Percentage of Population Employed in Real Estate, Rental & Leasing in Johnson City, TN
| Zip Code | % Employed | vs State | vs National | |
| 1. | 37615 | 2.5% | 1.7%(+0.797)#94 | 1.9%(+0.640)#5,369 |
| 2. | 37604 | 1.7% | 1.7%(-0.059)#184 | 1.9%(-0.216)#9,933 |
| 3. | 37601 | 1.4% | 1.7%(-0.382)#230 | 1.9%(-0.539)#12,324 |
1
Common Questions
What are the Top 3 Zip Codes with the Highest Percentage of Population Employed in Real Estate, Rental & Leasing in Johnson City, TN?
Top 3 Zip Codes with the Highest Percentage of Population Employed in Real Estate, Rental & Leasing in Johnson City, TN are:
What zip code has the Highest Percentage of Population Employed in Real Estate, Rental & Leasing in Johnson City, TN?
37615 has the Highest Percentage of Population Employed in Real Estate, Rental & Leasing in Johnson City, TN with 2.5%.
What is the Percentage of Population Employed in Real Estate, Rental & Leasing in Johnson City, TN?
Percentage of Population Employed in Real Estate, Rental & Leasing in Johnson City is 2.1%.
What is the Percentage of Population Employed in Real Estate, Rental & Leasing in Tennessee?
Percentage of Population Employed in Real Estate, Rental & Leasing in Tennessee is 1.7%.
What is the Percentage of Population Employed in Real Estate, Rental & Leasing in the United States?
Percentage of Population Employed in Real Estate, Rental & Leasing in the United States is 1.9%.