Finnish vs Cree Receiving Food Stamps
COMPARE
Finnish
Cree
Receiving Food Stamps
Receiving Food Stamps Comparison
Finns
Cree
10.2%
RECEIVING FOOD STAMPS
97.9/ 100
METRIC RATING
90th/ 347
METRIC RANK
13.7%
RECEIVING FOOD STAMPS
0.8/ 100
METRIC RATING
246th/ 347
METRIC RANK
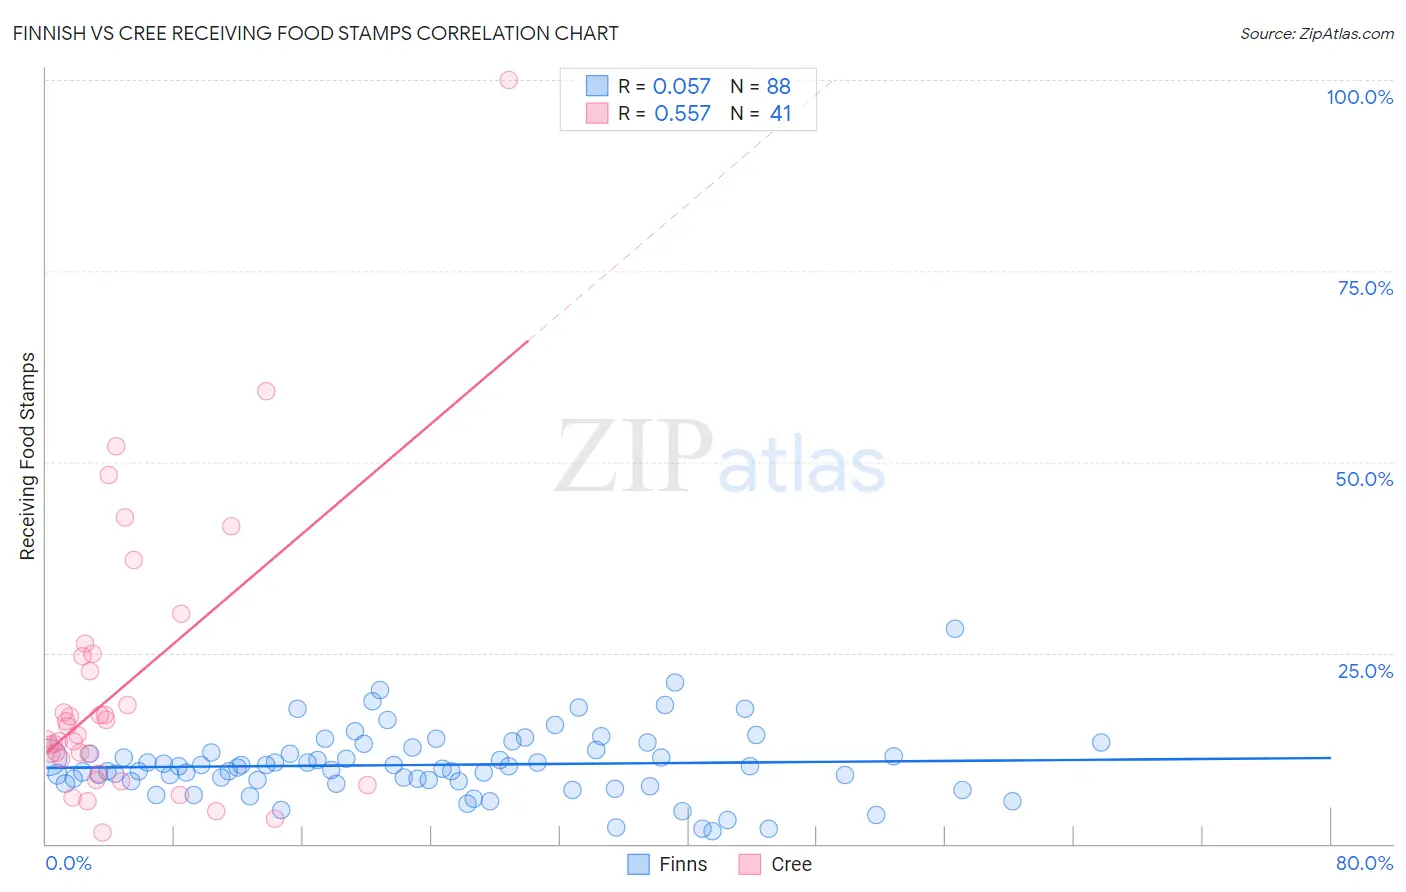
Finnish vs Cree Receiving Food Stamps Correlation Chart
The statistical analysis conducted on geographies consisting of 403,543,220 people shows a slight positive correlation between the proportion of Finns and percentage of population receiving government assistance and/or food stamps in the United States with a correlation coefficient (R) of 0.057 and weighted average of 10.2%. Similarly, the statistical analysis conducted on geographies consisting of 76,186,239 people shows a substantial positive correlation between the proportion of Cree and percentage of population receiving government assistance and/or food stamps in the United States with a correlation coefficient (R) of 0.557 and weighted average of 13.7%, a difference of 35.1%.
Receiving Food Stamps Correlation Summary
| Measurement | Finnish | Cree |
| Minimum | 1.6% | 1.5% |
| Maximum | 28.1% | 100.0% |
| Range | 26.5% | 98.5% |
| Mean | 10.3% | 20.6% |
| Median | 10.0% | 14.2% |
| Interquartile 25% (IQ1) | 8.2% | 10.1% |
| Interquartile 75% (IQ3) | 12.0% | 24.7% |
| Interquartile Range (IQR) | 3.8% | 14.6% |
| Standard Deviation (Sample) | 4.4% | 18.6% |
| Standard Deviation (Population) | 4.4% | 18.4% |
Similar Demographics by Receiving Food Stamps
Demographics Similar to Finns by Receiving Food Stamps
In terms of receiving food stamps, the demographic groups most similar to Finns are Jordanian (10.2%, a difference of 0.040%), Irish (10.2%, a difference of 0.040%), Belgian (10.2%, a difference of 0.42%), Immigrants from France (10.1%, a difference of 0.85%), and Immigrants from Greece (10.3%, a difference of 0.95%).
| Demographics | Rating | Rank | Receiving Food Stamps |
| Dutch | 98.6 /100 | #83 | Exceptional 10.0% |
| Immigrants | Israel | 98.5 /100 | #84 | Exceptional 10.0% |
| Immigrants | Romania | 98.5 /100 | #85 | Exceptional 10.0% |
| Immigrants | Norway | 98.4 /100 | #86 | Exceptional 10.0% |
| Egyptians | 98.4 /100 | #87 | Exceptional 10.0% |
| Immigrants | Kuwait | 98.4 /100 | #88 | Exceptional 10.0% |
| Immigrants | France | 98.3 /100 | #89 | Exceptional 10.1% |
| Finns | 97.9 /100 | #90 | Exceptional 10.2% |
| Jordanians | 97.9 /100 | #91 | Exceptional 10.2% |
| Irish | 97.9 /100 | #92 | Exceptional 10.2% |
| Belgians | 97.7 /100 | #93 | Exceptional 10.2% |
| Immigrants | Greece | 97.4 /100 | #94 | Exceptional 10.3% |
| Basques | 97.4 /100 | #95 | Exceptional 10.3% |
| Welsh | 97.3 /100 | #96 | Exceptional 10.3% |
| Czechoslovakians | 97.2 /100 | #97 | Exceptional 10.3% |
Demographics Similar to Cree by Receiving Food Stamps
In terms of receiving food stamps, the demographic groups most similar to Cree are Immigrants from Somalia (13.7%, a difference of 0.24%), Mexican American Indian (13.8%, a difference of 0.27%), Cajun (13.7%, a difference of 0.28%), Immigrants from Laos (13.8%, a difference of 0.36%), and Somali (13.7%, a difference of 0.44%).
| Demographics | Rating | Rank | Receiving Food Stamps |
| Immigrants | Micronesia | 1.3 /100 | #239 | Tragic 13.5% |
| Iroquois | 1.2 /100 | #240 | Tragic 13.5% |
| Choctaw | 1.0 /100 | #241 | Tragic 13.6% |
| Immigrants | Panama | 1.0 /100 | #242 | Tragic 13.6% |
| Somalis | 0.9 /100 | #243 | Tragic 13.7% |
| Cajuns | 0.9 /100 | #244 | Tragic 13.7% |
| Immigrants | Somalia | 0.9 /100 | #245 | Tragic 13.7% |
| Cree | 0.8 /100 | #246 | Tragic 13.7% |
| Mexican American Indians | 0.7 /100 | #247 | Tragic 13.8% |
| Immigrants | Laos | 0.7 /100 | #248 | Tragic 13.8% |
| Indonesians | 0.6 /100 | #249 | Tragic 13.9% |
| Immigrants | Cambodia | 0.5 /100 | #250 | Tragic 13.9% |
| Yaqui | 0.5 /100 | #251 | Tragic 13.9% |
| Ghanaians | 0.5 /100 | #252 | Tragic 14.0% |
| Spanish Americans | 0.4 /100 | #253 | Tragic 14.0% |