Ecuadorian vs South American Indian Master's Degree
COMPARE
Ecuadorian
South American Indian
Master's Degree
Master's Degree Comparison
Ecuadorians
South American Indians
14.0%
MASTER'S DEGREE
12.6/ 100
METRIC RATING
222nd/ 347
METRIC RANK
15.9%
MASTER'S DEGREE
88.4/ 100
METRIC RATING
135th/ 347
METRIC RANK
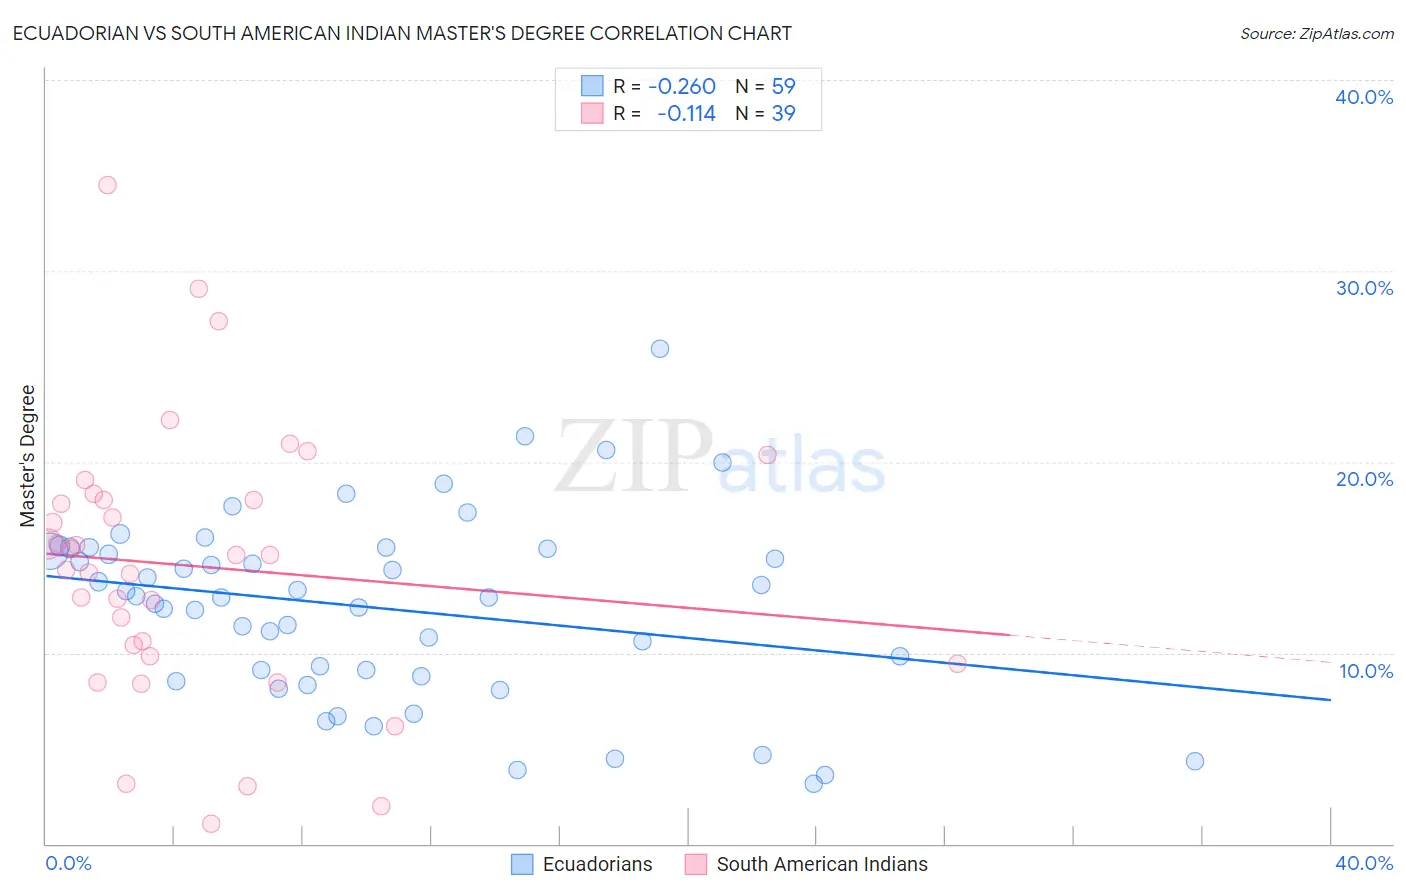
Ecuadorian vs South American Indian Master's Degree Correlation Chart
The statistical analysis conducted on geographies consisting of 317,754,376 people shows a weak negative correlation between the proportion of Ecuadorians and percentage of population with at least master's degree education in the United States with a correlation coefficient (R) of -0.260 and weighted average of 14.0%. Similarly, the statistical analysis conducted on geographies consisting of 164,560,944 people shows a poor negative correlation between the proportion of South American Indians and percentage of population with at least master's degree education in the United States with a correlation coefficient (R) of -0.114 and weighted average of 15.9%, a difference of 13.6%.
Master's Degree Correlation Summary
| Measurement | Ecuadorian | South American Indian |
| Minimum | 3.1% | 1.1% |
| Maximum | 25.9% | 34.5% |
| Range | 22.8% | 33.5% |
| Mean | 12.3% | 14.5% |
| Median | 12.9% | 15.1% |
| Interquartile 25% (IQ1) | 8.8% | 9.8% |
| Interquartile 75% (IQ3) | 15.5% | 18.0% |
| Interquartile Range (IQR) | 6.7% | 8.2% |
| Standard Deviation (Sample) | 4.8% | 7.1% |
| Standard Deviation (Population) | 4.8% | 7.0% |
Similar Demographics by Master's Degree
Demographics Similar to Ecuadorians by Master's Degree
In terms of master's degree, the demographic groups most similar to Ecuadorians are Korean (14.0%, a difference of 0.030%), German (14.0%, a difference of 0.17%), Immigrants from South Eastern Asia (14.0%, a difference of 0.20%), Immigrants from Grenada (14.0%, a difference of 0.25%), and Norwegian (14.0%, a difference of 0.32%).
| Demographics | Rating | Rank | Master's Degree |
| Immigrants | Vietnam | 16.1 /100 | #215 | Poor 14.1% |
| Immigrants | Somalia | 15.8 /100 | #216 | Poor 14.1% |
| Immigrants | Trinidad and Tobago | 15.8 /100 | #217 | Poor 14.1% |
| French Canadians | 14.9 /100 | #218 | Poor 14.1% |
| Norwegians | 13.6 /100 | #219 | Poor 14.0% |
| Germans | 13.1 /100 | #220 | Poor 14.0% |
| Koreans | 12.7 /100 | #221 | Poor 14.0% |
| Ecuadorians | 12.6 /100 | #222 | Poor 14.0% |
| Immigrants | South Eastern Asia | 11.9 /100 | #223 | Poor 14.0% |
| Immigrants | Grenada | 11.8 /100 | #224 | Poor 14.0% |
| Portuguese | 11.2 /100 | #225 | Poor 13.9% |
| Immigrants | St. Vincent and the Grenadines | 11.0 /100 | #226 | Poor 13.9% |
| Immigrants | West Indies | 9.8 /100 | #227 | Tragic 13.9% |
| Whites/Caucasians | 9.1 /100 | #228 | Tragic 13.8% |
| British West Indians | 8.8 /100 | #229 | Tragic 13.8% |
Demographics Similar to South American Indians by Master's Degree
In terms of master's degree, the demographic groups most similar to South American Indians are Venezuelan (15.9%, a difference of 0.0%), Assyrian/Chaldean/Syriac (15.8%, a difference of 0.45%), European (15.8%, a difference of 0.55%), Immigrants from Sudan (16.0%, a difference of 0.56%), and Pakistani (15.8%, a difference of 0.63%).
| Demographics | Rating | Rank | Master's Degree |
| Immigrants | Sierra Leone | 94.7 /100 | #128 | Exceptional 16.3% |
| Immigrants | Syria | 93.3 /100 | #129 | Exceptional 16.2% |
| Immigrants | Jordan | 92.7 /100 | #130 | Exceptional 16.1% |
| Taiwanese | 91.9 /100 | #131 | Exceptional 16.1% |
| Serbians | 91.7 /100 | #132 | Exceptional 16.1% |
| Immigrants | Sudan | 90.2 /100 | #133 | Exceptional 16.0% |
| Venezuelans | 88.4 /100 | #134 | Excellent 15.9% |
| South American Indians | 88.4 /100 | #135 | Excellent 15.9% |
| Assyrians/Chaldeans/Syriacs | 86.8 /100 | #136 | Excellent 15.8% |
| Europeans | 86.4 /100 | #137 | Excellent 15.8% |
| Pakistanis | 86.1 /100 | #138 | Excellent 15.8% |
| Immigrants | Germany | 85.9 /100 | #139 | Excellent 15.8% |
| Vietnamese | 85.5 /100 | #140 | Excellent 15.8% |
| Poles | 85.0 /100 | #141 | Excellent 15.7% |
| Immigrants | Africa | 84.0 /100 | #142 | Excellent 15.7% |