Bahamian vs Colville Married-Couple Family Poverty
COMPARE
Bahamian
Colville
Married-Couple Family Poverty
Married-Couple Family Poverty Comparison
Bahamians
Colville
6.6%
MARRIED-COUPLE FAMILY POVERTY
0.0/ 100
METRIC RATING
294th/ 347
METRIC RANK
6.3%
MARRIED-COUPLE FAMILY POVERTY
0.1/ 100
METRIC RATING
273rd/ 347
METRIC RANK
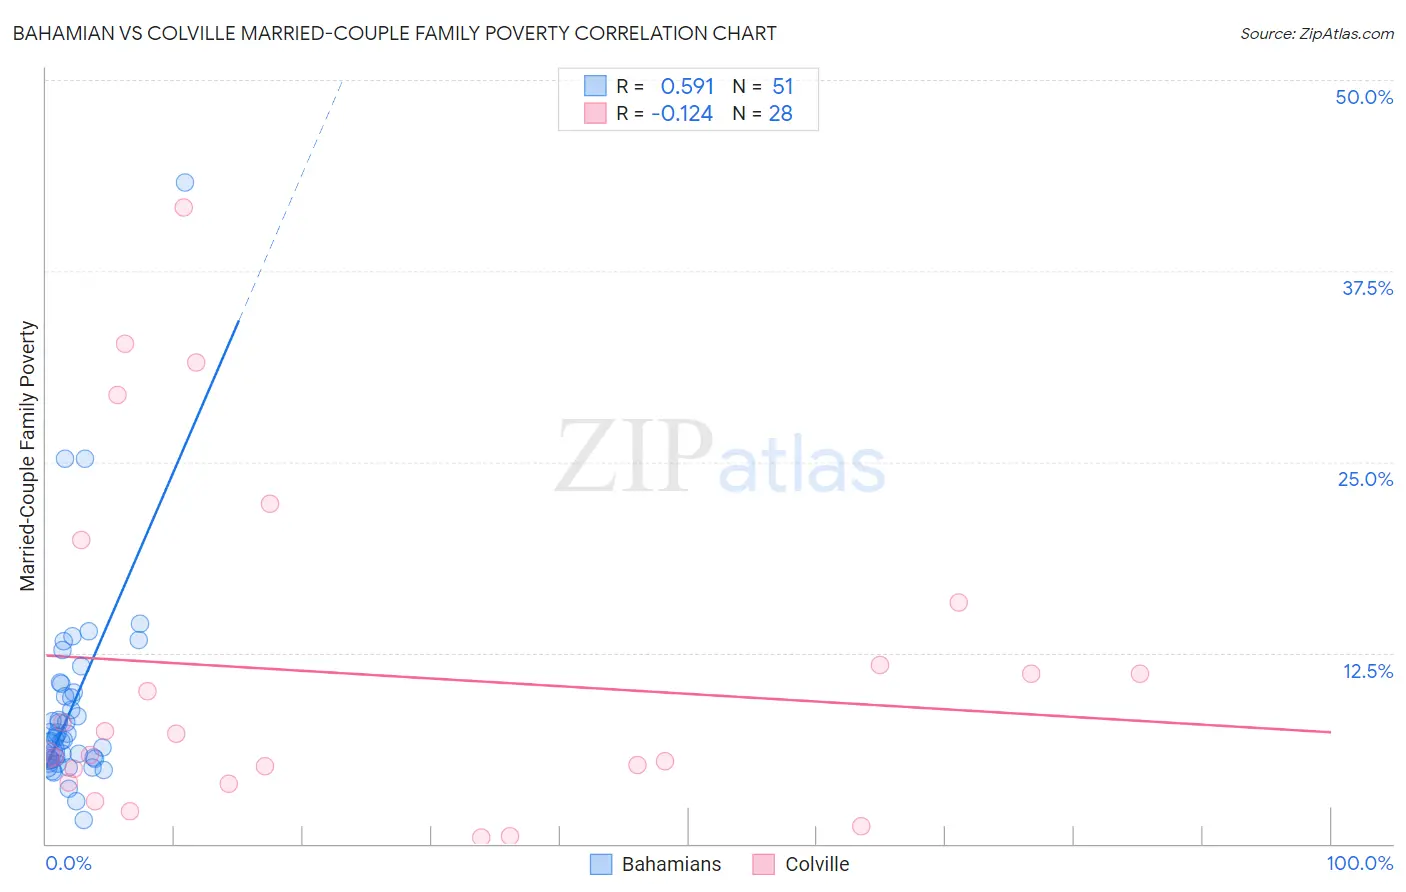
Bahamian vs Colville Married-Couple Family Poverty Correlation Chart
The statistical analysis conducted on geographies consisting of 112,412,919 people shows a substantial positive correlation between the proportion of Bahamians and poverty level among married-couple families in the United States with a correlation coefficient (R) of 0.591 and weighted average of 6.6%. Similarly, the statistical analysis conducted on geographies consisting of 34,633,773 people shows a poor negative correlation between the proportion of Colville and poverty level among married-couple families in the United States with a correlation coefficient (R) of -0.124 and weighted average of 6.3%, a difference of 5.4%.
Married-Couple Family Poverty Correlation Summary
| Measurement | Bahamian | Colville |
| Minimum | 1.6% | 0.42% |
| Maximum | 43.3% | 41.7% |
| Range | 41.8% | 41.2% |
| Mean | 8.9% | 11.2% |
| Median | 6.8% | 6.5% |
| Interquartile 25% (IQ1) | 5.5% | 4.4% |
| Interquartile 75% (IQ3) | 9.9% | 13.7% |
| Interquartile Range (IQR) | 4.4% | 9.3% |
| Standard Deviation (Sample) | 6.7% | 10.9% |
| Standard Deviation (Population) | 6.6% | 10.7% |
Similar Demographics by Married-Couple Family Poverty
Demographics Similar to Bahamians by Married-Couple Family Poverty
In terms of married-couple family poverty, the demographic groups most similar to Bahamians are Immigrants from Uzbekistan (6.6%, a difference of 0.29%), U.S. Virgin Islander (6.6%, a difference of 0.39%), Kiowa (6.6%, a difference of 0.40%), Immigrants from Guyana (6.7%, a difference of 0.47%), and Arapaho (6.6%, a difference of 0.85%).
| Demographics | Rating | Rank | Married-Couple Family Poverty |
| Ecuadorians | 0.0 /100 | #287 | Tragic 6.5% |
| Salvadorans | 0.0 /100 | #288 | Tragic 6.5% |
| Nepalese | 0.0 /100 | #289 | Tragic 6.5% |
| Immigrants | Barbados | 0.0 /100 | #290 | Tragic 6.5% |
| Belizeans | 0.0 /100 | #291 | Tragic 6.5% |
| Immigrants | Lebanon | 0.0 /100 | #292 | Tragic 6.6% |
| Arapaho | 0.0 /100 | #293 | Tragic 6.6% |
| Bahamians | 0.0 /100 | #294 | Tragic 6.6% |
| Immigrants | Uzbekistan | 0.0 /100 | #295 | Tragic 6.6% |
| U.S. Virgin Islanders | 0.0 /100 | #296 | Tragic 6.6% |
| Kiowa | 0.0 /100 | #297 | Tragic 6.6% |
| Immigrants | Guyana | 0.0 /100 | #298 | Tragic 6.7% |
| Nicaraguans | 0.0 /100 | #299 | Tragic 6.7% |
| Immigrants | Belize | 0.0 /100 | #300 | Tragic 6.7% |
| Central Americans | 0.0 /100 | #301 | Tragic 6.7% |
Demographics Similar to Colville by Married-Couple Family Poverty
In terms of married-couple family poverty, the demographic groups most similar to Colville are Barbadian (6.3%, a difference of 0.050%), Choctaw (6.3%, a difference of 0.21%), Yaqui (6.3%, a difference of 0.66%), Trinidadian and Tobagonian (6.2%, a difference of 0.78%), and Indonesian (6.3%, a difference of 0.80%).
| Demographics | Rating | Rank | Married-Couple Family Poverty |
| Creek | 0.2 /100 | #266 | Tragic 6.2% |
| Spanish Americans | 0.2 /100 | #267 | Tragic 6.2% |
| Alaska Natives | 0.2 /100 | #268 | Tragic 6.2% |
| Immigrants | West Indies | 0.1 /100 | #269 | Tragic 6.2% |
| Immigrants | Jamaica | 0.1 /100 | #270 | Tragic 6.2% |
| Immigrants | Bahamas | 0.1 /100 | #271 | Tragic 6.2% |
| Trinidadians and Tobagonians | 0.1 /100 | #272 | Tragic 6.2% |
| Colville | 0.1 /100 | #273 | Tragic 6.3% |
| Barbadians | 0.1 /100 | #274 | Tragic 6.3% |
| Choctaw | 0.1 /100 | #275 | Tragic 6.3% |
| Yaqui | 0.1 /100 | #276 | Tragic 6.3% |
| Indonesians | 0.1 /100 | #277 | Tragic 6.3% |
| Immigrants | Trinidad and Tobago | 0.1 /100 | #278 | Tragic 6.4% |
| Houma | 0.0 /100 | #279 | Tragic 6.4% |
| West Indians | 0.0 /100 | #280 | Tragic 6.4% |