Bahamian vs Immigrants from Ecuador Married-Couple Family Poverty
COMPARE
Bahamian
Immigrants from Ecuador
Married-Couple Family Poverty
Married-Couple Family Poverty Comparison
Bahamians
Immigrants from Ecuador
6.6%
MARRIED-COUPLE FAMILY POVERTY
0.0/ 100
METRIC RATING
294th/ 347
METRIC RANK
6.7%
MARRIED-COUPLE FAMILY POVERTY
0.0/ 100
METRIC RATING
302nd/ 347
METRIC RANK
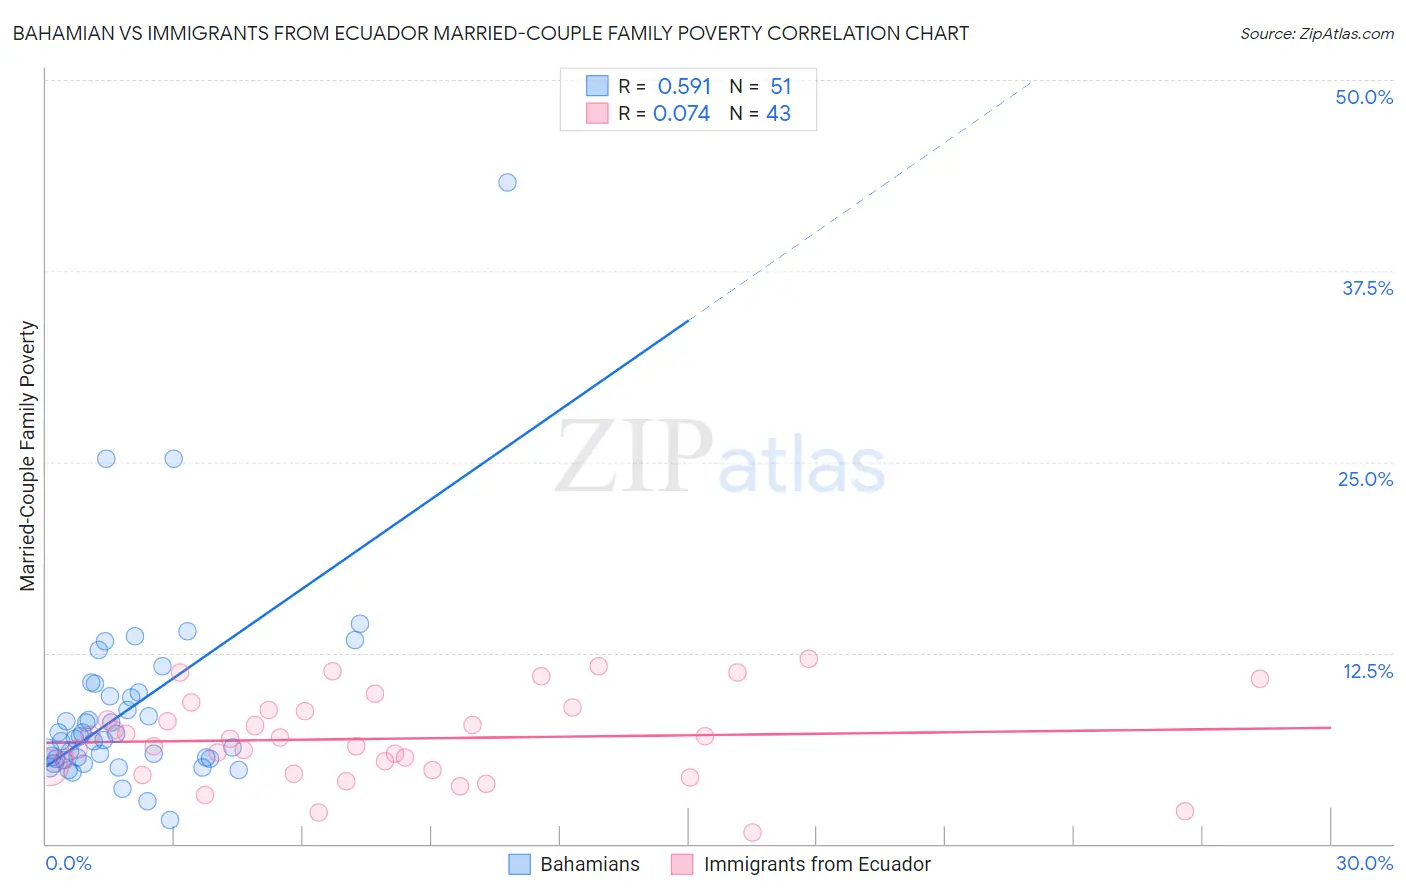
Bahamian vs Immigrants from Ecuador Married-Couple Family Poverty Correlation Chart
The statistical analysis conducted on geographies consisting of 112,412,919 people shows a substantial positive correlation between the proportion of Bahamians and poverty level among married-couple families in the United States with a correlation coefficient (R) of 0.591 and weighted average of 6.6%. Similarly, the statistical analysis conducted on geographies consisting of 269,492,942 people shows a slight positive correlation between the proportion of Immigrants from Ecuador and poverty level among married-couple families in the United States with a correlation coefficient (R) of 0.074 and weighted average of 6.7%, a difference of 1.9%.
Married-Couple Family Poverty Correlation Summary
| Measurement | Bahamian | Immigrants from Ecuador |
| Minimum | 1.6% | 0.76% |
| Maximum | 43.3% | 12.1% |
| Range | 41.8% | 11.3% |
| Mean | 8.9% | 6.9% |
| Median | 6.8% | 6.9% |
| Interquartile 25% (IQ1) | 5.5% | 4.8% |
| Interquartile 75% (IQ3) | 9.9% | 8.8% |
| Interquartile Range (IQR) | 4.4% | 3.9% |
| Standard Deviation (Sample) | 6.7% | 2.8% |
| Standard Deviation (Population) | 6.6% | 2.8% |
Demographics Similar to Bahamians and Immigrants from Ecuador by Married-Couple Family Poverty
In terms of married-couple family poverty, the demographic groups most similar to Bahamians are Immigrants from Uzbekistan (6.6%, a difference of 0.29%), U.S. Virgin Islander (6.6%, a difference of 0.39%), Kiowa (6.6%, a difference of 0.40%), Immigrants from Guyana (6.7%, a difference of 0.47%), and Arapaho (6.6%, a difference of 0.85%). Similarly, the demographic groups most similar to Immigrants from Ecuador are Central American (6.7%, a difference of 0.14%), Immigrants from El Salvador (6.8%, a difference of 0.28%), Cuban (6.8%, a difference of 0.72%), Immigrants from Belize (6.7%, a difference of 0.74%), and Haitian (6.8%, a difference of 0.83%).
| Demographics | Rating | Rank | Married-Couple Family Poverty |
| Salvadorans | 0.0 /100 | #288 | Tragic 6.5% |
| Nepalese | 0.0 /100 | #289 | Tragic 6.5% |
| Immigrants | Barbados | 0.0 /100 | #290 | Tragic 6.5% |
| Belizeans | 0.0 /100 | #291 | Tragic 6.5% |
| Immigrants | Lebanon | 0.0 /100 | #292 | Tragic 6.6% |
| Arapaho | 0.0 /100 | #293 | Tragic 6.6% |
| Bahamians | 0.0 /100 | #294 | Tragic 6.6% |
| Immigrants | Uzbekistan | 0.0 /100 | #295 | Tragic 6.6% |
| U.S. Virgin Islanders | 0.0 /100 | #296 | Tragic 6.6% |
| Kiowa | 0.0 /100 | #297 | Tragic 6.6% |
| Immigrants | Guyana | 0.0 /100 | #298 | Tragic 6.7% |
| Nicaraguans | 0.0 /100 | #299 | Tragic 6.7% |
| Immigrants | Belize | 0.0 /100 | #300 | Tragic 6.7% |
| Central Americans | 0.0 /100 | #301 | Tragic 6.7% |
| Immigrants | Ecuador | 0.0 /100 | #302 | Tragic 6.7% |
| Immigrants | El Salvador | 0.0 /100 | #303 | Tragic 6.8% |
| Cubans | 0.0 /100 | #304 | Tragic 6.8% |
| Haitians | 0.0 /100 | #305 | Tragic 6.8% |
| Immigrants | Haiti | 0.0 /100 | #306 | Tragic 7.0% |
| Guatemalans | 0.0 /100 | #307 | Tragic 7.0% |
| Spanish American Indians | 0.0 /100 | #308 | Tragic 7.1% |