Aleut vs Bermudan Married-Couple Family Poverty
COMPARE
Aleut
Bermudan
Married-Couple Family Poverty
Married-Couple Family Poverty Comparison
Aleuts
Bermudans
4.7%
MARRIED-COUPLE FAMILY POVERTY
97.0/ 100
METRIC RATING
105th/ 347
METRIC RANK
5.2%
MARRIED-COUPLE FAMILY POVERTY
52.9/ 100
METRIC RATING
171st/ 347
METRIC RANK
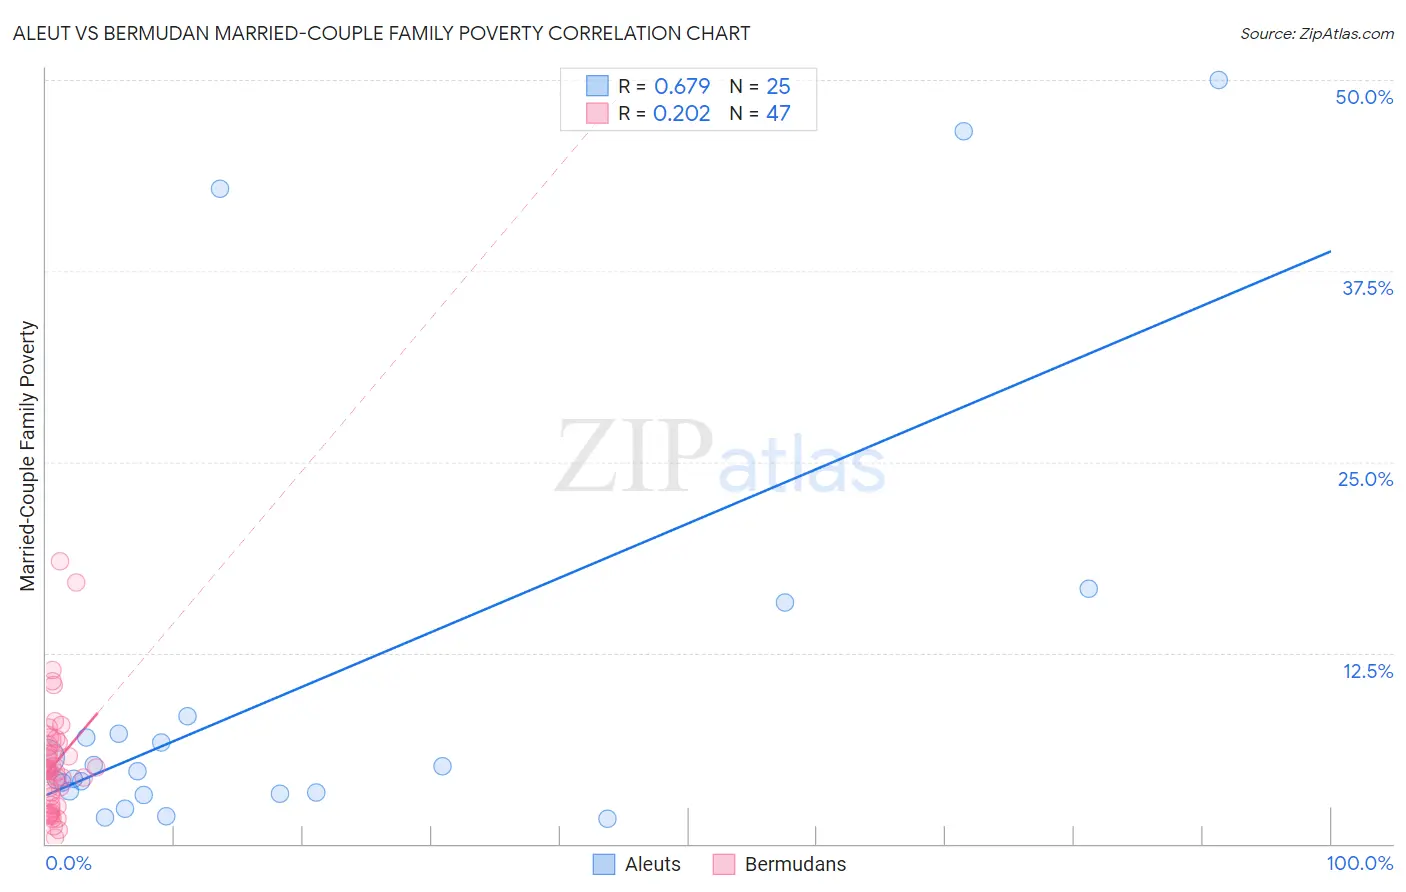
Aleut vs Bermudan Married-Couple Family Poverty Correlation Chart
The statistical analysis conducted on geographies consisting of 61,581,889 people shows a significant positive correlation between the proportion of Aleuts and poverty level among married-couple families in the United States with a correlation coefficient (R) of 0.679 and weighted average of 4.7%. Similarly, the statistical analysis conducted on geographies consisting of 55,613,061 people shows a weak positive correlation between the proportion of Bermudans and poverty level among married-couple families in the United States with a correlation coefficient (R) of 0.202 and weighted average of 5.2%, a difference of 10.9%.
Married-Couple Family Poverty Correlation Summary
| Measurement | Aleut | Bermudan |
| Minimum | 1.6% | 0.39% |
| Maximum | 50.0% | 18.5% |
| Range | 48.4% | 18.1% |
| Mean | 10.4% | 5.3% |
| Median | 4.8% | 4.9% |
| Interquartile 25% (IQ1) | 3.3% | 2.5% |
| Interquartile 75% (IQ3) | 7.8% | 6.6% |
| Interquartile Range (IQR) | 4.5% | 4.1% |
| Standard Deviation (Sample) | 14.1% | 3.7% |
| Standard Deviation (Population) | 13.9% | 3.6% |
Similar Demographics by Married-Couple Family Poverty
Demographics Similar to Aleuts by Married-Couple Family Poverty
In terms of married-couple family poverty, the demographic groups most similar to Aleuts are Immigrants from Moldova (4.7%, a difference of 0.070%), Immigrants from France (4.7%, a difference of 0.15%), Immigrants from Germany (4.7%, a difference of 0.16%), Immigrants from Romania (4.7%, a difference of 0.41%), and Laotian (4.7%, a difference of 0.43%).
| Demographics | Rating | Rank | Married-Couple Family Poverty |
| Native Hawaiians | 98.0 /100 | #98 | Exceptional 4.6% |
| Immigrants | Europe | 97.9 /100 | #99 | Exceptional 4.6% |
| Immigrants | Western Europe | 97.9 /100 | #100 | Exceptional 4.6% |
| Yugoslavians | 97.8 /100 | #101 | Exceptional 4.6% |
| Asians | 97.6 /100 | #102 | Exceptional 4.7% |
| Immigrants | Romania | 97.3 /100 | #103 | Exceptional 4.7% |
| Immigrants | Moldova | 97.1 /100 | #104 | Exceptional 4.7% |
| Aleuts | 97.0 /100 | #105 | Exceptional 4.7% |
| Immigrants | France | 96.9 /100 | #106 | Exceptional 4.7% |
| Immigrants | Germany | 96.8 /100 | #107 | Exceptional 4.7% |
| Laotians | 96.6 /100 | #108 | Exceptional 4.7% |
| Immigrants | Hong Kong | 96.4 /100 | #109 | Exceptional 4.7% |
| Immigrants | Bolivia | 96.2 /100 | #110 | Exceptional 4.7% |
| Pakistanis | 96.2 /100 | #111 | Exceptional 4.7% |
| Tongans | 95.9 /100 | #112 | Exceptional 4.7% |
Demographics Similar to Bermudans by Married-Couple Family Poverty
In terms of married-couple family poverty, the demographic groups most similar to Bermudans are Immigrants from Argentina (5.2%, a difference of 0.18%), Immigrants from Northern Africa (5.2%, a difference of 0.18%), Ottawa (5.2%, a difference of 0.19%), Alsatian (5.2%, a difference of 0.20%), and Immigrants from Uganda (5.2%, a difference of 0.23%).
| Demographics | Rating | Rank | Married-Couple Family Poverty |
| Hawaiians | 62.3 /100 | #164 | Good 5.1% |
| Immigrants | Malaysia | 62.2 /100 | #165 | Good 5.1% |
| Paraguayans | 61.5 /100 | #166 | Good 5.1% |
| Costa Ricans | 61.5 /100 | #167 | Good 5.1% |
| Immigrants | Uganda | 54.9 /100 | #168 | Average 5.2% |
| Ottawa | 54.5 /100 | #169 | Average 5.2% |
| Immigrants | Argentina | 54.4 /100 | #170 | Average 5.2% |
| Bermudans | 52.9 /100 | #171 | Average 5.2% |
| Immigrants | Northern Africa | 51.3 /100 | #172 | Average 5.2% |
| Alsatians | 51.2 /100 | #173 | Average 5.2% |
| Immigrants | Eastern Africa | 50.0 /100 | #174 | Average 5.2% |
| Marshallese | 47.9 /100 | #175 | Average 5.2% |
| Menominee | 47.8 /100 | #176 | Average 5.2% |
| Immigrants | Kazakhstan | 45.1 /100 | #177 | Average 5.2% |
| Immigrants | Ukraine | 44.9 /100 | #178 | Average 5.2% |