Immigrants from Cabo Verde vs Bermudan Married-Couple Family Poverty
COMPARE
Immigrants from Cabo Verde
Bermudan
Married-Couple Family Poverty
Married-Couple Family Poverty Comparison
Immigrants from Cabo Verde
Bermudans
5.3%
MARRIED-COUPLE FAMILY POVERTY
30.9/ 100
METRIC RATING
191st/ 347
METRIC RANK
5.2%
MARRIED-COUPLE FAMILY POVERTY
52.9/ 100
METRIC RATING
171st/ 347
METRIC RANK
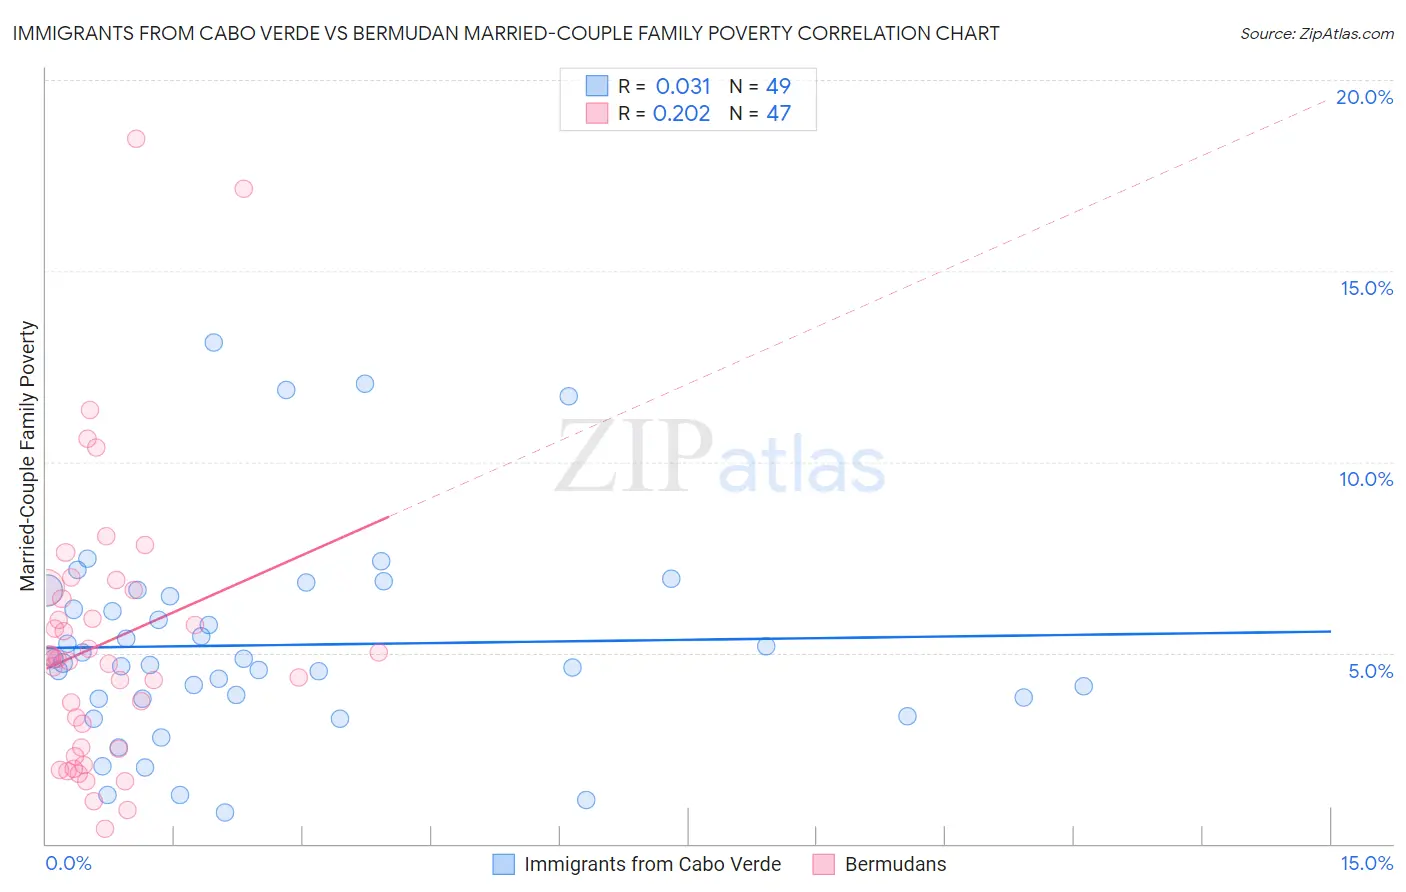
Immigrants from Cabo Verde vs Bermudan Married-Couple Family Poverty Correlation Chart
The statistical analysis conducted on geographies consisting of 38,016,283 people shows no correlation between the proportion of Immigrants from Cabo Verde and poverty level among married-couple families in the United States with a correlation coefficient (R) of 0.031 and weighted average of 5.3%. Similarly, the statistical analysis conducted on geographies consisting of 55,613,061 people shows a weak positive correlation between the proportion of Bermudans and poverty level among married-couple families in the United States with a correlation coefficient (R) of 0.202 and weighted average of 5.2%, a difference of 2.7%.
Married-Couple Family Poverty Correlation Summary
| Measurement | Immigrants from Cabo Verde | Bermudan |
| Minimum | 0.81% | 0.39% |
| Maximum | 13.1% | 18.5% |
| Range | 12.3% | 18.1% |
| Mean | 5.2% | 5.3% |
| Median | 4.7% | 4.9% |
| Interquartile 25% (IQ1) | 3.8% | 2.5% |
| Interquartile 75% (IQ3) | 6.6% | 6.6% |
| Interquartile Range (IQR) | 2.8% | 4.1% |
| Standard Deviation (Sample) | 2.7% | 3.7% |
| Standard Deviation (Population) | 2.7% | 3.6% |
Demographics Similar to Immigrants from Cabo Verde and Bermudans by Married-Couple Family Poverty
In terms of married-couple family poverty, the demographic groups most similar to Immigrants from Cabo Verde are Ugandan (5.3%, a difference of 0.090%), South American Indian (5.3%, a difference of 0.20%), Israeli (5.3%, a difference of 0.29%), Immigrants from Albania (5.3%, a difference of 0.38%), and Hungarian (5.3%, a difference of 0.50%). Similarly, the demographic groups most similar to Bermudans are Immigrants from Northern Africa (5.2%, a difference of 0.18%), Alsatian (5.2%, a difference of 0.20%), Immigrants from Eastern Africa (5.2%, a difference of 0.33%), Marshallese (5.2%, a difference of 0.58%), and Menominee (5.2%, a difference of 0.59%).
| Demographics | Rating | Rank | Married-Couple Family Poverty |
| Bermudans | 52.9 /100 | #171 | Average 5.2% |
| Immigrants | Northern Africa | 51.3 /100 | #172 | Average 5.2% |
| Alsatians | 51.2 /100 | #173 | Average 5.2% |
| Immigrants | Eastern Africa | 50.0 /100 | #174 | Average 5.2% |
| Marshallese | 47.9 /100 | #175 | Average 5.2% |
| Menominee | 47.8 /100 | #176 | Average 5.2% |
| Immigrants | Kazakhstan | 45.1 /100 | #177 | Average 5.2% |
| Immigrants | Ukraine | 44.9 /100 | #178 | Average 5.2% |
| Spanish | 41.4 /100 | #179 | Average 5.3% |
| Immigrants | Sierra Leone | 39.3 /100 | #180 | Fair 5.3% |
| Immigrants | Chile | 38.8 /100 | #181 | Fair 5.3% |
| Immigrants | Vietnam | 37.7 /100 | #182 | Fair 5.3% |
| Peruvians | 37.6 /100 | #183 | Fair 5.3% |
| Immigrants | Nonimmigrants | 35.8 /100 | #184 | Fair 5.3% |
| Americans | 35.4 /100 | #185 | Fair 5.3% |
| Hungarians | 34.7 /100 | #186 | Fair 5.3% |
| Immigrants | Albania | 33.8 /100 | #187 | Fair 5.3% |
| Israelis | 33.1 /100 | #188 | Fair 5.3% |
| South American Indians | 32.5 /100 | #189 | Fair 5.3% |
| Ugandans | 31.6 /100 | #190 | Fair 5.3% |
| Immigrants | Cabo Verde | 30.9 /100 | #191 | Fair 5.3% |