Tohono O'odham vs Bermudan Married-Couple Family Poverty
COMPARE
Tohono O'odham
Bermudan
Married-Couple Family Poverty
Married-Couple Family Poverty Comparison
Tohono O'odham
Bermudans
11.2%
MARRIED-COUPLE FAMILY POVERTY
0.0/ 100
METRIC RATING
342nd/ 347
METRIC RANK
5.2%
MARRIED-COUPLE FAMILY POVERTY
52.9/ 100
METRIC RATING
171st/ 347
METRIC RANK
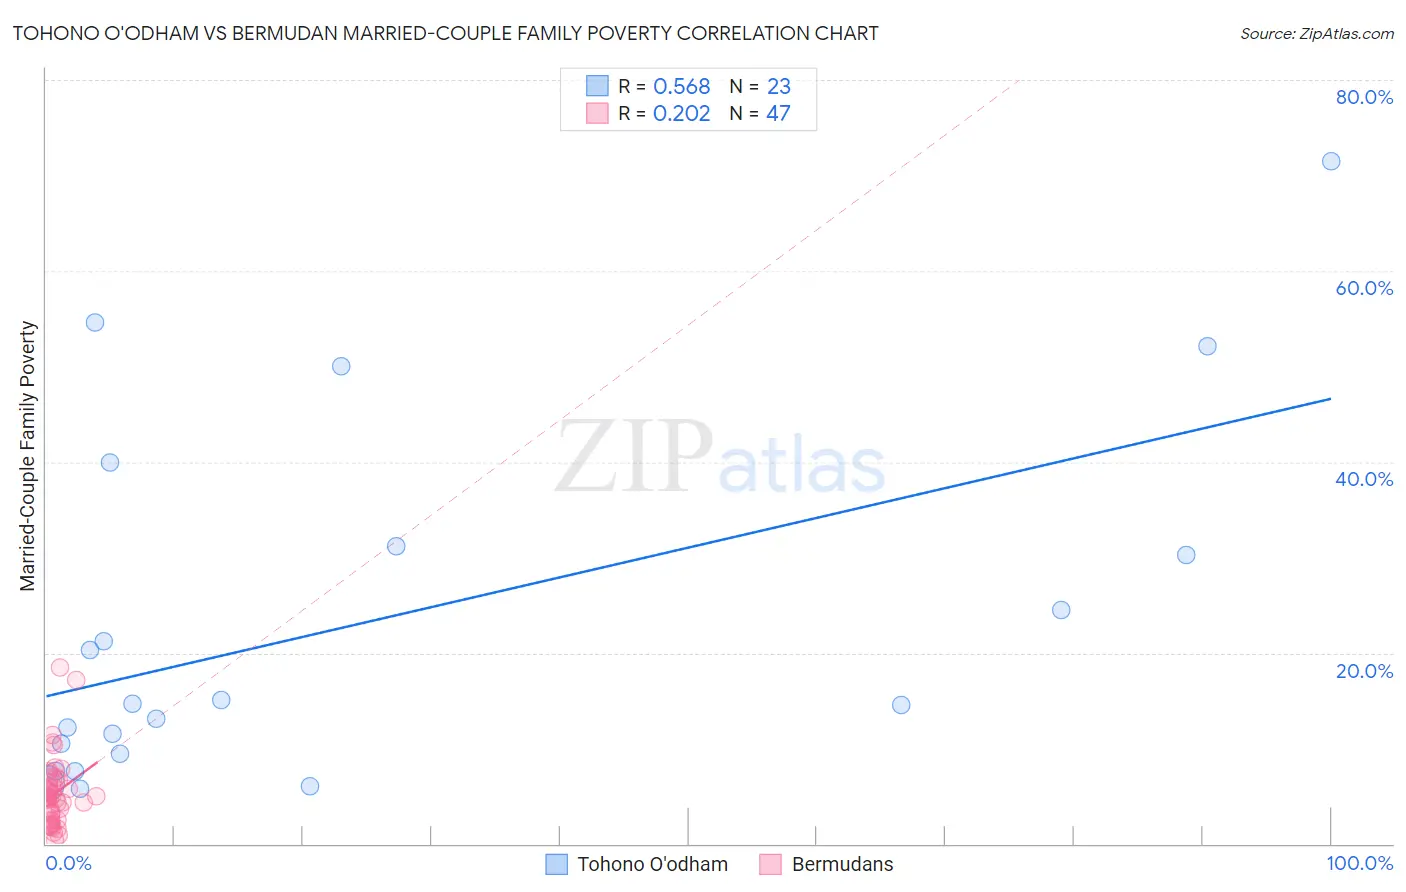
Tohono O'odham vs Bermudan Married-Couple Family Poverty Correlation Chart
The statistical analysis conducted on geographies consisting of 58,693,710 people shows a substantial positive correlation between the proportion of Tohono O'odham and poverty level among married-couple families in the United States with a correlation coefficient (R) of 0.568 and weighted average of 11.2%. Similarly, the statistical analysis conducted on geographies consisting of 55,613,061 people shows a weak positive correlation between the proportion of Bermudans and poverty level among married-couple families in the United States with a correlation coefficient (R) of 0.202 and weighted average of 5.2%, a difference of 115.7%.
Married-Couple Family Poverty Correlation Summary
| Measurement | Tohono O'odham | Bermudan |
| Minimum | 5.8% | 0.39% |
| Maximum | 71.6% | 18.5% |
| Range | 65.8% | 18.1% |
| Mean | 23.0% | 5.3% |
| Median | 14.7% | 4.9% |
| Interquartile 25% (IQ1) | 9.4% | 2.5% |
| Interquartile 75% (IQ3) | 31.2% | 6.6% |
| Interquartile Range (IQR) | 21.8% | 4.1% |
| Standard Deviation (Sample) | 18.6% | 3.7% |
| Standard Deviation (Population) | 18.2% | 3.6% |
Similar Demographics by Married-Couple Family Poverty
Demographics Similar to Tohono O'odham by Married-Couple Family Poverty
In terms of married-couple family poverty, the demographic groups most similar to Tohono O'odham are Pueblo (11.1%, a difference of 0.93%), Pima (11.4%, a difference of 1.7%), Navajo (11.9%, a difference of 5.6%), Puerto Rican (12.6%, a difference of 12.6%), and Immigrants from Yemen (12.8%, a difference of 14.1%).
| Demographics | Rating | Rank | Married-Couple Family Poverty |
| Lumbee | 0.0 /100 | #333 | Tragic 8.3% |
| Immigrants | Dominican Republic | 0.0 /100 | #334 | Tragic 8.4% |
| Sioux | 0.0 /100 | #335 | Tragic 8.7% |
| Apache | 0.0 /100 | #336 | Tragic 9.0% |
| Yakama | 0.0 /100 | #337 | Tragic 9.0% |
| Cheyenne | 0.0 /100 | #338 | Tragic 9.4% |
| Crow | 0.0 /100 | #339 | Tragic 9.6% |
| Yuman | 0.0 /100 | #340 | Tragic 9.7% |
| Pueblo | 0.0 /100 | #341 | Tragic 11.1% |
| Tohono O'odham | 0.0 /100 | #342 | Tragic 11.2% |
| Pima | 0.0 /100 | #343 | Tragic 11.4% |
| Navajo | 0.0 /100 | #344 | Tragic 11.9% |
| Puerto Ricans | 0.0 /100 | #345 | Tragic 12.6% |
| Immigrants | Yemen | 0.0 /100 | #346 | Tragic 12.8% |
| Yup'ik | 0.0 /100 | #347 | Tragic 13.4% |
Demographics Similar to Bermudans by Married-Couple Family Poverty
In terms of married-couple family poverty, the demographic groups most similar to Bermudans are Immigrants from Argentina (5.2%, a difference of 0.18%), Immigrants from Northern Africa (5.2%, a difference of 0.18%), Ottawa (5.2%, a difference of 0.19%), Alsatian (5.2%, a difference of 0.20%), and Immigrants from Uganda (5.2%, a difference of 0.23%).
| Demographics | Rating | Rank | Married-Couple Family Poverty |
| Hawaiians | 62.3 /100 | #164 | Good 5.1% |
| Immigrants | Malaysia | 62.2 /100 | #165 | Good 5.1% |
| Paraguayans | 61.5 /100 | #166 | Good 5.1% |
| Costa Ricans | 61.5 /100 | #167 | Good 5.1% |
| Immigrants | Uganda | 54.9 /100 | #168 | Average 5.2% |
| Ottawa | 54.5 /100 | #169 | Average 5.2% |
| Immigrants | Argentina | 54.4 /100 | #170 | Average 5.2% |
| Bermudans | 52.9 /100 | #171 | Average 5.2% |
| Immigrants | Northern Africa | 51.3 /100 | #172 | Average 5.2% |
| Alsatians | 51.2 /100 | #173 | Average 5.2% |
| Immigrants | Eastern Africa | 50.0 /100 | #174 | Average 5.2% |
| Marshallese | 47.9 /100 | #175 | Average 5.2% |
| Menominee | 47.8 /100 | #176 | Average 5.2% |
| Immigrants | Kazakhstan | 45.1 /100 | #177 | Average 5.2% |
| Immigrants | Ukraine | 44.9 /100 | #178 | Average 5.2% |