Zip Codes with the Highest Percentage of Population Employed in Security & Protection in Pottstown, PA
RELATED REPORTS & OPTIONS
Security & Protection
Pottstown
Compare Zip Codes
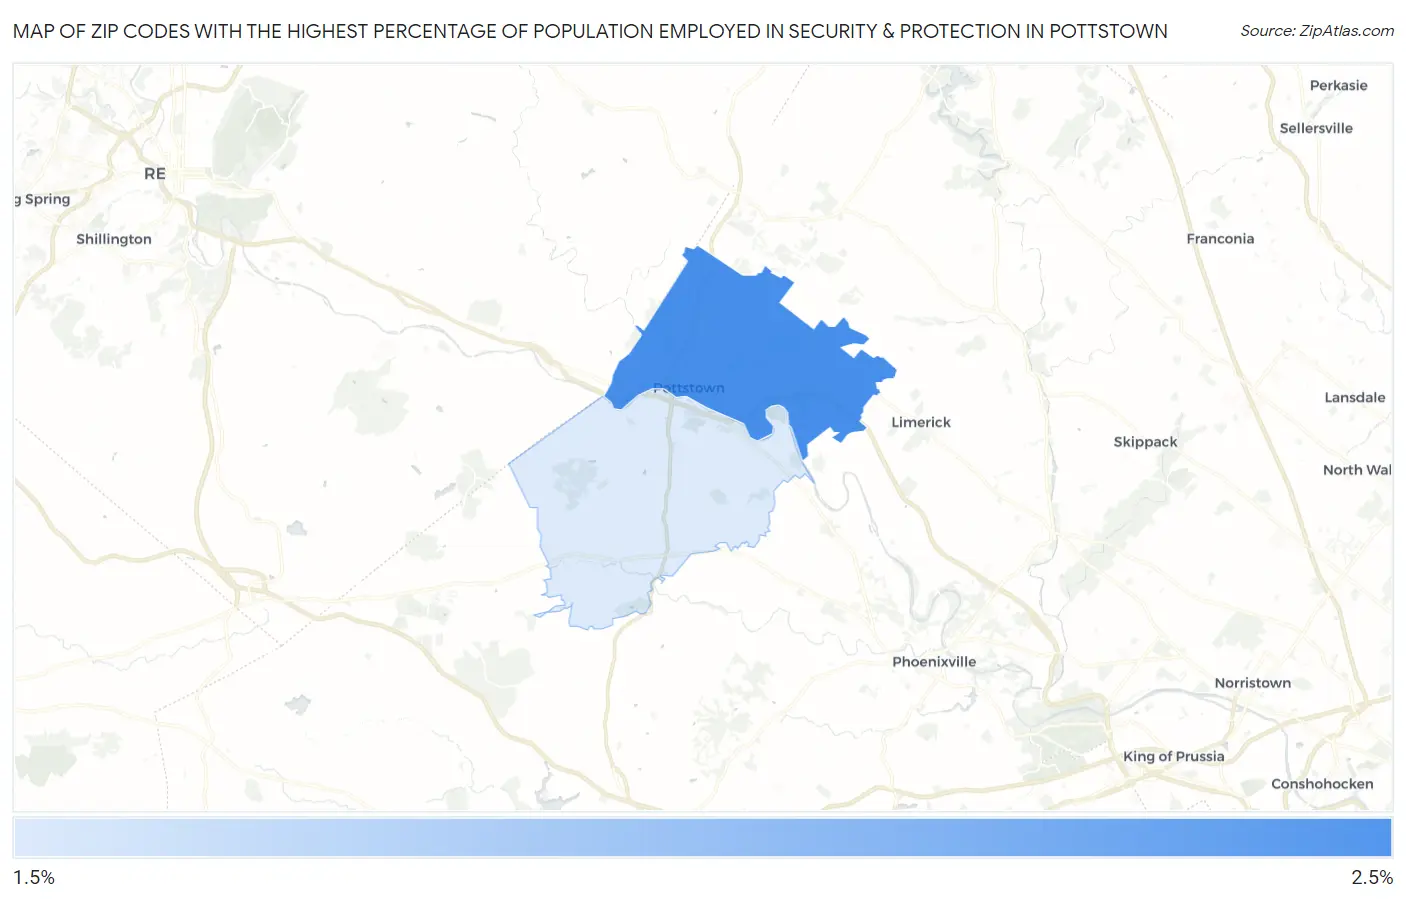
Map of Zip Codes with the Highest Percentage of Population Employed in Security & Protection in Pottstown
1.7%
2.3%
Zip Codes with the Highest Percentage of Population Employed in Security & Protection in Pottstown, PA
| Zip Code | % Employed | vs State | vs National | |
| 1. | 19464 | 2.3% | 2.0%(+0.240)#529 | 2.1%(+0.111)#10,886 |
| 2. | 19465 | 1.7% | 2.0%(-0.314)#744 | 2.1%(-0.443)#14,636 |
1
Common Questions
What are the Top Zip Codes with the Highest Percentage of Population Employed in Security & Protection in Pottstown, PA?
Top Zip Codes with the Highest Percentage of Population Employed in Security & Protection in Pottstown, PA are:
What zip code has the Highest Percentage of Population Employed in Security & Protection in Pottstown, PA?
19464 has the Highest Percentage of Population Employed in Security & Protection in Pottstown, PA with 2.3%.
What is the Percentage of Population Employed in Security & Protection in Pennsylvania?
Percentage of Population Employed in Security & Protection in Pennsylvania is 2.0%.
What is the Percentage of Population Employed in Security & Protection in the United States?
Percentage of Population Employed in Security & Protection in the United States is 2.1%.