Zip Codes with the Highest Percentage of Population Employed in Security & Protection in Butler, PA
RELATED REPORTS & OPTIONS
Security & Protection
Butler
Compare Zip Codes
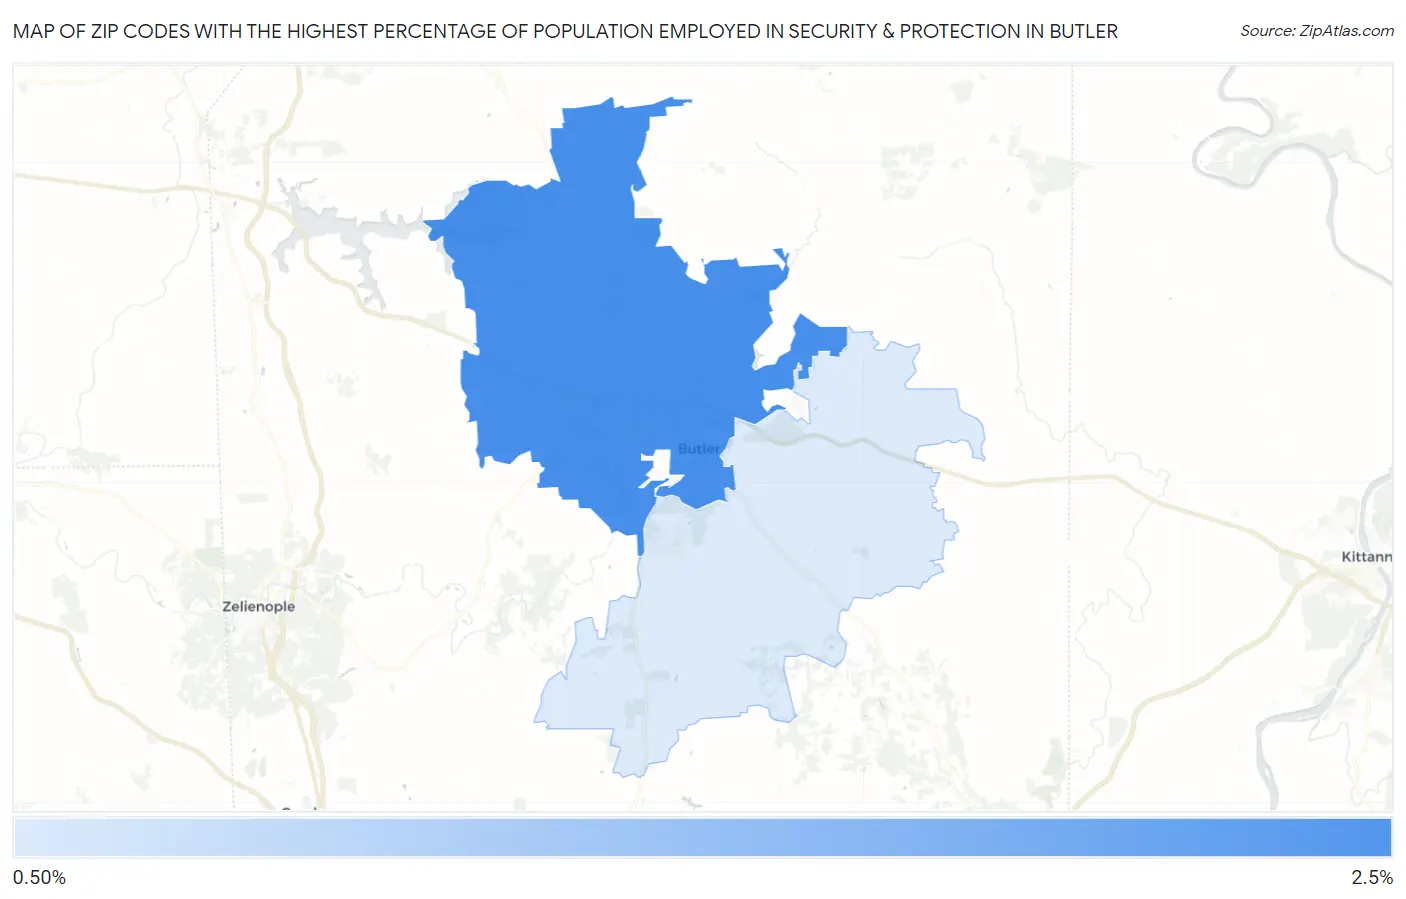
Map of Zip Codes with the Highest Percentage of Population Employed in Security & Protection in Butler
1.4%
2.3%
Zip Codes with the Highest Percentage of Population Employed in Security & Protection in Butler, PA
| Zip Code | % Employed | vs State | vs National | |
| 1. | 16001 | 2.3% | 2.0%(+0.298)#508 | 2.1%(+0.169)#10,533 |
| 2. | 16002 | 1.4% | 2.0%(-0.657)#886 | 2.1%(-0.785)#17,229 |
1
Common Questions
What are the Top Zip Codes with the Highest Percentage of Population Employed in Security & Protection in Butler, PA?
Top Zip Codes with the Highest Percentage of Population Employed in Security & Protection in Butler, PA are:
What zip code has the Highest Percentage of Population Employed in Security & Protection in Butler, PA?
16001 has the Highest Percentage of Population Employed in Security & Protection in Butler, PA with 2.3%.
What is the Percentage of Population Employed in Security & Protection in Butler, PA?
Percentage of Population Employed in Security & Protection in Butler is 0.92%.
What is the Percentage of Population Employed in Security & Protection in Pennsylvania?
Percentage of Population Employed in Security & Protection in Pennsylvania is 2.0%.
What is the Percentage of Population Employed in Security & Protection in the United States?
Percentage of Population Employed in Security & Protection in the United States is 2.1%.