Fostoria, OH Map & Demographics
Fostoria Map
Fostoria Overview
$26,669
PER CAPITA INCOME
$66,286
AVG FAMILY INCOME
$53,145
AVG HOUSEHOLD INCOME
30.2%
WAGE / INCOME GAP [ % ]
69.8¢/ $1
WAGE / INCOME GAP [ $ ]
$12,827
FAMILY INCOME DEFICIT
0.42
INEQUALITY / GINI INDEX
12,904
TOTAL POPULATION
6,347
MALE POPULATION
6,557
FEMALE POPULATION
96.80
MALES / 100 FEMALES
103.31
FEMALES / 100 MALES
37.4
MEDIAN AGE
3.1
AVG FAMILY SIZE
2.5
AVG HOUSEHOLD SIZE
6,240
LABOR FORCE [ PEOPLE ]
61.8%
PERCENT IN LABOR FORCE
5.8%
UNEMPLOYMENT RATE
Fostoria Zip Codes
Income in Fostoria
Income Overview in Fostoria
Per Capita Income in Fostoria is $26,669, while median incomes of families and households are $66,286 and $53,145 respectively.
| Characteristic | Number | Measure |
| Per Capita Income | 12,904 | $26,669 |
| Median Family Income | 3,036 | $66,286 |
| Mean Family Income | 3,036 | $77,809 |
| Median Household Income | 5,092 | $53,145 |
| Mean Household Income | 5,092 | $63,606 |
| Income Deficit | 3,036 | $12,827 |
| Wage / Income Gap (%) | 12,904 | 30.22% |
| Wage / Income Gap ($) | 12,904 | 69.78¢ per $1 |
| Gini / Inequality Index | 12,904 | 0.42 |
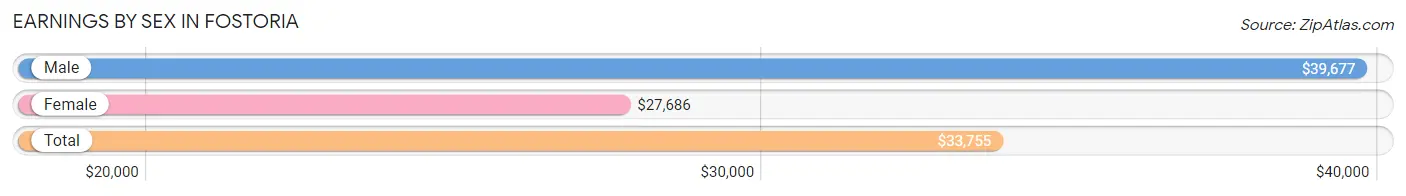
Earnings by Sex in Fostoria
Average Earnings in Fostoria are $33,755, $39,677 for men and $27,686 for women, a difference of 30.2%.
| Sex | Number | Average Earnings |
| Male | 3,406 (53.1%) | $39,677 |
| Female | 3,005 (46.9%) | $27,686 |
| Total | 6,411 (100.0%) | $33,755 |
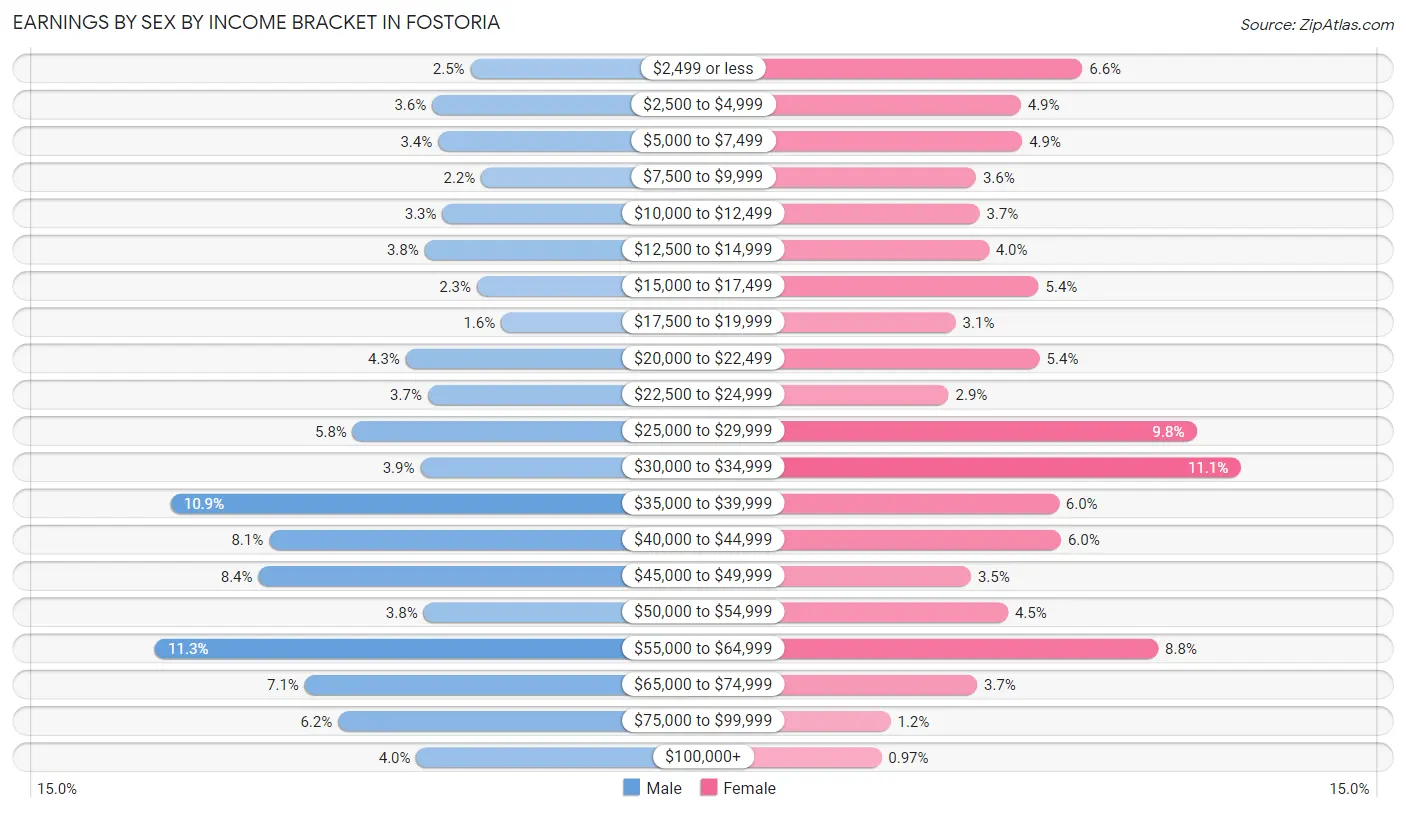
Earnings by Sex by Income Bracket in Fostoria
The most common earnings brackets in Fostoria are $55,000 to $64,999 for men (386 | 11.3%) and $30,000 to $34,999 for women (332 | 11.1%).
| Income | Male | Female |
| $2,499 or less | 84 (2.5%) | 199 (6.6%) |
| $2,500 to $4,999 | 121 (3.5%) | 147 (4.9%) |
| $5,000 to $7,499 | 115 (3.4%) | 148 (4.9%) |
| $7,500 to $9,999 | 74 (2.2%) | 109 (3.6%) |
| $10,000 to $12,499 | 111 (3.3%) | 112 (3.7%) |
| $12,500 to $14,999 | 128 (3.8%) | 120 (4.0%) |
| $15,000 to $17,499 | 78 (2.3%) | 162 (5.4%) |
| $17,500 to $19,999 | 55 (1.6%) | 92 (3.1%) |
| $20,000 to $22,499 | 146 (4.3%) | 163 (5.4%) |
| $22,500 to $24,999 | 125 (3.7%) | 86 (2.9%) |
| $25,000 to $29,999 | 197 (5.8%) | 295 (9.8%) |
| $30,000 to $34,999 | 132 (3.9%) | 332 (11.1%) |
| $35,000 to $39,999 | 371 (10.9%) | 179 (6.0%) |
| $40,000 to $44,999 | 277 (8.1%) | 181 (6.0%) |
| $45,000 to $49,999 | 287 (8.4%) | 105 (3.5%) |
| $50,000 to $54,999 | 129 (3.8%) | 136 (4.5%) |
| $55,000 to $64,999 | 386 (11.3%) | 263 (8.7%) |
| $65,000 to $74,999 | 243 (7.1%) | 110 (3.7%) |
| $75,000 to $99,999 | 211 (6.2%) | 37 (1.2%) |
| $100,000+ | 136 (4.0%) | 29 (1.0%) |
| Total | 3,406 (100.0%) | 3,005 (100.0%) |
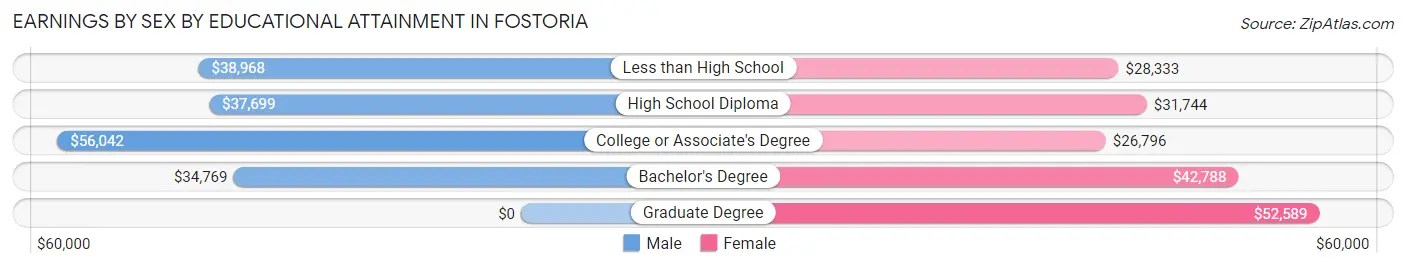
Earnings by Sex by Educational Attainment in Fostoria
Average earnings in Fostoria are $41,660 for men and $30,256 for women, a difference of 27.4%. Men with an educational attainment of college or associate's degree enjoy the highest average annual earnings of $56,042, while those with bachelor's degree education earn the least with $34,769. Women with an educational attainment of graduate degree earn the most with the average annual earnings of $52,589, while those with college or associate's degree education have the smallest earnings of $26,796.
| Educational Attainment | Male Income | Female Income |
| Less than High School | $38,968 | $28,333 |
| High School Diploma | $37,699 | $31,744 |
| College or Associate's Degree | $56,042 | $26,796 |
| Bachelor's Degree | $34,769 | $42,788 |
| Graduate Degree | - | - |
| Total | $41,660 | $30,256 |
Family Income in Fostoria
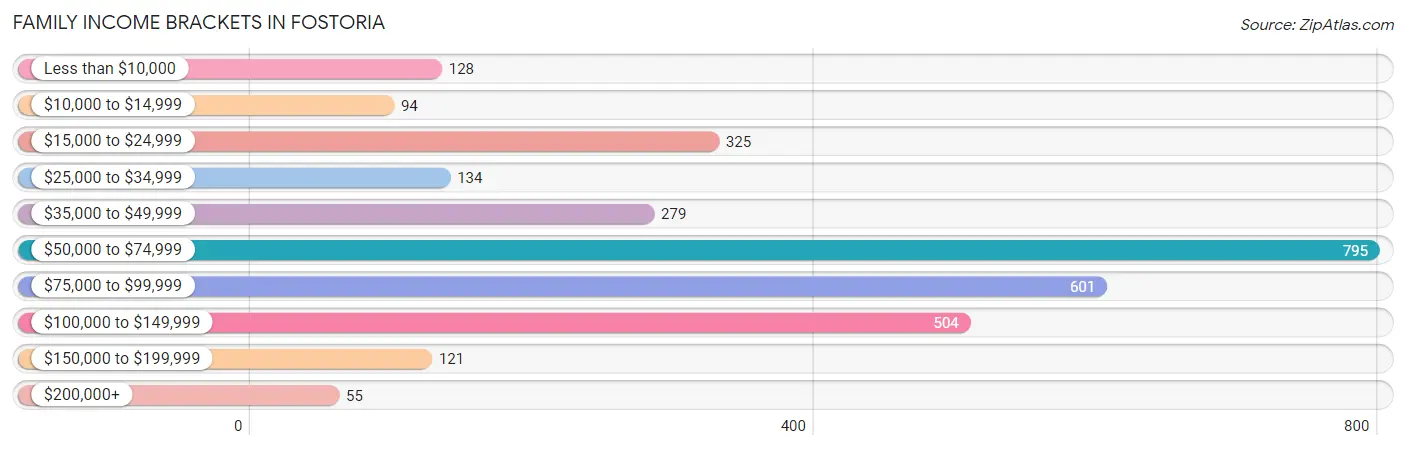
Family Income Brackets in Fostoria
According to the Fostoria family income data, there are 795 families falling into the $50,000 to $74,999 income range, which is the most common income bracket and makes up 26.2% of all families. Conversely, the $200,000+ income bracket is the least frequent group with only 55 families (1.8%) belonging to this category.
| Income Bracket | # Families | % Families |
| Less than $10,000 | 128 | 4.2% |
| $10,000 to $14,999 | 94 | 3.1% |
| $15,000 to $24,999 | 325 | 10.7% |
| $25,000 to $34,999 | 134 | 4.4% |
| $35,000 to $49,999 | 279 | 9.2% |
| $50,000 to $74,999 | 795 | 26.2% |
| $75,000 to $99,999 | 601 | 19.8% |
| $100,000 to $149,999 | 504 | 16.6% |
| $150,000 to $199,999 | 121 | 4.0% |
| $200,000+ | 55 | 1.8% |
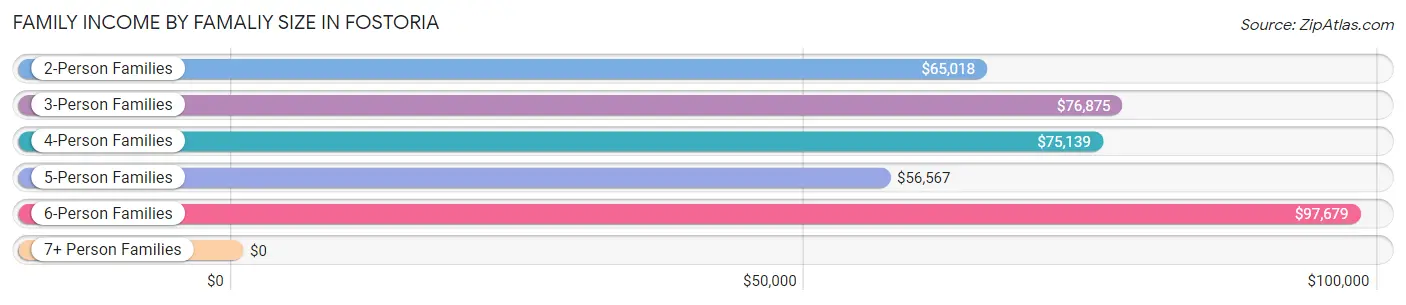
Family Income by Famaliy Size in Fostoria
6-person families (109 | 3.6%) account for the highest median family income in Fostoria with $97,679 per family, while 2-person families (1,431 | 47.1%) have the highest median income of $32,509 per family member.
| Income Bracket | # Families | Median Income |
| 2-Person Families | 1,431 (47.1%) | $65,018 |
| 3-Person Families | 673 (22.2%) | $76,875 |
| 4-Person Families | 553 (18.2%) | $75,139 |
| 5-Person Families | 265 (8.7%) | $56,567 |
| 6-Person Families | 109 (3.6%) | $97,679 |
| 7+ Person Families | 5 (0.2%) | $0 |
| Total | 3,036 (100.0%) | $66,286 |
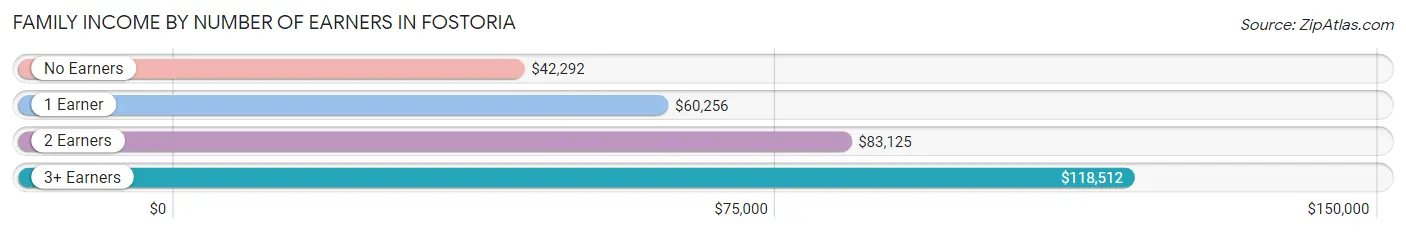
Family Income by Number of Earners in Fostoria
The median family income in Fostoria is $66,286, with families comprising 3+ earners (263) having the highest median family income of $118,512, while families with no earners (489) have the lowest median family income of $42,292, accounting for 8.7% and 16.1% of families, respectively.
| Number of Earners | # Families | Median Income |
| No Earners | 489 (16.1%) | $42,292 |
| 1 Earner | 1,314 (43.3%) | $60,256 |
| 2 Earners | 970 (32.0%) | $83,125 |
| 3+ Earners | 263 (8.7%) | $118,512 |
| Total | 3,036 (100.0%) | $66,286 |
Household Income in Fostoria
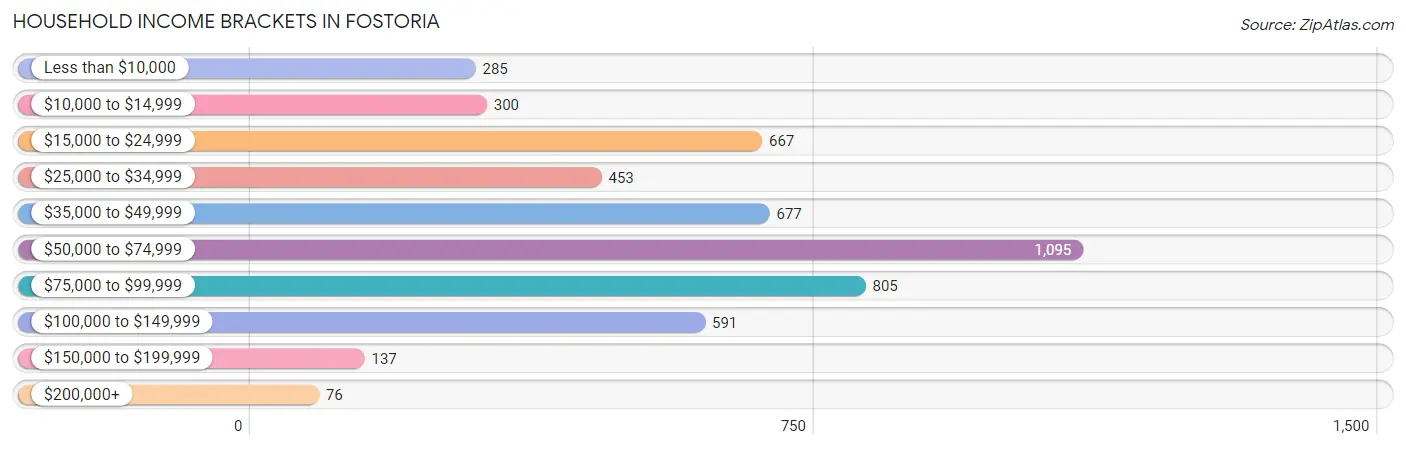
Household Income Brackets in Fostoria
With 1,095 households falling in the category, the $50,000 to $74,999 income range is the most frequent in Fostoria, accounting for 21.5% of all households. In contrast, only 76 households (1.5%) fall into the $200,000+ income bracket, making it the least populous group.
| Income Bracket | # Households | % Households |
| Less than $10,000 | 285 | 5.6% |
| $10,000 to $14,999 | 300 | 5.9% |
| $15,000 to $24,999 | 667 | 13.1% |
| $25,000 to $34,999 | 453 | 8.9% |
| $35,000 to $49,999 | 677 | 13.3% |
| $50,000 to $74,999 | 1,095 | 21.5% |
| $75,000 to $99,999 | 805 | 15.8% |
| $100,000 to $149,999 | 591 | 11.6% |
| $150,000 to $199,999 | 137 | 2.7% |
| $200,000+ | 76 | 1.5% |
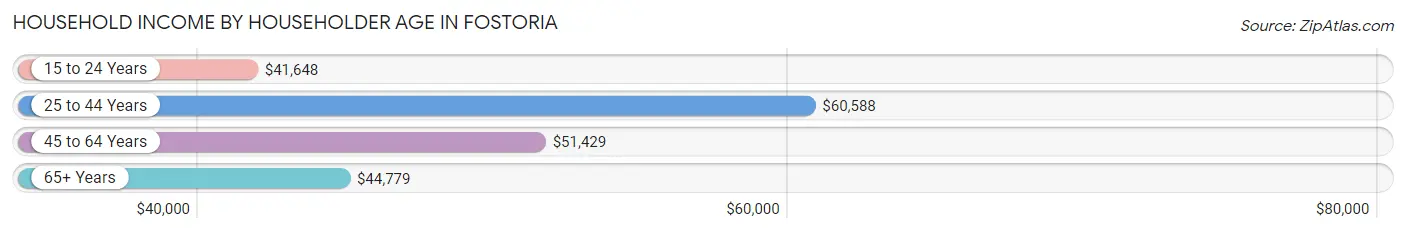
Household Income by Householder Age in Fostoria
The median household income in Fostoria is $53,145, with the highest median household income of $60,588 found in the 25 to 44 years age bracket for the primary householder. A total of 1,482 households (29.1%) fall into this category. Meanwhile, the 15 to 24 years age bracket for the primary householder has the lowest median household income of $41,648, with 413 households (8.1%) in this group.
| Income Bracket | # Households | Median Income |
| 15 to 24 Years | 413 (8.1%) | $41,648 |
| 25 to 44 Years | 1,482 (29.1%) | $60,588 |
| 45 to 64 Years | 1,930 (37.9%) | $51,429 |
| 65+ Years | 1,267 (24.9%) | $44,779 |
| Total | 5,092 (100.0%) | $53,145 |
Poverty in Fostoria
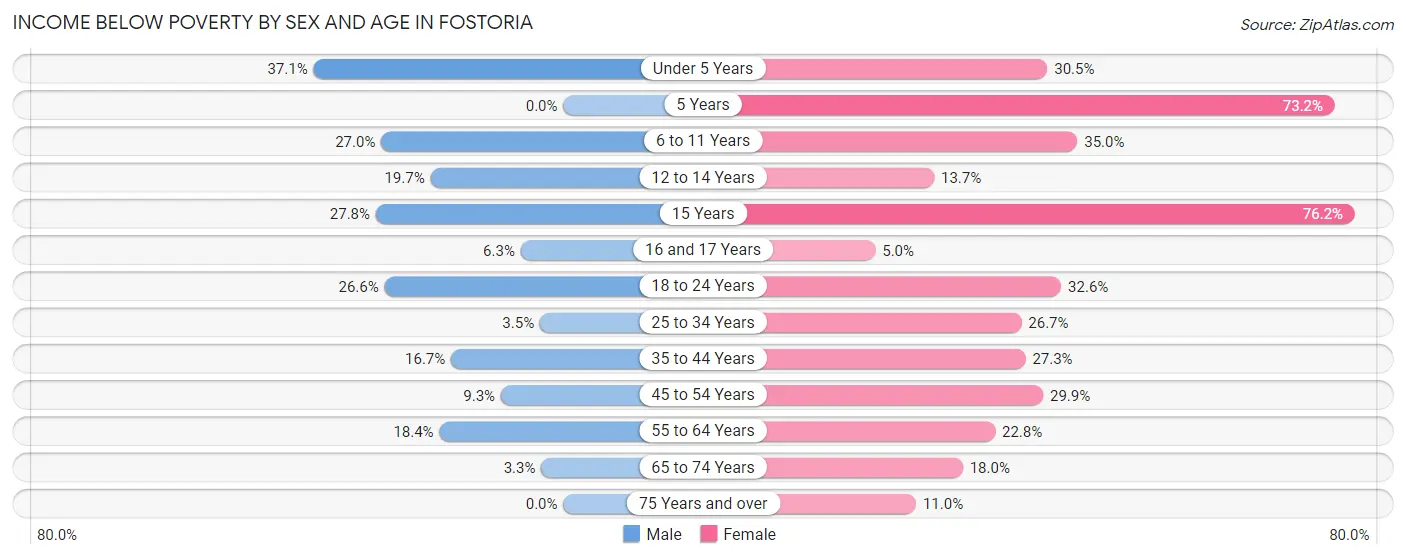
Income Below Poverty by Sex and Age in Fostoria
With 15.6% poverty level for males and 26.4% for females among the residents of Fostoria, under 5 year old males and 15 year old females are the most vulnerable to poverty, with 184 males (37.1%) and 96 females (76.2%) in their respective age groups living below the poverty level.
| Age Bracket | Male | Female |
| Under 5 Years | 184 (37.1%) | 181 (30.5%) |
| 5 Years | 0 (0.0%) | 41 (73.2%) |
| 6 to 11 Years | 139 (27.0%) | 121 (35.0%) |
| 12 to 14 Years | 44 (19.7%) | 30 (13.7%) |
| 15 Years | 27 (27.8%) | 96 (76.2%) |
| 16 and 17 Years | 14 (6.3%) | 9 (5.0%) |
| 18 to 24 Years | 171 (26.6%) | 200 (32.6%) |
| 25 to 34 Years | 28 (3.5%) | 237 (26.7%) |
| 35 to 44 Years | 121 (16.7%) | 165 (27.3%) |
| 45 to 54 Years | 56 (9.3%) | 202 (29.9%) |
| 55 to 64 Years | 170 (18.4%) | 229 (22.8%) |
| 65 to 74 Years | 20 (3.3%) | 111 (18.0%) |
| 75 Years and over | 0 (0.0%) | 40 (11.0%) |
| Total | 974 (15.6%) | 1,662 (26.4%) |
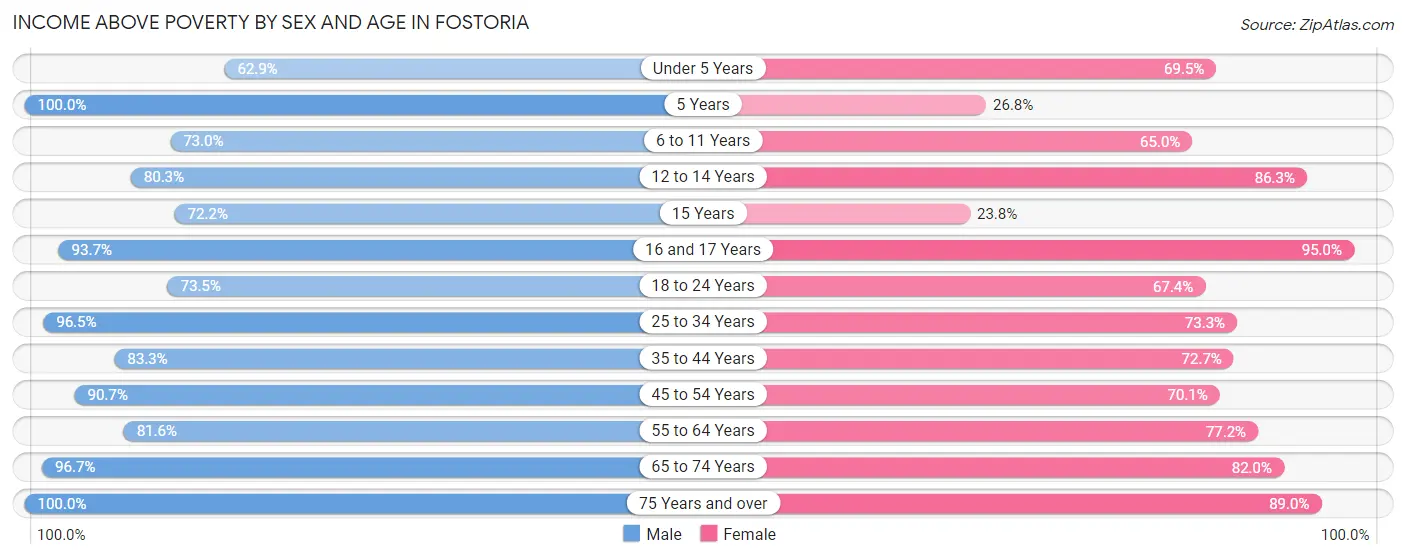
Income Above Poverty by Sex and Age in Fostoria
According to the poverty statistics in Fostoria, males aged 5 years and females aged 16 and 17 years are the age groups that are most secure financially, with 100.0% of males and 95.0% of females in these age groups living above the poverty line.
| Age Bracket | Male | Female |
| Under 5 Years | 312 (62.9%) | 412 (69.5%) |
| 5 Years | 87 (100.0%) | 15 (26.8%) |
| 6 to 11 Years | 375 (73.0%) | 225 (65.0%) |
| 12 to 14 Years | 179 (80.3%) | 189 (86.3%) |
| 15 Years | 70 (72.2%) | 30 (23.8%) |
| 16 and 17 Years | 207 (93.7%) | 172 (95.0%) |
| 18 to 24 Years | 473 (73.5%) | 414 (67.4%) |
| 25 to 34 Years | 780 (96.5%) | 652 (73.3%) |
| 35 to 44 Years | 605 (83.3%) | 440 (72.7%) |
| 45 to 54 Years | 548 (90.7%) | 474 (70.1%) |
| 55 to 64 Years | 754 (81.6%) | 777 (77.2%) |
| 65 to 74 Years | 591 (96.7%) | 507 (82.0%) |
| 75 Years and over | 288 (100.0%) | 323 (89.0%) |
| Total | 5,269 (84.4%) | 4,630 (73.6%) |
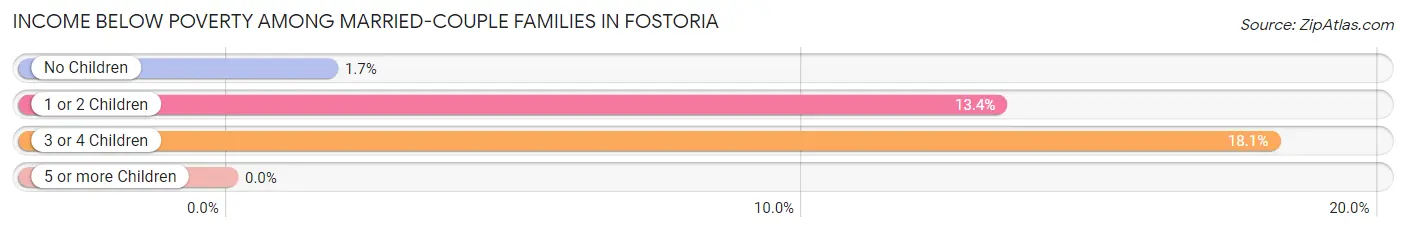
Income Below Poverty Among Married-Couple Families in Fostoria
The poverty statistics for married-couple families in Fostoria show that 7.6% or 144 of the total 1,895 families live below the poverty line. Families with 3 or 4 children have the highest poverty rate of 18.1%, comprising of 41 families. On the other hand, families with no children have the lowest poverty rate of 1.7%, which includes 18 families.
| Children | Above Poverty | Below Poverty |
| No Children | 1,016 (98.3%) | 18 (1.7%) |
| 1 or 2 Children | 550 (86.6%) | 85 (13.4%) |
| 3 or 4 Children | 185 (81.9%) | 41 (18.1%) |
| 5 or more Children | 0 (0.0%) | 0 (0.0%) |
| Total | 1,751 (92.4%) | 144 (7.6%) |
Income Below Poverty Among Single-Parent Households in Fostoria
According to the poverty data in Fostoria, 22.0% or 77 single-father households and 32.4% or 256 single-mother households are living below the poverty line. Among single-father households, those with 1 or 2 children have the highest poverty rate, with 77 households (31.7%) experiencing poverty. Likewise, among single-mother households, those with 3 or 4 children have the highest poverty rate, with 120 households (74.5%) falling below the poverty line.
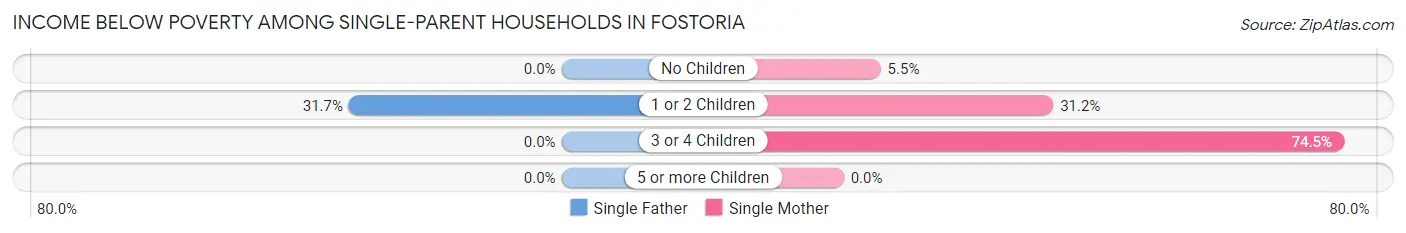
| Children | Single Father | Single Mother |
| No Children | 0 (0.0%) | 13 (5.5%) |
| 1 or 2 Children | 77 (31.7%) | 123 (31.2%) |
| 3 or 4 Children | 0 (0.0%) | 120 (74.5%) |
| 5 or more Children | 0 (0.0%) | 0 (0.0%) |
| Total | 77 (22.0%) | 256 (32.4%) |
Income Below Poverty Among Married-Couple vs Single-Parent Households in Fostoria
The poverty data for Fostoria shows that 144 of the married-couple family households (7.6%) and 333 of the single-parent households (29.2%) are living below the poverty level. Within the married-couple family households, those with 3 or 4 children have the highest poverty rate, with 41 households (18.1%) falling below the poverty line. Among the single-parent households, those with 3 or 4 children have the highest poverty rate, with 120 household (69.4%) living below poverty.
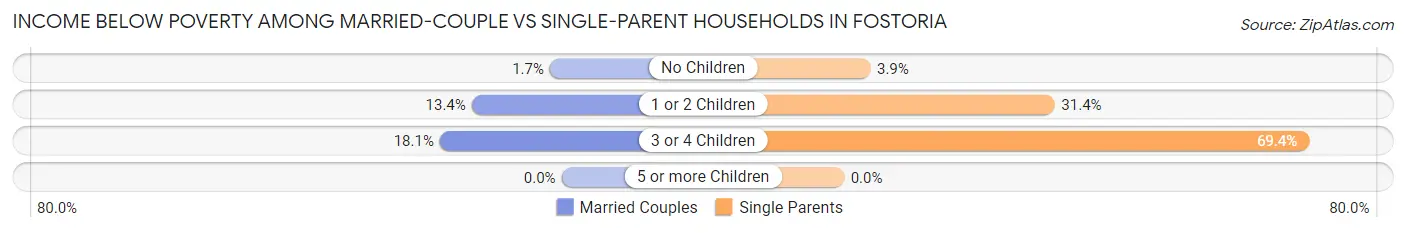
| Children | Married-Couple Families | Single-Parent Households |
| No Children | 18 (1.7%) | 13 (3.9%) |
| 1 or 2 Children | 85 (13.4%) | 200 (31.4%) |
| 3 or 4 Children | 41 (18.1%) | 120 (69.4%) |
| 5 or more Children | 0 (0.0%) | 0 (0.0%) |
| Total | 144 (7.6%) | 333 (29.2%) |
Race in Fostoria
The most populous races in Fostoria are White / Caucasian (10,609 | 82.2%), Hispanic or Latino (1,743 | 13.5%), and Two or more Races (786 | 6.1%).
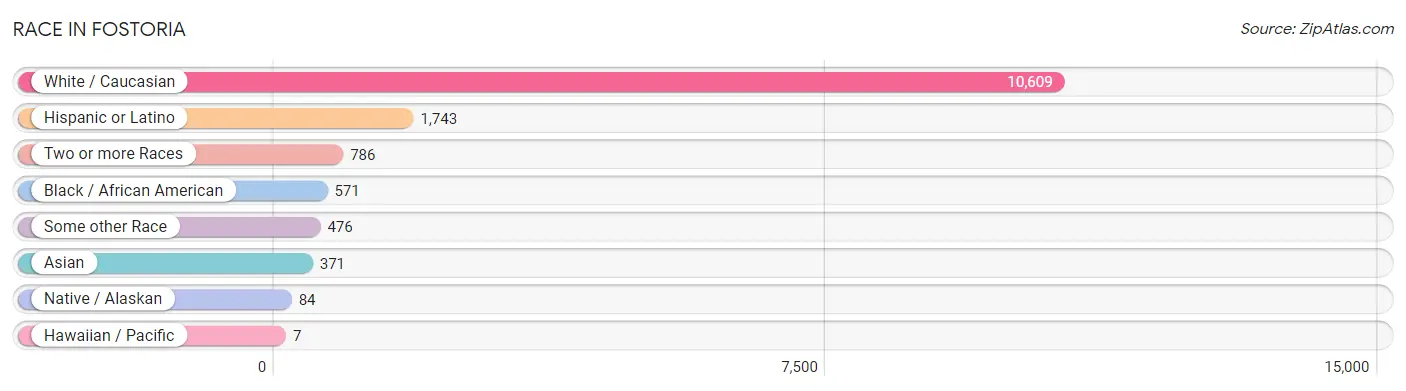
| Race | # Population | % Population |
| Asian | 371 | 2.9% |
| Black / African American | 571 | 4.4% |
| Hawaiian / Pacific | 7 | 0.1% |
| Hispanic or Latino | 1,743 | 13.5% |
| Native / Alaskan | 84 | 0.6% |
| White / Caucasian | 10,609 | 82.2% |
| Two or more Races | 786 | 6.1% |
| Some other Race | 476 | 3.7% |
| Total | 12,904 | 100.0% |
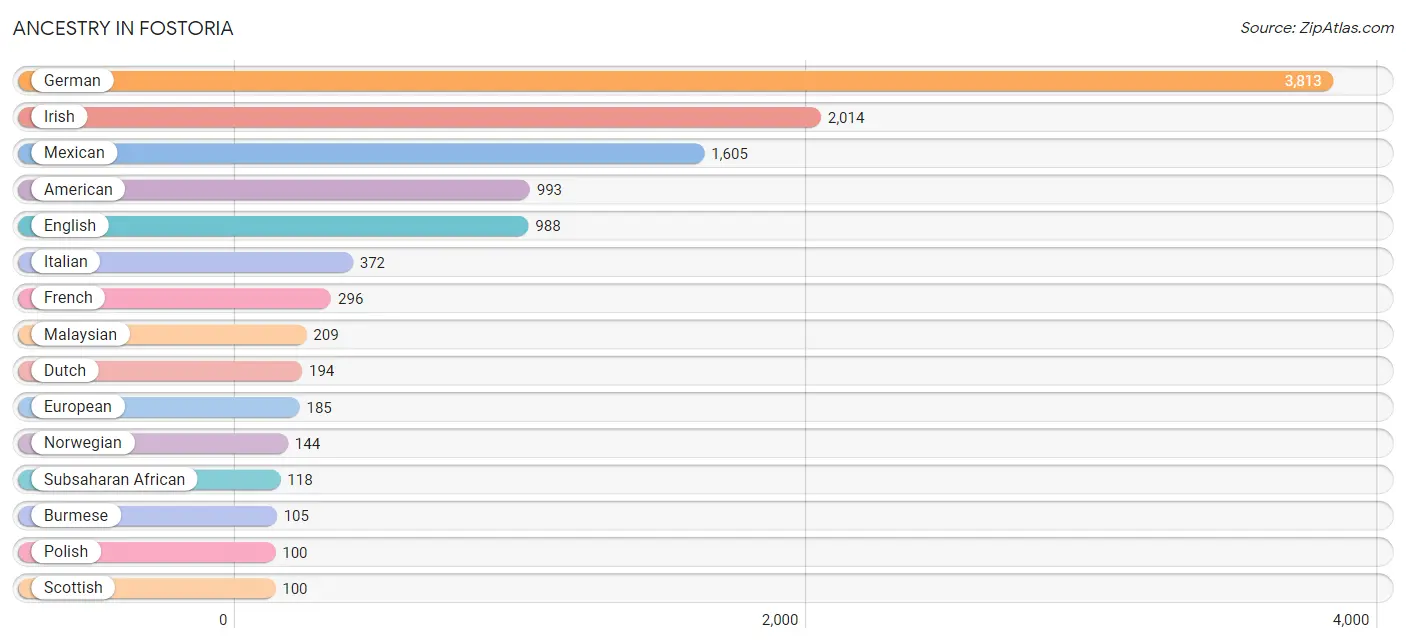
Ancestry in Fostoria
The most populous ancestries reported in Fostoria are German (3,813 | 29.5%), Irish (2,014 | 15.6%), Mexican (1,605 | 12.4%), American (993 | 7.7%), and English (988 | 7.7%), together accounting for 73.0% of all Fostoria residents.
| Ancestry | # Population | % Population |
| African | 35 | 0.3% |
| Alsatian | 15 | 0.1% |
| American | 993 | 7.7% |
| Apache | 62 | 0.5% |
| Arab | 59 | 0.5% |
| Australian | 1 | 0.0% |
| Belgian | 34 | 0.3% |
| Blackfeet | 25 | 0.2% |
| British | 42 | 0.3% |
| Burmese | 105 | 0.8% |
| Central American | 57 | 0.4% |
| Cherokee | 28 | 0.2% |
| Croatian | 10 | 0.1% |
| Czechoslovakian | 9 | 0.1% |
| Dutch | 194 | 1.5% |
| Eastern European | 13 | 0.1% |
| English | 988 | 7.7% |
| European | 185 | 1.4% |
| French | 296 | 2.3% |
| French Canadian | 29 | 0.2% |
| German | 3,813 | 29.5% |
| German Russian | 70 | 0.5% |
| Greek | 16 | 0.1% |
| Hungarian | 25 | 0.2% |
| Icelander | 10 | 0.1% |
| Indian (Asian) | 24 | 0.2% |
| Irish | 2,014 | 15.6% |
| Italian | 372 | 2.9% |
| Korean | 12 | 0.1% |
| Luxembourger | 19 | 0.2% |
| Malaysian | 209 | 1.6% |
| Mexican | 1,605 | 12.4% |
| Nigerian | 83 | 0.6% |
| Norwegian | 144 | 1.1% |
| Palestinian | 53 | 0.4% |
| Pennsylvania German | 17 | 0.1% |
| Polish | 100 | 0.8% |
| Puerto Rican | 11 | 0.1% |
| Russian | 53 | 0.4% |
| Salvadoran | 57 | 0.4% |
| Scandinavian | 14 | 0.1% |
| Scotch-Irish | 77 | 0.6% |
| Scottish | 100 | 0.8% |
| Slavic | 30 | 0.2% |
| Spaniard | 51 | 0.4% |
| Subsaharan African | 118 | 0.9% |
| Swiss | 30 | 0.2% |
| Thai | 31 | 0.2% |
| Welsh | 83 | 0.6% |
| Yugoslavian | 9 | 0.1% | View All 50 Rows |
Immigrants in Fostoria
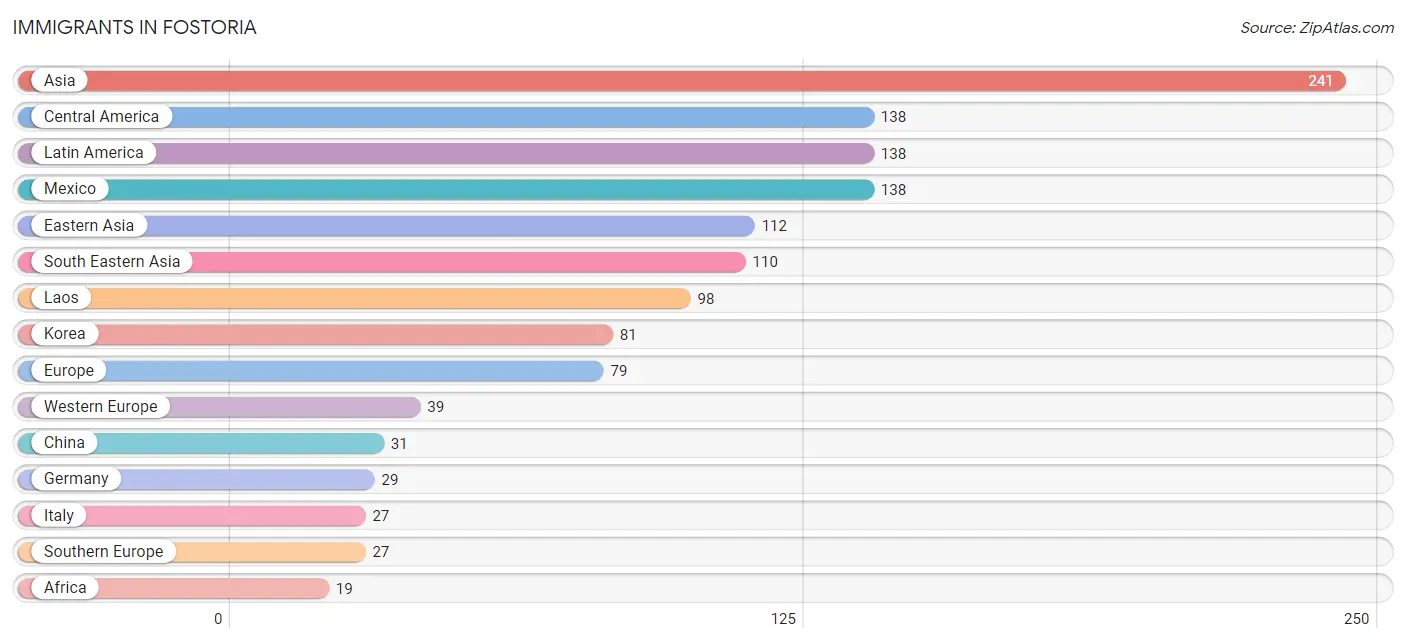
The most numerous immigrant groups reported in Fostoria came from Asia (241 | 1.9%), Central America (138 | 1.1%), Latin America (138 | 1.1%), Mexico (138 | 1.1%), and Eastern Asia (112 | 0.9%), together accounting for 6.0% of all Fostoria residents.
| Immigration Origin | # Population | % Population |
| Africa | 19 | 0.2% |
| Asia | 241 | 1.9% |
| Canada | 18 | 0.1% |
| Central America | 138 | 1.1% |
| China | 31 | 0.2% |
| Eastern Asia | 112 | 0.9% |
| Eastern Europe | 13 | 0.1% |
| Europe | 79 | 0.6% |
| France | 10 | 0.1% |
| Germany | 29 | 0.2% |
| India | 19 | 0.2% |
| Italy | 27 | 0.2% |
| Korea | 81 | 0.6% |
| Laos | 98 | 0.8% |
| Latin America | 138 | 1.1% |
| Mexico | 138 | 1.1% |
| Philippines | 12 | 0.1% |
| Senegal | 19 | 0.2% |
| South Central Asia | 19 | 0.2% |
| South Eastern Asia | 110 | 0.9% |
| Southern Europe | 27 | 0.2% |
| Western Africa | 19 | 0.2% |
| Western Europe | 39 | 0.3% | View All 23 Rows |
Sex and Age in Fostoria
Sex and Age in Fostoria
The most populous age groups in Fostoria are 20 to 24 Years (600 | 9.5%) for men and Under 5 Years (606 | 9.2%) for women.
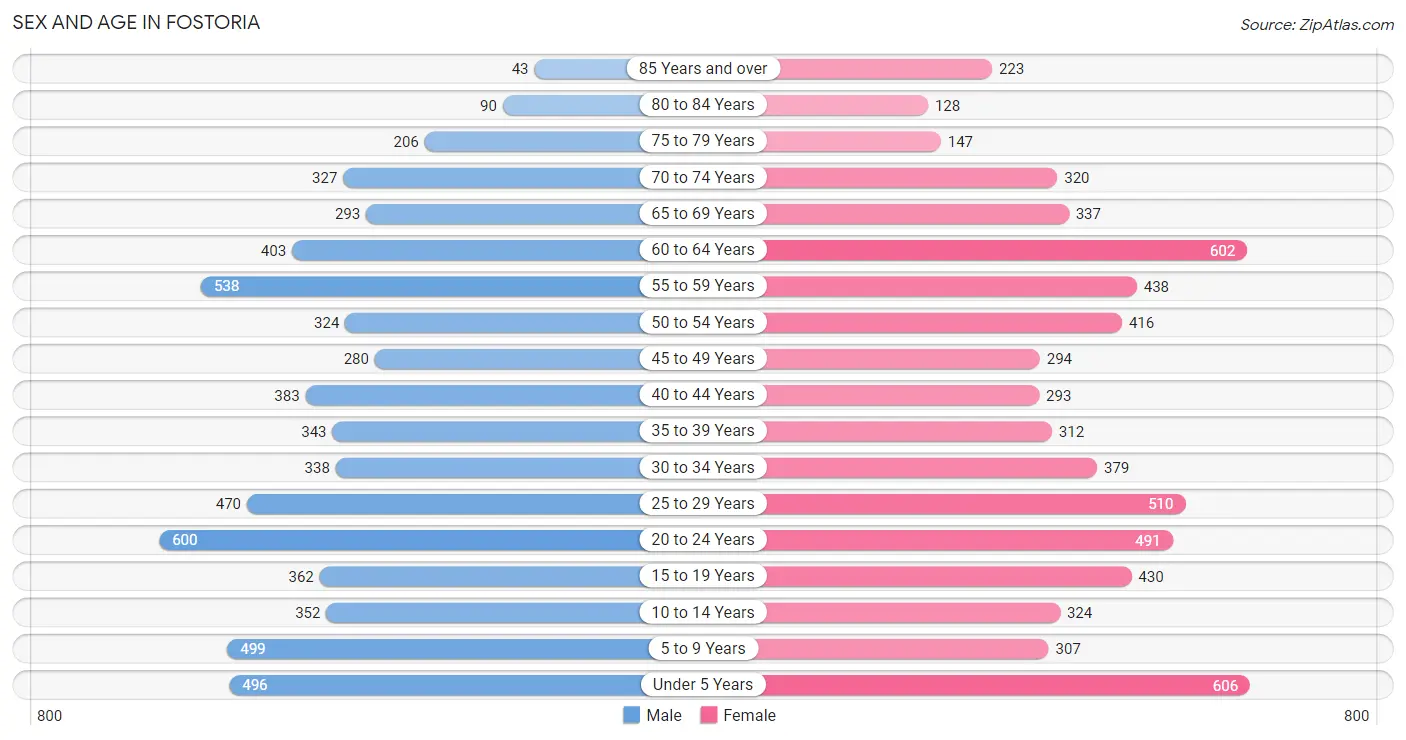
| Age Bracket | Male | Female |
| Under 5 Years | 496 (7.8%) | 606 (9.2%) |
| 5 to 9 Years | 499 (7.9%) | 307 (4.7%) |
| 10 to 14 Years | 352 (5.6%) | 324 (4.9%) |
| 15 to 19 Years | 362 (5.7%) | 430 (6.6%) |
| 20 to 24 Years | 600 (9.5%) | 491 (7.5%) |
| 25 to 29 Years | 470 (7.4%) | 510 (7.8%) |
| 30 to 34 Years | 338 (5.3%) | 379 (5.8%) |
| 35 to 39 Years | 343 (5.4%) | 312 (4.8%) |
| 40 to 44 Years | 383 (6.0%) | 293 (4.5%) |
| 45 to 49 Years | 280 (4.4%) | 294 (4.5%) |
| 50 to 54 Years | 324 (5.1%) | 416 (6.3%) |
| 55 to 59 Years | 538 (8.5%) | 438 (6.7%) |
| 60 to 64 Years | 403 (6.4%) | 602 (9.2%) |
| 65 to 69 Years | 293 (4.6%) | 337 (5.1%) |
| 70 to 74 Years | 327 (5.1%) | 320 (4.9%) |
| 75 to 79 Years | 206 (3.3%) | 147 (2.2%) |
| 80 to 84 Years | 90 (1.4%) | 128 (1.9%) |
| 85 Years and over | 43 (0.7%) | 223 (3.4%) |
| Total | 6,347 (100.0%) | 6,557 (100.0%) |
Families and Households in Fostoria
Median Family Size in Fostoria
The median family size in Fostoria is 3.13 persons per family, with married-couple families (1,895 | 62.4%) accounting for the largest median family size of 3.33 persons per family. On the other hand, single male/father families (350 | 11.5%) represent the smallest median family size with 2.62 persons per family.
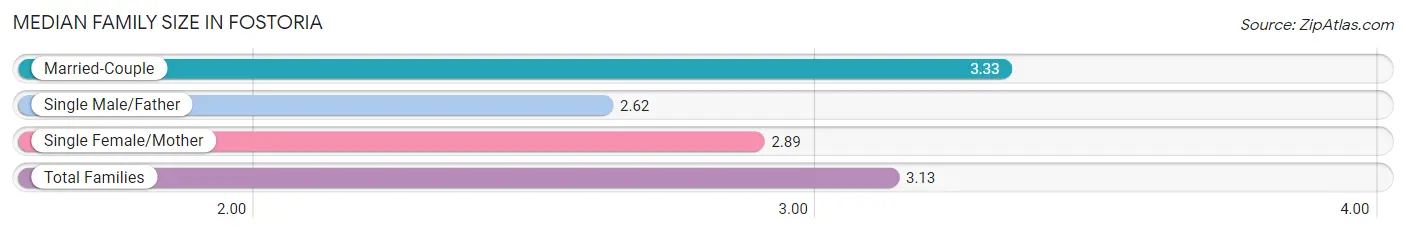
| Family Type | # Families | Family Size |
| Married-Couple | 1,895 (62.4%) | 3.33 |
| Single Male/Father | 350 (11.5%) | 2.62 |
| Single Female/Mother | 791 (26.1%) | 2.89 |
| Total Families | 3,036 (100.0%) | 3.13 |
Median Household Size in Fostoria
The median household size in Fostoria is 2.47 persons per household, with single male/father households (350 | 6.9%) accounting for the largest median household size of 3.34 persons per household. non-family households (2,056 | 40.4%) represent the smallest median household size with 1.24 persons per household.
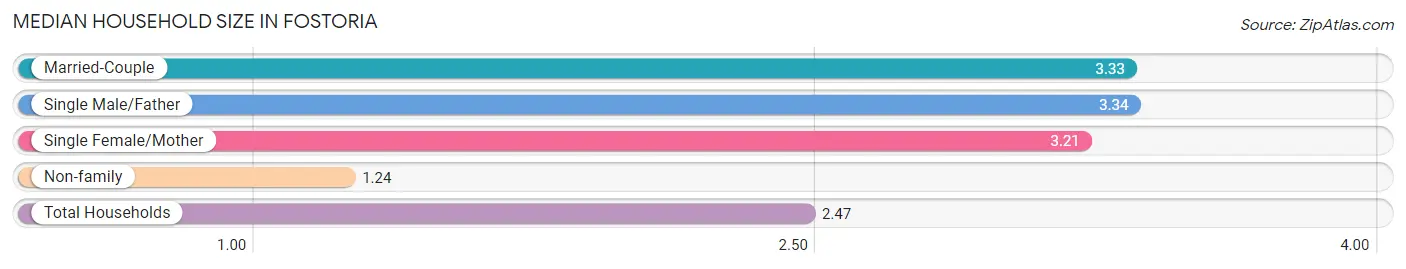
| Household Type | # Households | Household Size |
| Married-Couple | 1,895 (37.2%) | 3.33 |
| Single Male/Father | 350 (6.9%) | 3.34 |
| Single Female/Mother | 791 (15.5%) | 3.21 |
| Non-family | 2,056 (40.4%) | 1.24 |
| Total Households | 5,092 (100.0%) | 2.47 |
Household Size by Marriage Status in Fostoria
Out of a total of 5,092 households in Fostoria, 3,036 (59.6%) are family households, while 2,056 (40.4%) are nonfamily households. The most numerous type of family households are 2-person households, comprising 1,298, and the most common type of nonfamily households are 1-person households, comprising 1,592.
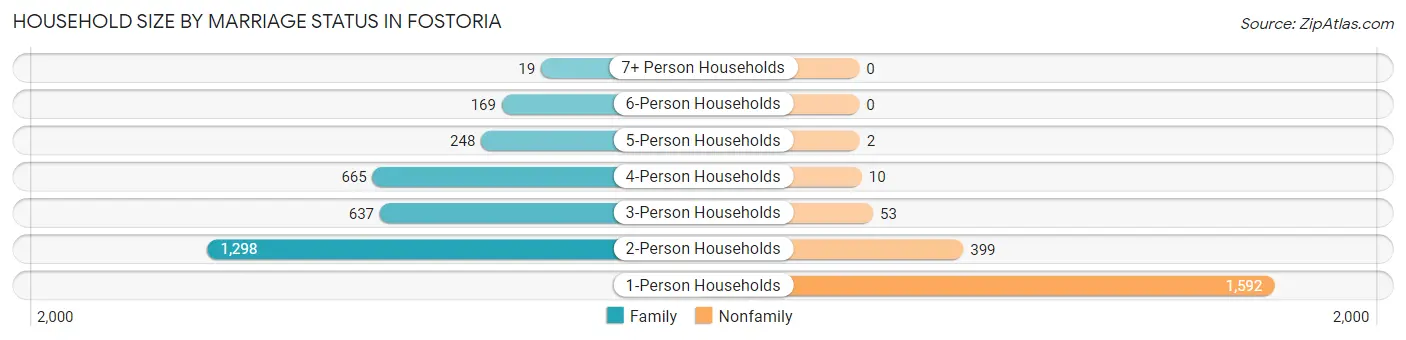
| Household Size | Family Households | Nonfamily Households |
| 1-Person Households | - | 1,592 (31.3%) |
| 2-Person Households | 1,298 (25.5%) | 399 (7.8%) |
| 3-Person Households | 637 (12.5%) | 53 (1.0%) |
| 4-Person Households | 665 (13.1%) | 10 (0.2%) |
| 5-Person Households | 248 (4.9%) | 2 (0.0%) |
| 6-Person Households | 169 (3.3%) | 0 (0.0%) |
| 7+ Person Households | 19 (0.4%) | 0 (0.0%) |
| Total | 3,036 (59.6%) | 2,056 (40.4%) |
Female Fertility in Fostoria
Fertility by Age in Fostoria
Average fertility rate in Fostoria is 65.0 births per 1,000 women. Women in the age bracket of 20 to 34 years have the highest fertility rate with 122.0 births per 1,000 women. Women in the age bracket of 20 to 34 years acount for 91.3% of all women with births.
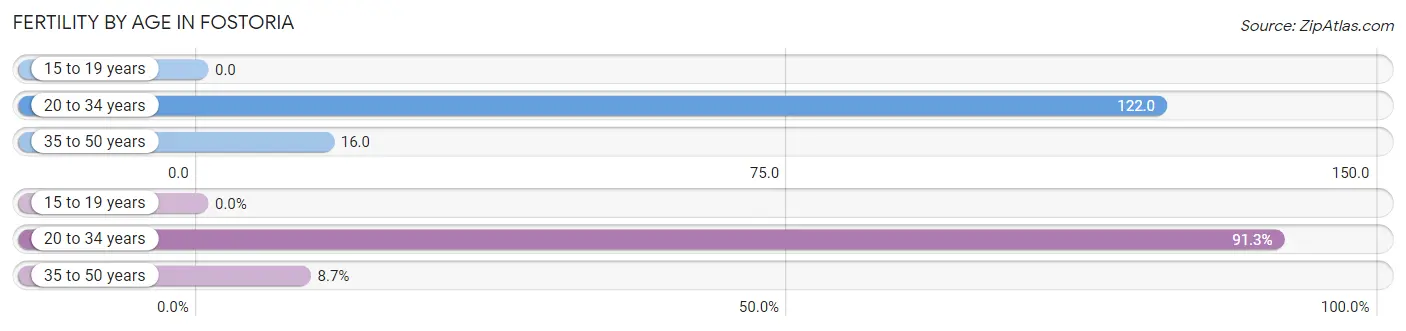
| Age Bracket | Women with Births | Births / 1,000 Women |
| 15 to 19 years | 0 (0.0%) | 0.0 |
| 20 to 34 years | 168 (91.3%) | 122.0 |
| 35 to 50 years | 16 (8.7%) | 16.0 |
| Total | 184 (100.0%) | 65.0 |
Fertility by Age by Marriage Status in Fostoria
77.7% of women with births (184) in Fostoria are married. The highest percentage of unmarried women with births falls into 20 to 34 years age bracket with 24.4% of them unmarried at the time of birth, while the lowest percentage of unmarried women with births belong to 35 to 50 years age bracket with 0.0% of them unmarried.
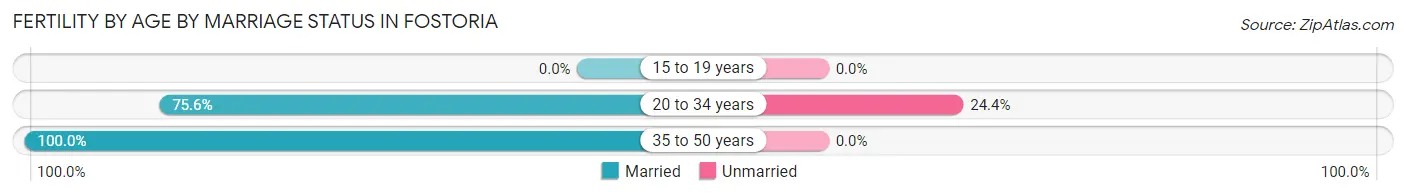
| Age Bracket | Married | Unmarried |
| 15 to 19 years | 0 (0.0%) | 0 (0.0%) |
| 20 to 34 years | 127 (75.6%) | 41 (24.4%) |
| 35 to 50 years | 16 (100.0%) | 0 (0.0%) |
| Total | 143 (77.7%) | 41 (22.3%) |
Fertility by Education in Fostoria
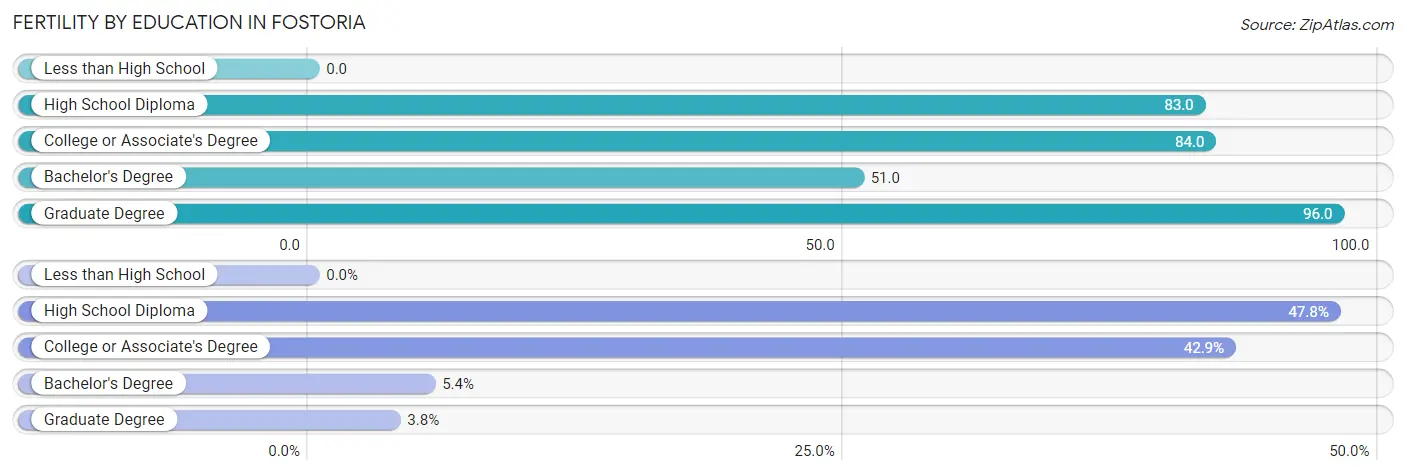
| Educational Attainment | Women with Births | Births / 1,000 Women |
| Less than High School | 0 (0.0%) | 0.0 |
| High School Diploma | 88 (47.8%) | 83.0 |
| College or Associate's Degree | 79 (42.9%) | 84.0 |
| Bachelor's Degree | 10 (5.4%) | 51.0 |
| Graduate Degree | 7 (3.8%) | 96.0 |
| Total | 184 (100.0%) | 65.0 |
Fertility by Education by Marriage Status in Fostoria
22.3% of women with births in Fostoria are unmarried. Women with the educational attainment of graduate degree are most likely to be married with 100.0% of them married at childbirth, while women with the educational attainment of bachelor's degree are least likely to be married with 100.0% of them unmarried at childbirth.
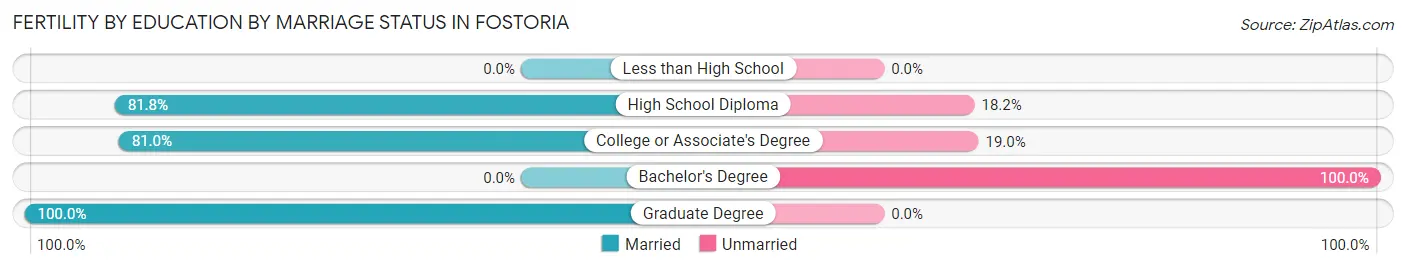
| Educational Attainment | Married | Unmarried |
| Less than High School | 0 (0.0%) | 0 (0.0%) |
| High School Diploma | 72 (81.8%) | 16 (18.2%) |
| College or Associate's Degree | 64 (81.0%) | 15 (19.0%) |
| Bachelor's Degree | 0 (0.0%) | 10 (100.0%) |
| Graduate Degree | 7 (100.0%) | 0 (0.0%) |
| Total | 143 (77.7%) | 41 (22.3%) |
Employment Characteristics in Fostoria
Employment by Class of Employer in Fostoria
Among the 5,687 employed individuals in Fostoria, private company employees (4,445 | 78.2%), not-for-profit organizations (433 | 7.6%), and local government employees (304 | 5.3%) make up the most common classes of employment.
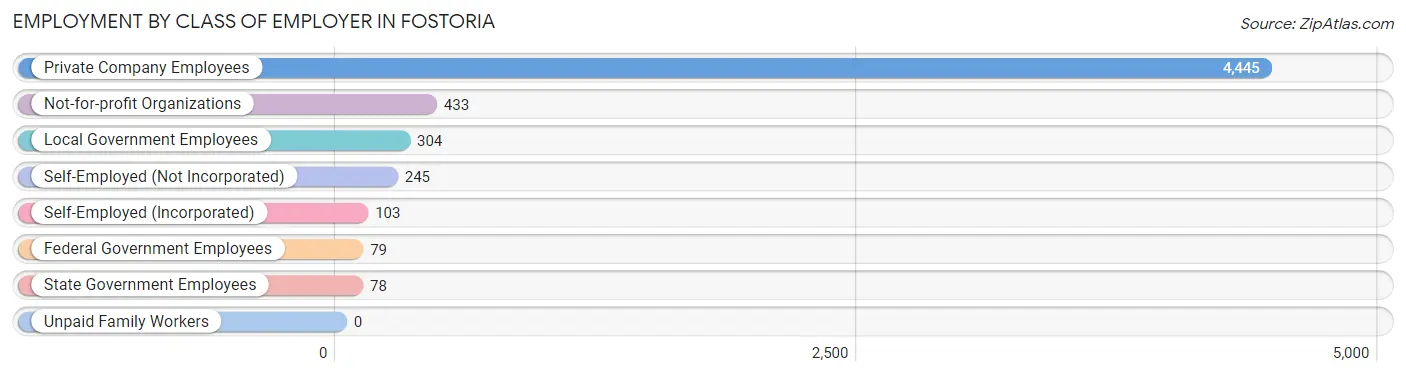
| Employer Class | # Employees | % Employees |
| Private Company Employees | 4,445 | 78.2% |
| Self-Employed (Incorporated) | 103 | 1.8% |
| Self-Employed (Not Incorporated) | 245 | 4.3% |
| Not-for-profit Organizations | 433 | 7.6% |
| Local Government Employees | 304 | 5.3% |
| State Government Employees | 78 | 1.4% |
| Federal Government Employees | 79 | 1.4% |
| Unpaid Family Workers | 0 | 0.0% |
| Total | 5,687 | 100.0% |
Employment Status by Age in Fostoria
According to the labor force statistics for Fostoria, out of the total population over 16 years of age (10,097), 61.8% or 6,240 individuals are in the labor force, with 5.8% or 362 of them unemployed. The age group with the highest labor force participation rate is 30 to 34 years, with 95.7% or 686 individuals in the labor force. Within the labor force, the 20 to 24 years age range has the highest percentage of unemployed individuals, with 13.2% or 115 of them being unemployed.
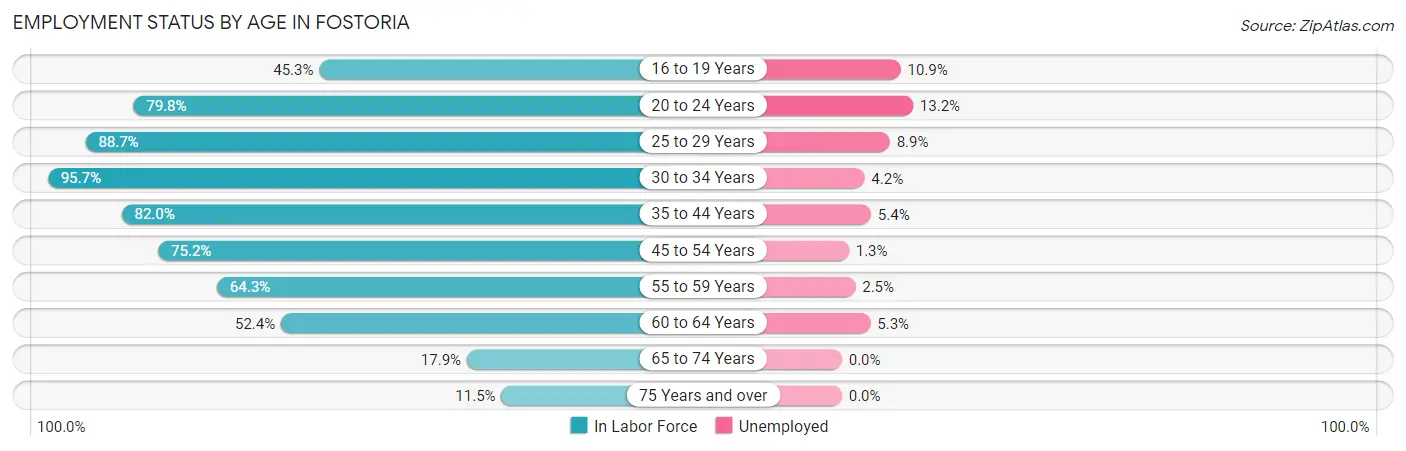
| Age Bracket | In Labor Force | Unemployed |
| 16 to 19 Years | 258 (45.3%) | 28 (10.9%) |
| 20 to 24 Years | 871 (79.8%) | 115 (13.2%) |
| 25 to 29 Years | 869 (88.7%) | 77 (8.9%) |
| 30 to 34 Years | 686 (95.7%) | 29 (4.2%) |
| 35 to 44 Years | 1,091 (82.0%) | 59 (5.4%) |
| 45 to 54 Years | 988 (75.2%) | 13 (1.3%) |
| 55 to 59 Years | 628 (64.3%) | 16 (2.5%) |
| 60 to 64 Years | 527 (52.4%) | 28 (5.3%) |
| 65 to 74 Years | 229 (17.9%) | 0 (0.0%) |
| 75 Years and over | 96 (11.5%) | 0 (0.0%) |
| Total | 6,240 (61.8%) | 362 (5.8%) |
Employment Status by Educational Attainment in Fostoria
According to labor force statistics for Fostoria, 75.8% of individuals (4,793) out of the total population between 25 and 64 years of age (6,323) are in the labor force, with 4.6% or 220 of them being unemployed. The group with the highest labor force participation rate are those with the educational attainment of bachelor's degree or higher, with 89.6% or 563 individuals in the labor force. Within the labor force, individuals with bachelor's degree or higher education have the highest percentage of unemployment, with 9.1% or 51 of them being unemployed.
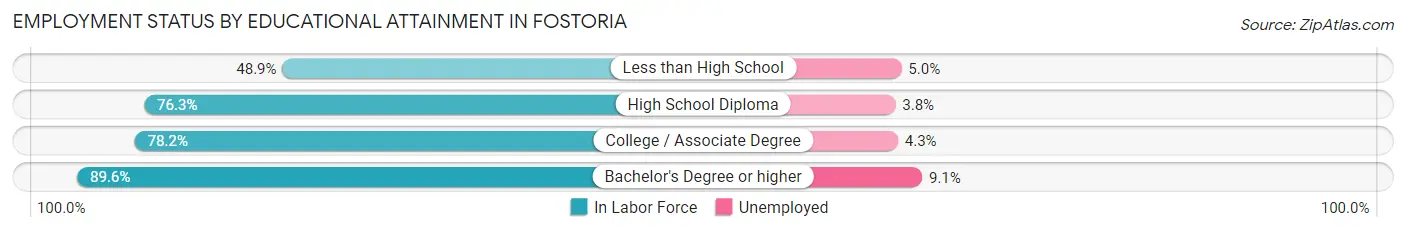
| Educational Attainment | In Labor Force | Unemployed |
| Less than High School | 279 (48.9%) | 29 (5.0%) |
| High School Diploma | 2,410 (76.3%) | 120 (3.8%) |
| College / Associate Degree | 1,537 (78.2%) | 85 (4.3%) |
| Bachelor's Degree or higher | 563 (89.6%) | 57 (9.1%) |
| Total | 4,793 (75.8%) | 291 (4.6%) |
Employment Occupations by Sex in Fostoria
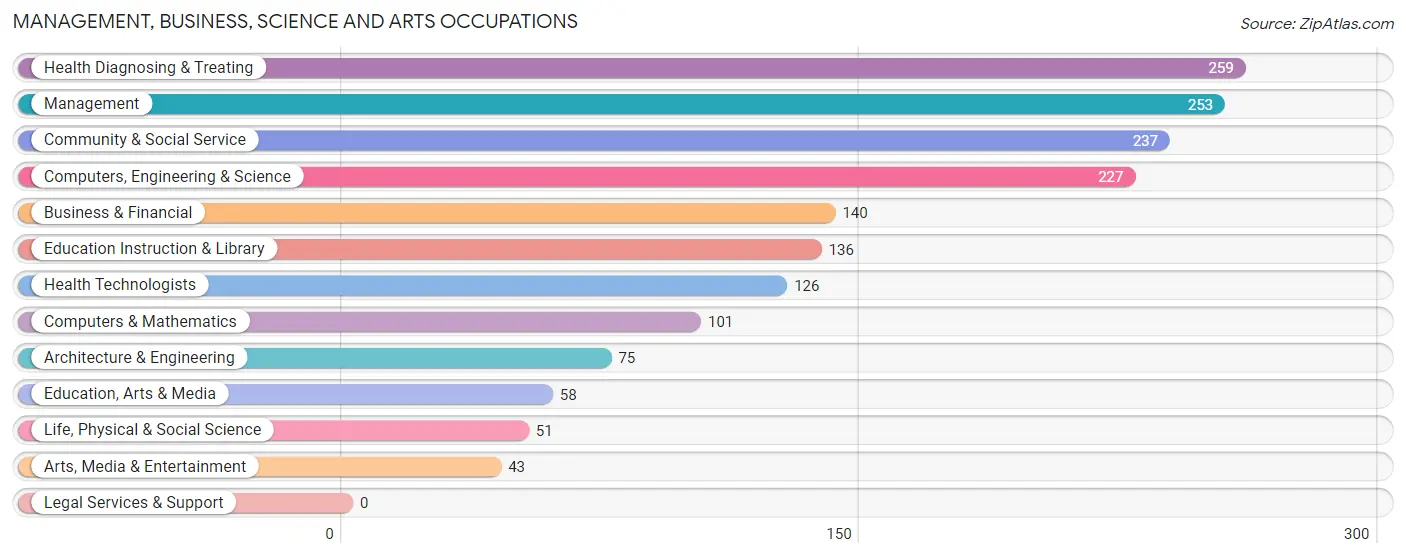
Management, Business, Science and Arts Occupations
The most common Management, Business, Science and Arts occupations in Fostoria are Health Diagnosing & Treating (259 | 4.4%), Management (253 | 4.3%), Community & Social Service (237 | 4.0%), Computers, Engineering & Science (227 | 3.9%), and Business & Financial (140 | 2.4%).
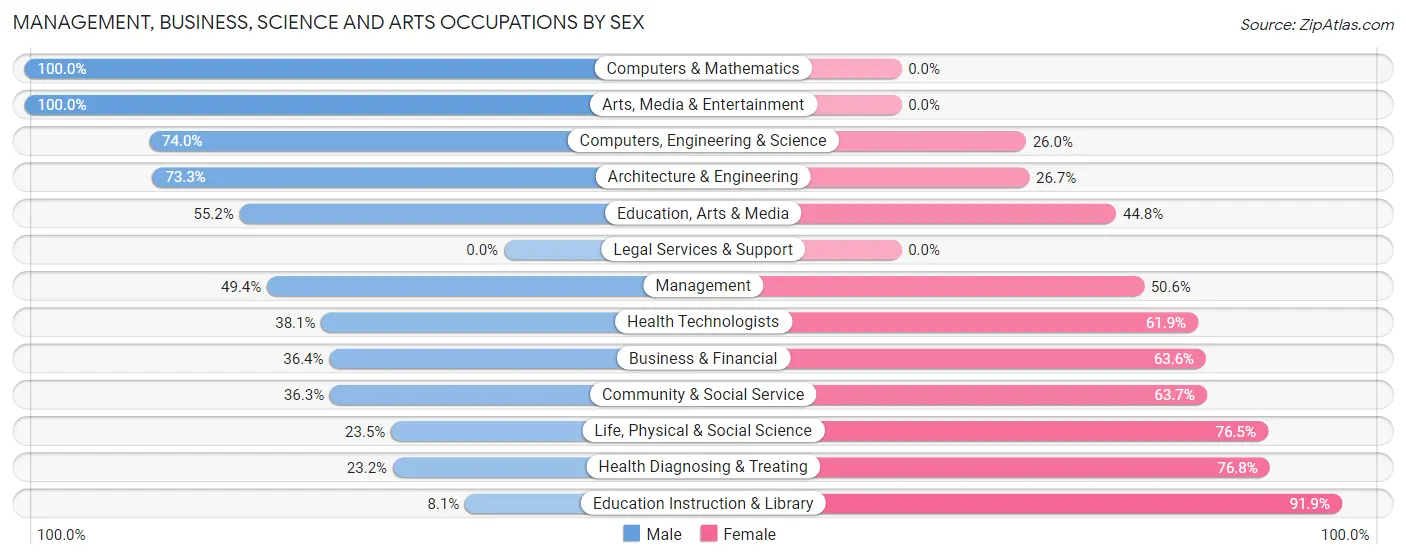
Management, Business, Science and Arts Occupations by Sex
Within the Management, Business, Science and Arts occupations in Fostoria, the most male-oriented occupations are Computers & Mathematics (100.0%), Arts, Media & Entertainment (100.0%), and Computers, Engineering & Science (74.0%), while the most female-oriented occupations are Education Instruction & Library (91.9%), Health Diagnosing & Treating (76.8%), and Life, Physical & Social Science (76.5%).
| Occupation | Male | Female |
| Management | 125 (49.4%) | 128 (50.6%) |
| Business & Financial | 51 (36.4%) | 89 (63.6%) |
| Computers, Engineering & Science | 168 (74.0%) | 59 (26.0%) |
| Computers & Mathematics | 101 (100.0%) | 0 (0.0%) |
| Architecture & Engineering | 55 (73.3%) | 20 (26.7%) |
| Life, Physical & Social Science | 12 (23.5%) | 39 (76.5%) |
| Community & Social Service | 86 (36.3%) | 151 (63.7%) |
| Education, Arts & Media | 32 (55.2%) | 26 (44.8%) |
| Legal Services & Support | 0 (0.0%) | 0 (0.0%) |
| Education Instruction & Library | 11 (8.1%) | 125 (91.9%) |
| Arts, Media & Entertainment | 43 (100.0%) | 0 (0.0%) |
| Health Diagnosing & Treating | 60 (23.2%) | 199 (76.8%) |
| Health Technologists | 48 (38.1%) | 78 (61.9%) |
| Total (Category) | 490 (43.9%) | 626 (56.1%) |
| Total (Overall) | 3,187 (54.2%) | 2,691 (45.8%) |
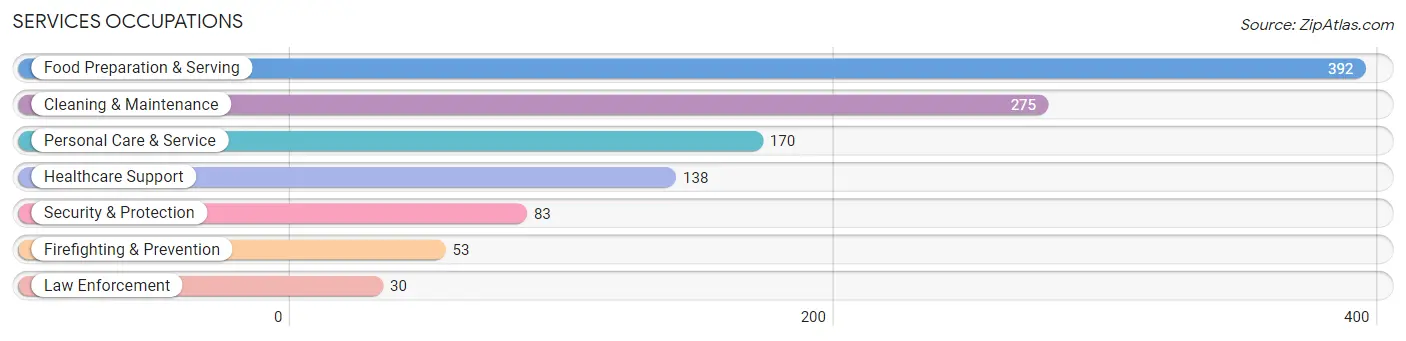
Services Occupations
The most common Services occupations in Fostoria are Food Preparation & Serving (392 | 6.7%), Cleaning & Maintenance (275 | 4.7%), Personal Care & Service (170 | 2.9%), Healthcare Support (138 | 2.4%), and Security & Protection (83 | 1.4%).
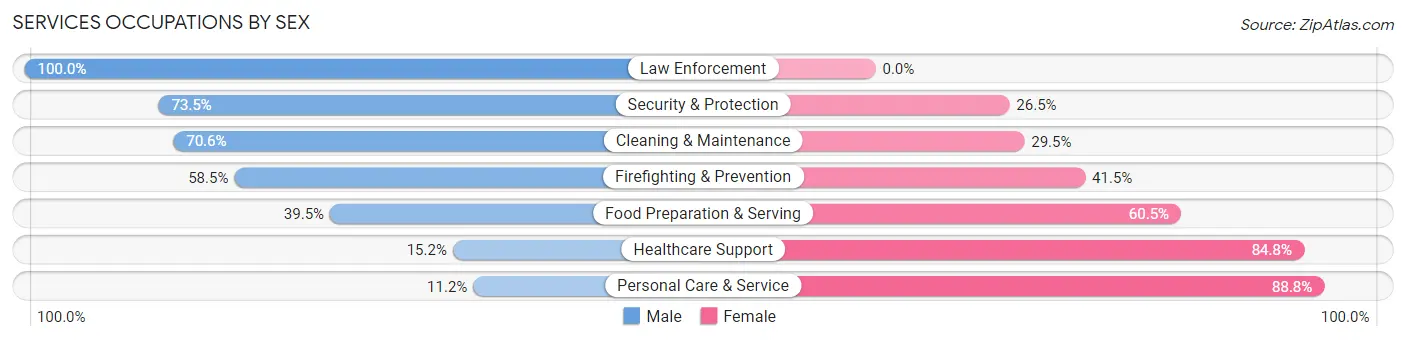
Services Occupations by Sex
Within the Services occupations in Fostoria, the most male-oriented occupations are Law Enforcement (100.0%), Security & Protection (73.5%), and Cleaning & Maintenance (70.6%), while the most female-oriented occupations are Personal Care & Service (88.8%), Healthcare Support (84.8%), and Food Preparation & Serving (60.5%).
| Occupation | Male | Female |
| Healthcare Support | 21 (15.2%) | 117 (84.8%) |
| Security & Protection | 61 (73.5%) | 22 (26.5%) |
| Firefighting & Prevention | 31 (58.5%) | 22 (41.5%) |
| Law Enforcement | 30 (100.0%) | 0 (0.0%) |
| Food Preparation & Serving | 155 (39.5%) | 237 (60.5%) |
| Cleaning & Maintenance | 194 (70.6%) | 81 (29.4%) |
| Personal Care & Service | 19 (11.2%) | 151 (88.8%) |
| Total (Category) | 450 (42.5%) | 608 (57.5%) |
| Total (Overall) | 3,187 (54.2%) | 2,691 (45.8%) |
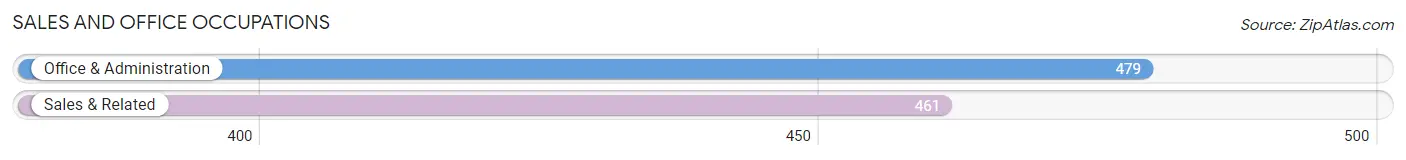
Sales and Office Occupations
The most common Sales and Office occupations in Fostoria are Office & Administration (479 | 8.2%), and Sales & Related (461 | 7.8%).
Sales and Office Occupations by Sex
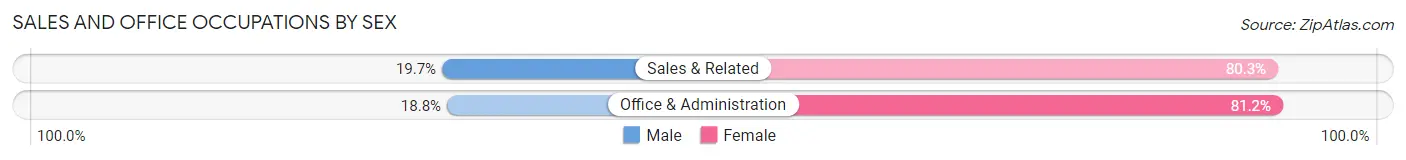
| Occupation | Male | Female |
| Sales & Related | 91 (19.7%) | 370 (80.3%) |
| Office & Administration | 90 (18.8%) | 389 (81.2%) |
| Total (Category) | 181 (19.3%) | 759 (80.7%) |
| Total (Overall) | 3,187 (54.2%) | 2,691 (45.8%) |
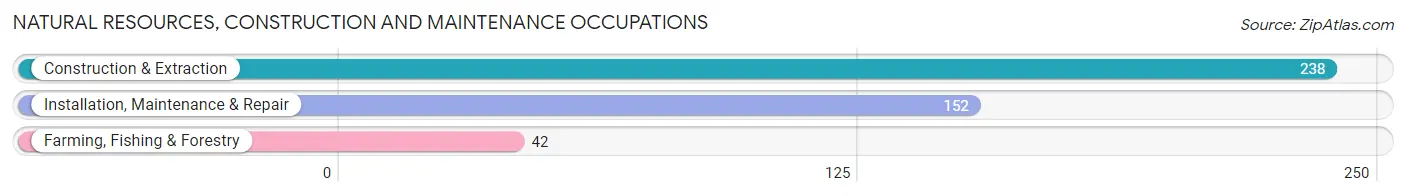
Natural Resources, Construction and Maintenance Occupations
The most common Natural Resources, Construction and Maintenance occupations in Fostoria are Construction & Extraction (238 | 4.1%), Installation, Maintenance & Repair (152 | 2.6%), and Farming, Fishing & Forestry (42 | 0.7%).
Natural Resources, Construction and Maintenance Occupations by Sex
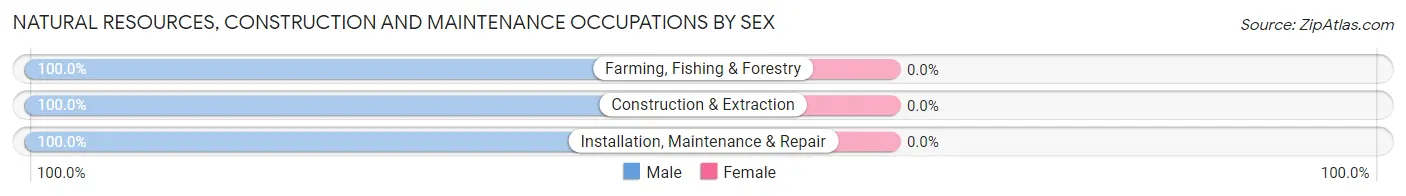
| Occupation | Male | Female |
| Farming, Fishing & Forestry | 42 (100.0%) | 0 (0.0%) |
| Construction & Extraction | 238 (100.0%) | 0 (0.0%) |
| Installation, Maintenance & Repair | 152 (100.0%) | 0 (0.0%) |
| Total (Category) | 432 (100.0%) | 0 (0.0%) |
| Total (Overall) | 3,187 (54.2%) | 2,691 (45.8%) |
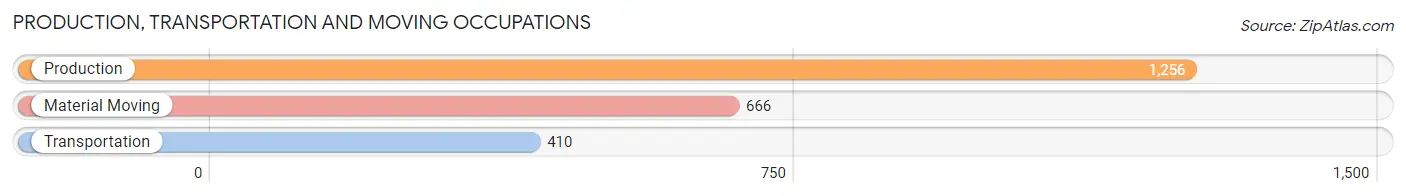
Production, Transportation and Moving Occupations
The most common Production, Transportation and Moving occupations in Fostoria are Production (1,256 | 21.4%), Material Moving (666 | 11.3%), and Transportation (410 | 7.0%).
Production, Transportation and Moving Occupations by Sex
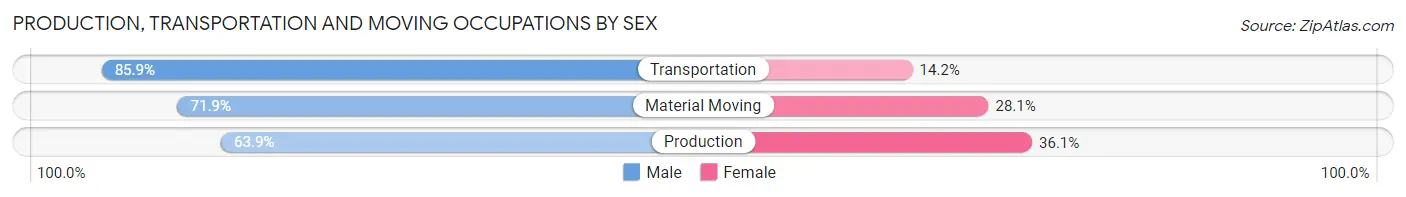
| Occupation | Male | Female |
| Production | 803 (63.9%) | 453 (36.1%) |
| Transportation | 352 (85.9%) | 58 (14.1%) |
| Material Moving | 479 (71.9%) | 187 (28.1%) |
| Total (Category) | 1,634 (70.1%) | 698 (29.9%) |
| Total (Overall) | 3,187 (54.2%) | 2,691 (45.8%) |
Employment Industries by Sex in Fostoria
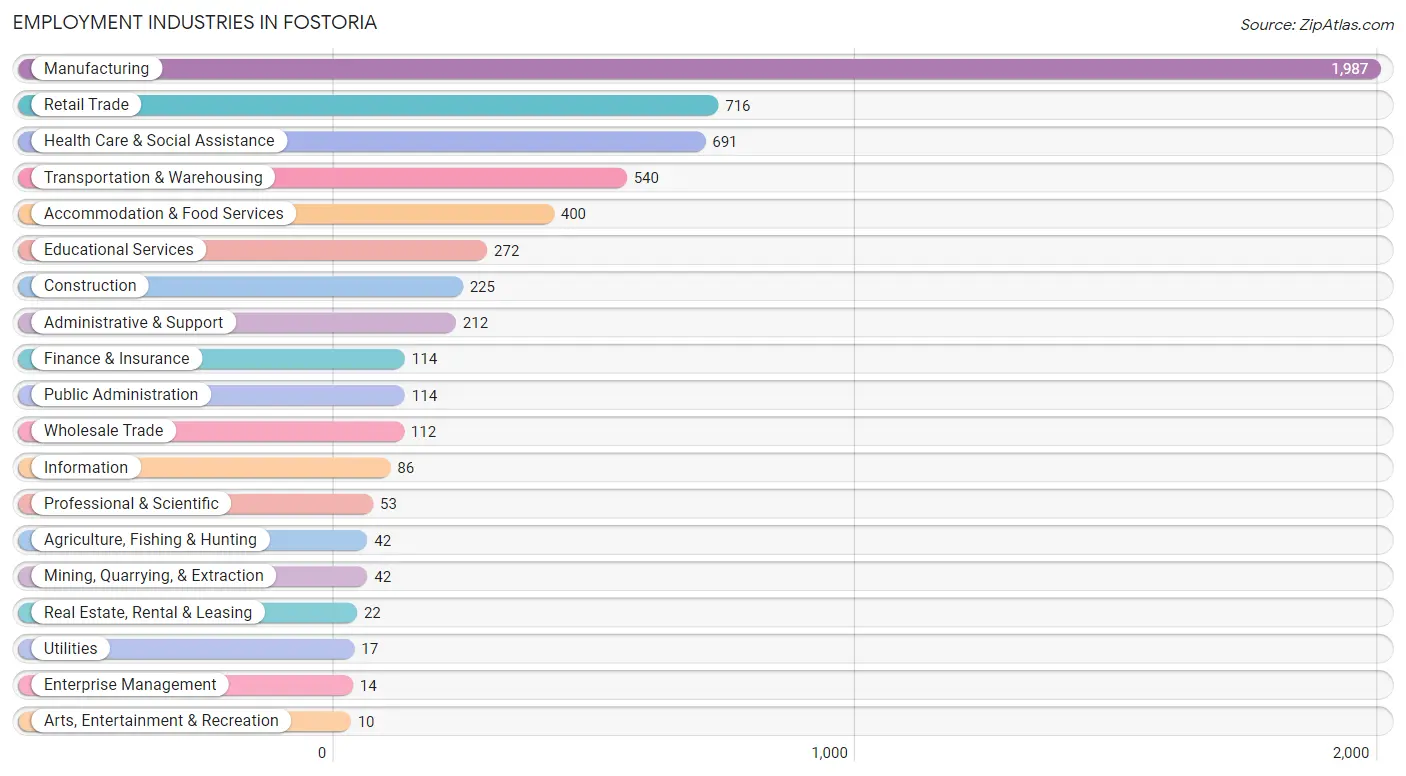
Employment Industries in Fostoria
The major employment industries in Fostoria include Manufacturing (1,987 | 33.8%), Retail Trade (716 | 12.2%), Health Care & Social Assistance (691 | 11.8%), Transportation & Warehousing (540 | 9.2%), and Accommodation & Food Services (400 | 6.8%).
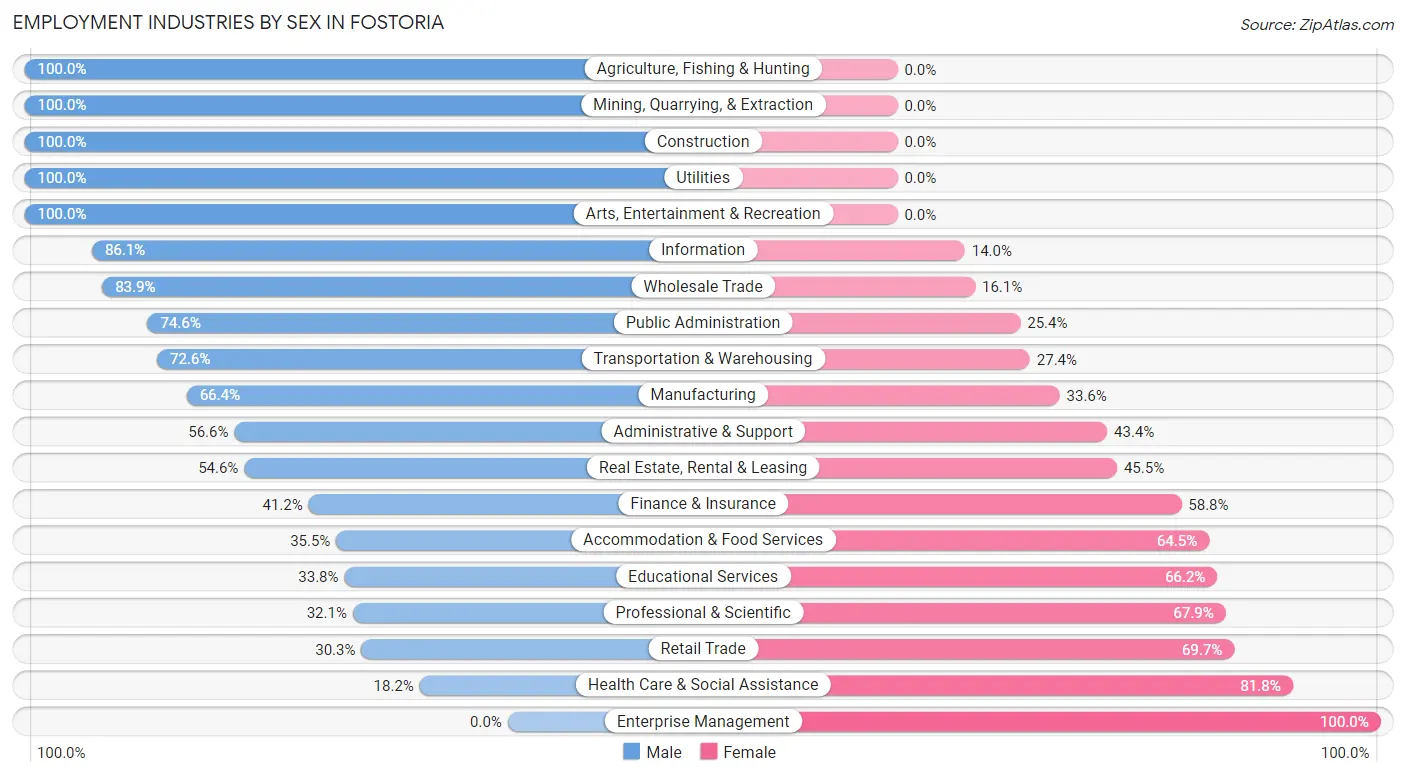
Employment Industries by Sex in Fostoria
The Fostoria industries that see more men than women are Agriculture, Fishing & Hunting (100.0%), Mining, Quarrying, & Extraction (100.0%), and Construction (100.0%), whereas the industries that tend to have a higher number of women are Enterprise Management (100.0%), Health Care & Social Assistance (81.8%), and Retail Trade (69.7%).
| Industry | Male | Female |
| Agriculture, Fishing & Hunting | 42 (100.0%) | 0 (0.0%) |
| Mining, Quarrying, & Extraction | 42 (100.0%) | 0 (0.0%) |
| Construction | 225 (100.0%) | 0 (0.0%) |
| Manufacturing | 1,320 (66.4%) | 667 (33.6%) |
| Wholesale Trade | 94 (83.9%) | 18 (16.1%) |
| Retail Trade | 217 (30.3%) | 499 (69.7%) |
| Transportation & Warehousing | 392 (72.6%) | 148 (27.4%) |
| Utilities | 17 (100.0%) | 0 (0.0%) |
| Information | 74 (86.1%) | 12 (14.0%) |
| Finance & Insurance | 47 (41.2%) | 67 (58.8%) |
| Real Estate, Rental & Leasing | 12 (54.5%) | 10 (45.5%) |
| Professional & Scientific | 17 (32.1%) | 36 (67.9%) |
| Enterprise Management | 0 (0.0%) | 14 (100.0%) |
| Administrative & Support | 120 (56.6%) | 92 (43.4%) |
| Educational Services | 92 (33.8%) | 180 (66.2%) |
| Health Care & Social Assistance | 126 (18.2%) | 565 (81.8%) |
| Arts, Entertainment & Recreation | 10 (100.0%) | 0 (0.0%) |
| Accommodation & Food Services | 142 (35.5%) | 258 (64.5%) |
| Public Administration | 85 (74.6%) | 29 (25.4%) |
| Total | 3,187 (54.2%) | 2,691 (45.8%) |
Education in Fostoria
School Enrollment in Fostoria
The most common levels of schooling among the 2,720 students in Fostoria are high school (779 | 28.6%), elementary school (732 | 26.9%), and middle school (538 | 19.8%).
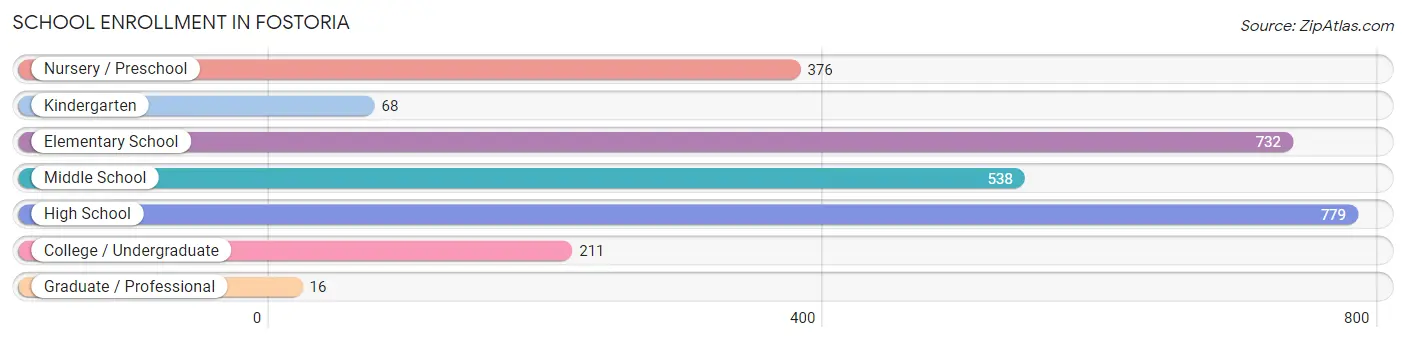
| School Level | # Students | % Students |
| Nursery / Preschool | 376 | 13.8% |
| Kindergarten | 68 | 2.5% |
| Elementary School | 732 | 26.9% |
| Middle School | 538 | 19.8% |
| High School | 779 | 28.6% |
| College / Undergraduate | 211 | 7.8% |
| Graduate / Professional | 16 | 0.6% |
| Total | 2,720 | 100.0% |
School Enrollment by Age by Funding Source in Fostoria
Out of a total of 2,720 students who are enrolled in schools in Fostoria, 321 (11.8%) attend a private institution, while the remaining 2,399 (88.2%) are enrolled in public schools. The age group of 35 years and over has the highest likelihood of being enrolled in private schools, with 56 (37.3% in the age bracket) enrolled. Conversely, the age group of 18 to 19 year olds has the lowest likelihood of being enrolled in a private school, with 50 (100.0% in the age bracket) attending a public institution.
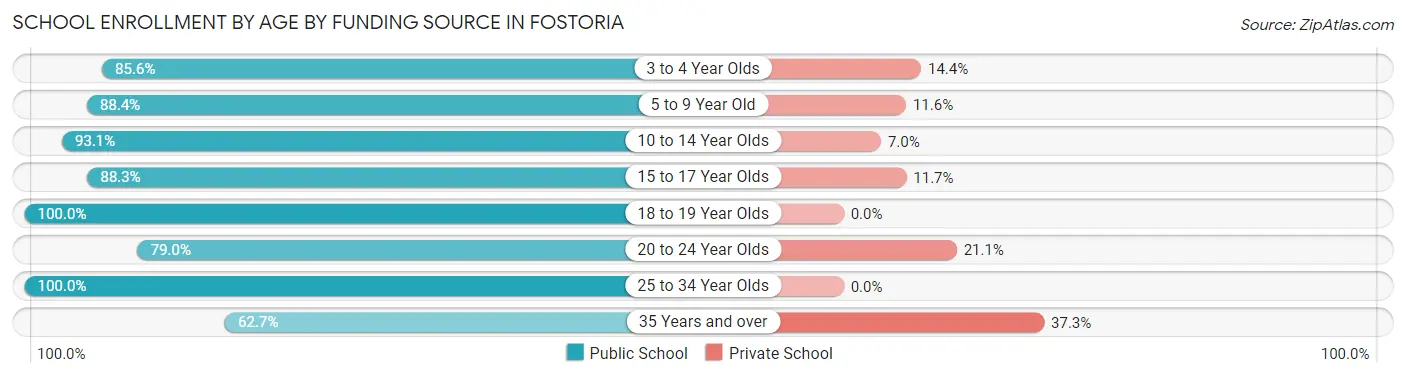
| Age Bracket | Public School | Private School |
| 3 to 4 Year Olds | 273 (85.6%) | 46 (14.4%) |
| 5 to 9 Year Old | 670 (88.4%) | 88 (11.6%) |
| 10 to 14 Year Olds | 629 (93.0%) | 47 (7.0%) |
| 15 to 17 Year Olds | 552 (88.3%) | 73 (11.7%) |
| 18 to 19 Year Olds | 50 (100.0%) | 0 (0.0%) |
| 20 to 24 Year Olds | 45 (78.9%) | 12 (21.0%) |
| 25 to 34 Year Olds | 85 (100.0%) | 0 (0.0%) |
| 35 Years and over | 94 (62.7%) | 56 (37.3%) |
| Total | 2,399 (88.2%) | 321 (11.8%) |
Educational Attainment by Field of Study in Fostoria
Education (236 | 22.4%), business (202 | 19.2%), bio, nature & agricultural (114 | 10.8%), science & technology (104 | 9.9%), and arts & humanities (103 | 9.8%) are the most common fields of study among 1,052 individuals in Fostoria who have obtained a bachelor's degree or higher.
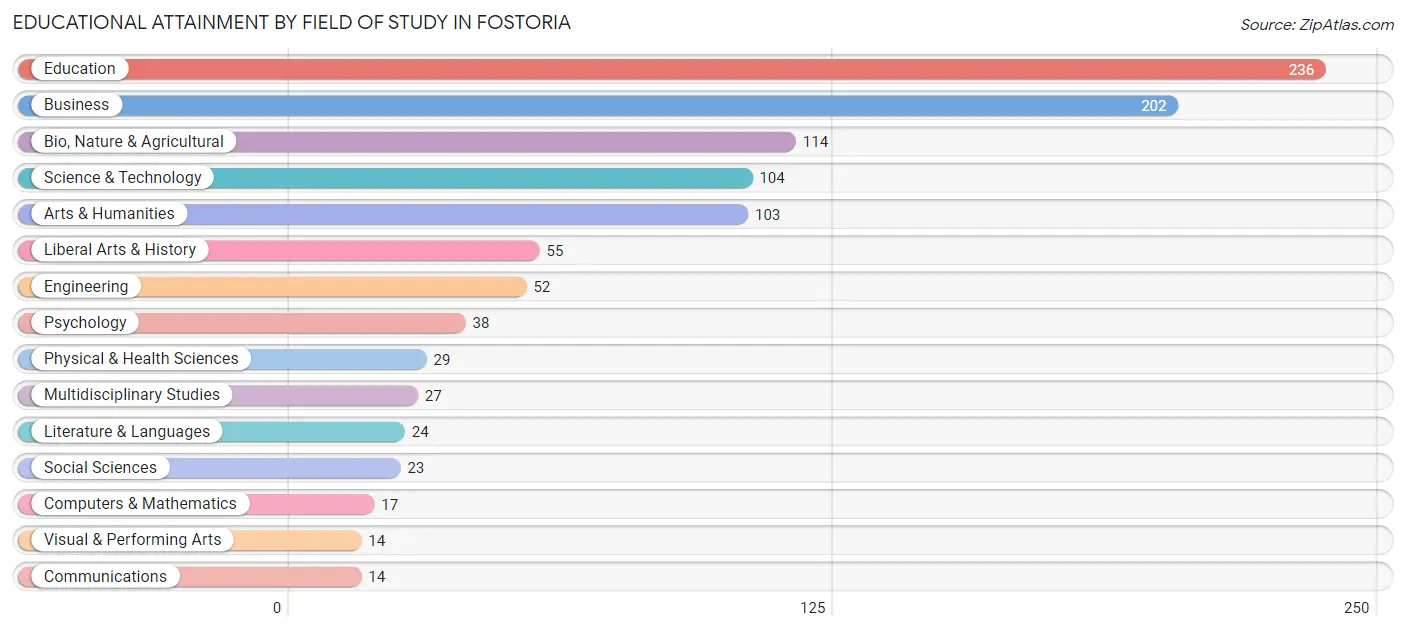
| Field of Study | # Graduates | % Graduates |
| Computers & Mathematics | 17 | 1.6% |
| Bio, Nature & Agricultural | 114 | 10.8% |
| Physical & Health Sciences | 29 | 2.8% |
| Psychology | 38 | 3.6% |
| Social Sciences | 23 | 2.2% |
| Engineering | 52 | 4.9% |
| Multidisciplinary Studies | 27 | 2.6% |
| Science & Technology | 104 | 9.9% |
| Business | 202 | 19.2% |
| Education | 236 | 22.4% |
| Literature & Languages | 24 | 2.3% |
| Liberal Arts & History | 55 | 5.2% |
| Visual & Performing Arts | 14 | 1.3% |
| Communications | 14 | 1.3% |
| Arts & Humanities | 103 | 9.8% |
| Total | 1,052 | 100.0% |
Transportation & Commute in Fostoria
Vehicle Availability by Sex in Fostoria
The most prevalent vehicle ownership categories in Fostoria are males with 2 vehicles (1,345, accounting for 43.3%) and females with 2 vehicles (1,001, making up 52.3%).
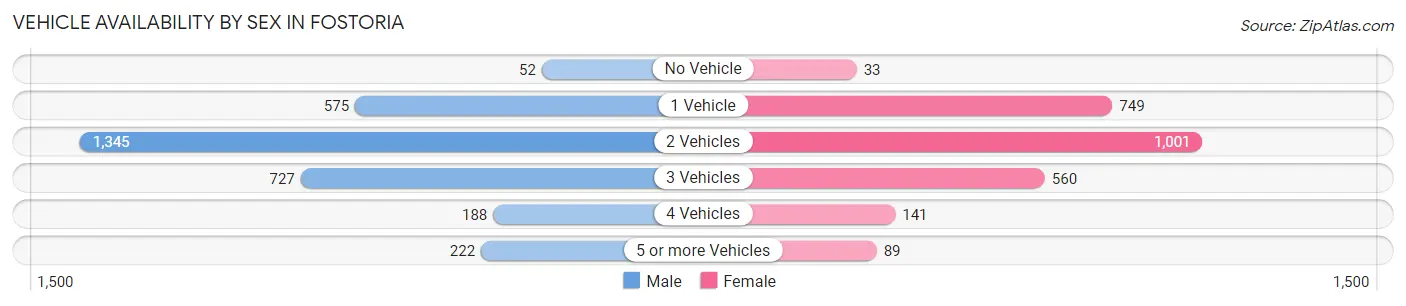
| Vehicles Available | Male | Female |
| No Vehicle | 52 (1.7%) | 33 (1.3%) |
| 1 Vehicle | 575 (18.5%) | 749 (29.1%) |
| 2 Vehicles | 1,345 (43.3%) | 1,001 (38.9%) |
| 3 Vehicles | 727 (23.4%) | 560 (21.8%) |
| 4 Vehicles | 188 (6.0%) | 141 (5.5%) |
| 5 or more Vehicles | 222 (7.1%) | 89 (3.5%) |
| Total | 3,109 (100.0%) | 2,573 (100.0%) |
Commute Time in Fostoria
The most frequently occuring commute durations in Fostoria are 20 to 24 minutes (1,042 commuters, 18.8%), 5 to 9 minutes (937 commuters, 16.9%), and 30 to 34 minutes (897 commuters, 16.2%).
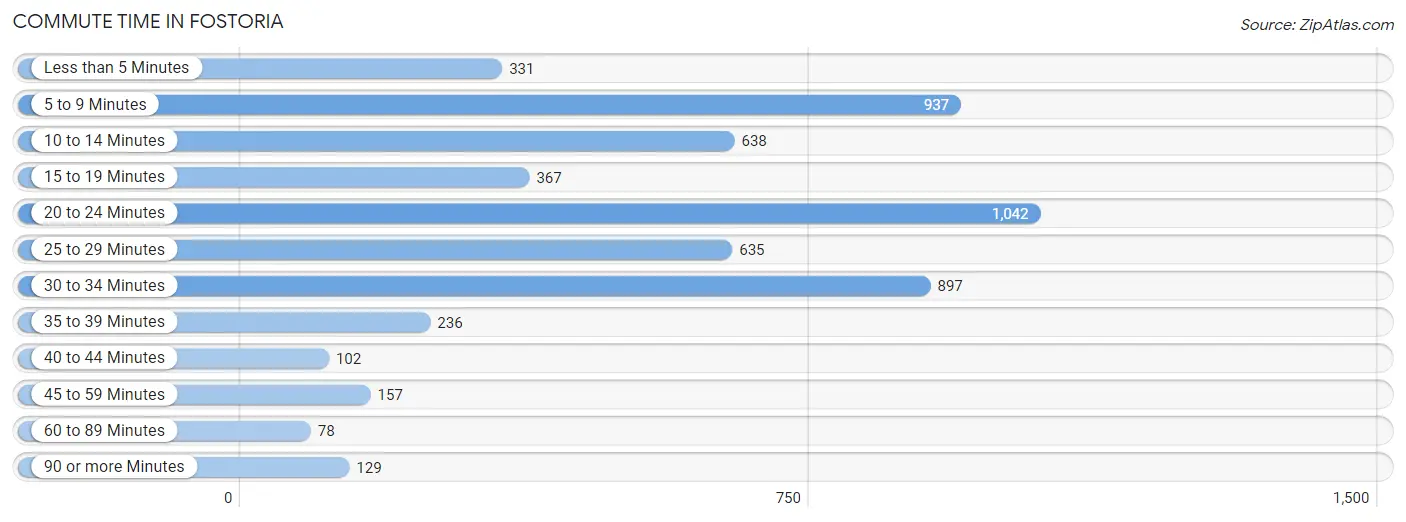
| Commute Time | # Commuters | % Commuters |
| Less than 5 Minutes | 331 | 6.0% |
| 5 to 9 Minutes | 937 | 16.9% |
| 10 to 14 Minutes | 638 | 11.5% |
| 15 to 19 Minutes | 367 | 6.6% |
| 20 to 24 Minutes | 1,042 | 18.8% |
| 25 to 29 Minutes | 635 | 11.4% |
| 30 to 34 Minutes | 897 | 16.2% |
| 35 to 39 Minutes | 236 | 4.3% |
| 40 to 44 Minutes | 102 | 1.8% |
| 45 to 59 Minutes | 157 | 2.8% |
| 60 to 89 Minutes | 78 | 1.4% |
| 90 or more Minutes | 129 | 2.3% |
Commute Time by Sex in Fostoria
The most common commute times in Fostoria are 20 to 24 minutes (633 commuters, 20.9%) for males and 5 to 9 minutes (412 commuters, 16.4%) for females.
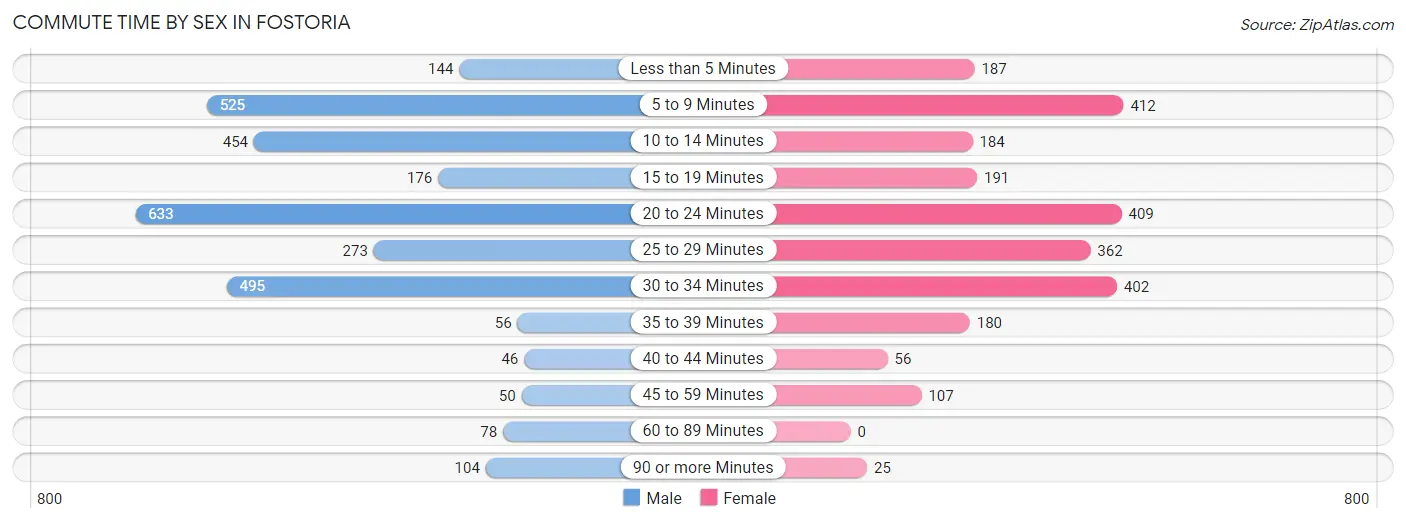
| Commute Time | Male | Female |
| Less than 5 Minutes | 144 (4.8%) | 187 (7.4%) |
| 5 to 9 Minutes | 525 (17.3%) | 412 (16.4%) |
| 10 to 14 Minutes | 454 (15.0%) | 184 (7.3%) |
| 15 to 19 Minutes | 176 (5.8%) | 191 (7.6%) |
| 20 to 24 Minutes | 633 (20.9%) | 409 (16.3%) |
| 25 to 29 Minutes | 273 (9.0%) | 362 (14.4%) |
| 30 to 34 Minutes | 495 (16.3%) | 402 (16.0%) |
| 35 to 39 Minutes | 56 (1.8%) | 180 (7.2%) |
| 40 to 44 Minutes | 46 (1.5%) | 56 (2.2%) |
| 45 to 59 Minutes | 50 (1.7%) | 107 (4.3%) |
| 60 to 89 Minutes | 78 (2.6%) | 0 (0.0%) |
| 90 or more Minutes | 104 (3.4%) | 25 (1.0%) |
Time of Departure to Work by Sex in Fostoria
The most frequent times of departure to work in Fostoria are 12:00 PM to 3:59 PM (484, 16.0%) for males and 4:00 PM to 11:59 PM (407, 16.2%) for females.
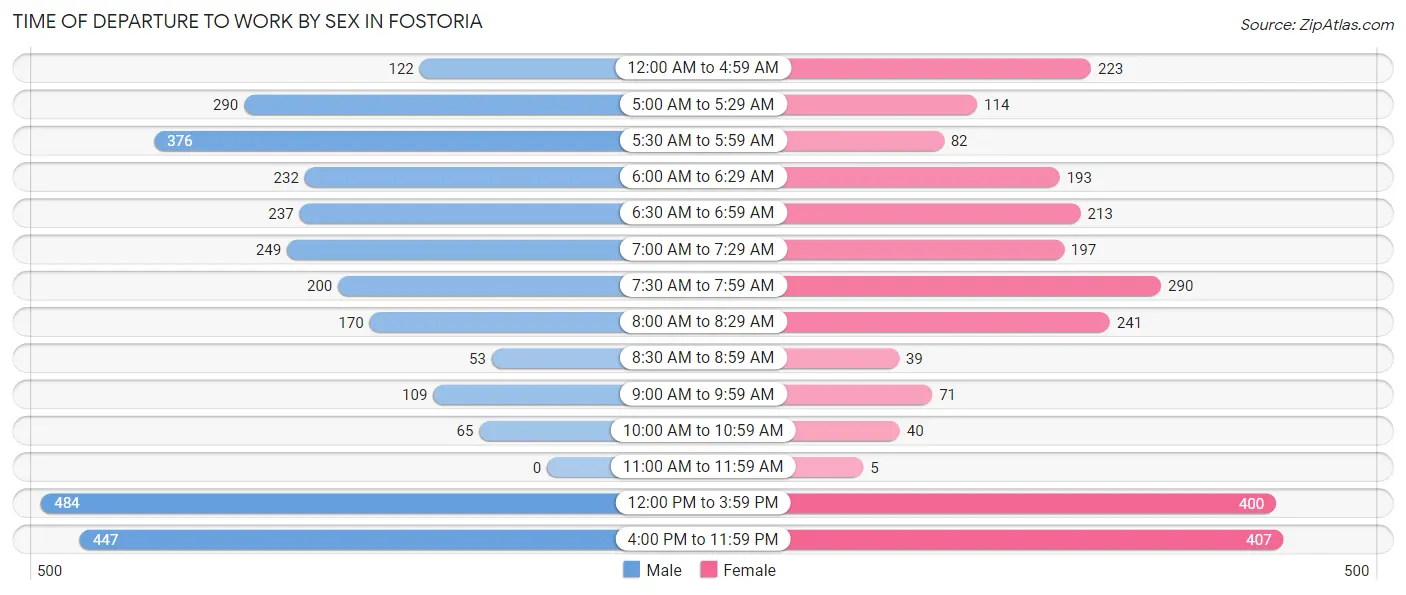
| Time of Departure | Male | Female |
| 12:00 AM to 4:59 AM | 122 (4.0%) | 223 (8.9%) |
| 5:00 AM to 5:29 AM | 290 (9.6%) | 114 (4.5%) |
| 5:30 AM to 5:59 AM | 376 (12.4%) | 82 (3.3%) |
| 6:00 AM to 6:29 AM | 232 (7.6%) | 193 (7.7%) |
| 6:30 AM to 6:59 AM | 237 (7.8%) | 213 (8.5%) |
| 7:00 AM to 7:29 AM | 249 (8.2%) | 197 (7.8%) |
| 7:30 AM to 7:59 AM | 200 (6.6%) | 290 (11.5%) |
| 8:00 AM to 8:29 AM | 170 (5.6%) | 241 (9.6%) |
| 8:30 AM to 8:59 AM | 53 (1.8%) | 39 (1.5%) |
| 9:00 AM to 9:59 AM | 109 (3.6%) | 71 (2.8%) |
| 10:00 AM to 10:59 AM | 65 (2.1%) | 40 (1.6%) |
| 11:00 AM to 11:59 AM | 0 (0.0%) | 5 (0.2%) |
| 12:00 PM to 3:59 PM | 484 (16.0%) | 400 (15.9%) |
| 4:00 PM to 11:59 PM | 447 (14.7%) | 407 (16.2%) |
| Total | 3,034 (100.0%) | 2,515 (100.0%) |
Housing Occupancy in Fostoria
Occupancy by Ownership in Fostoria
Of the total 5,092 dwellings in Fostoria, owner-occupied units account for 3,344 (65.7%), while renter-occupied units make up 1,748 (34.3%).
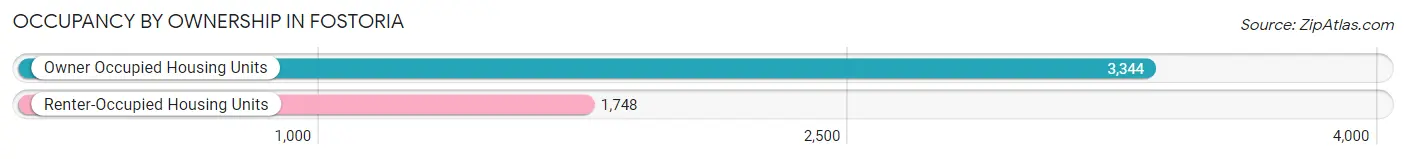
| Occupancy | # Housing Units | % Housing Units |
| Owner Occupied Housing Units | 3,344 | 65.7% |
| Renter-Occupied Housing Units | 1,748 | 34.3% |
| Total Occupied Housing Units | 5,092 | 100.0% |
Occupancy by Household Size in Fostoria
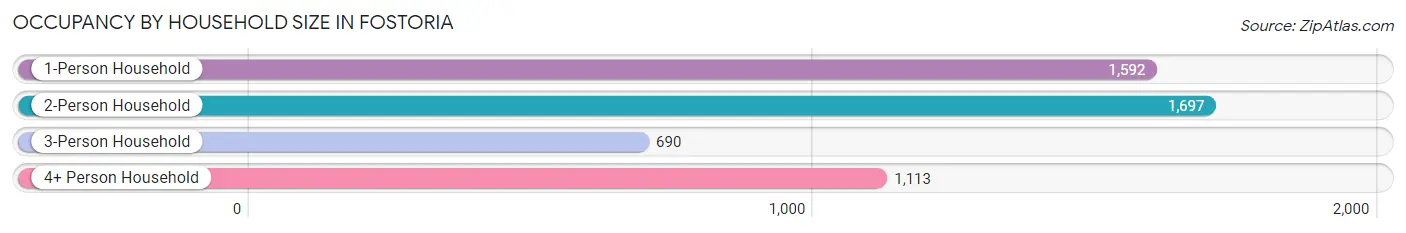
| Household Size | # Housing Units | % Housing Units |
| 1-Person Household | 1,592 | 31.3% |
| 2-Person Household | 1,697 | 33.3% |
| 3-Person Household | 690 | 13.6% |
| 4+ Person Household | 1,113 | 21.9% |
| Total Housing Units | 5,092 | 100.0% |
Occupancy by Ownership by Household Size in Fostoria
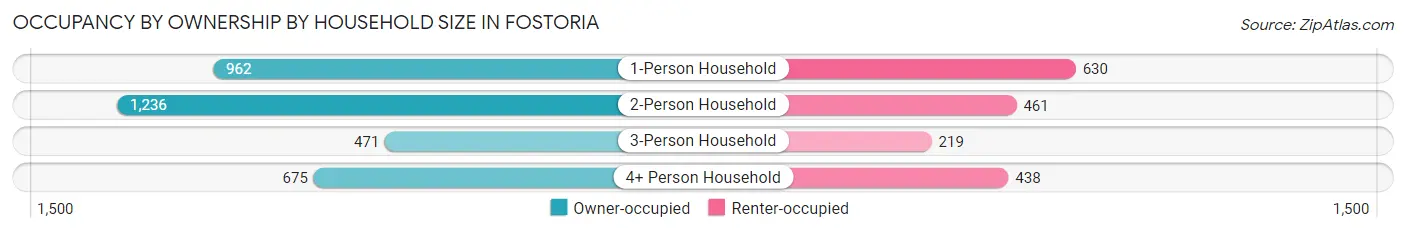
| Household Size | Owner-occupied | Renter-occupied |
| 1-Person Household | 962 (60.4%) | 630 (39.6%) |
| 2-Person Household | 1,236 (72.8%) | 461 (27.2%) |
| 3-Person Household | 471 (68.3%) | 219 (31.7%) |
| 4+ Person Household | 675 (60.7%) | 438 (39.4%) |
| Total Housing Units | 3,344 (65.7%) | 1,748 (34.3%) |
Occupancy by Educational Attainment in Fostoria
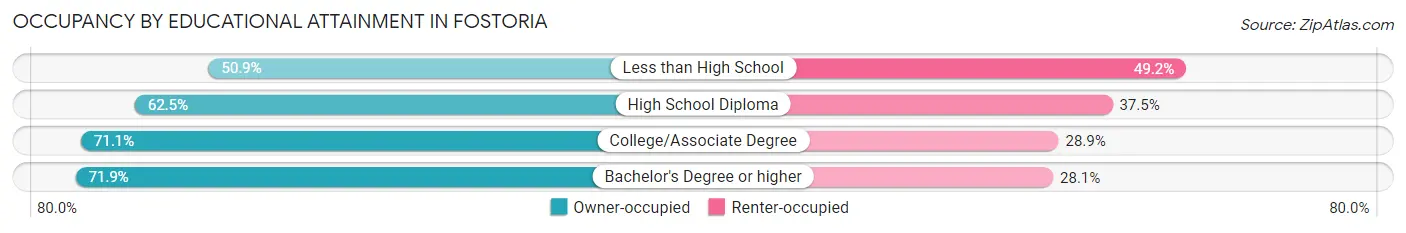
| Household Size | Owner-occupied | Renter-occupied |
| Less than High School | 210 (50.8%) | 203 (49.1%) |
| High School Diploma | 1,436 (62.5%) | 861 (37.5%) |
| College/Associate Degree | 1,265 (71.1%) | 515 (28.9%) |
| Bachelor's Degree or higher | 433 (71.9%) | 169 (28.1%) |
Occupancy by Age of Householder in Fostoria
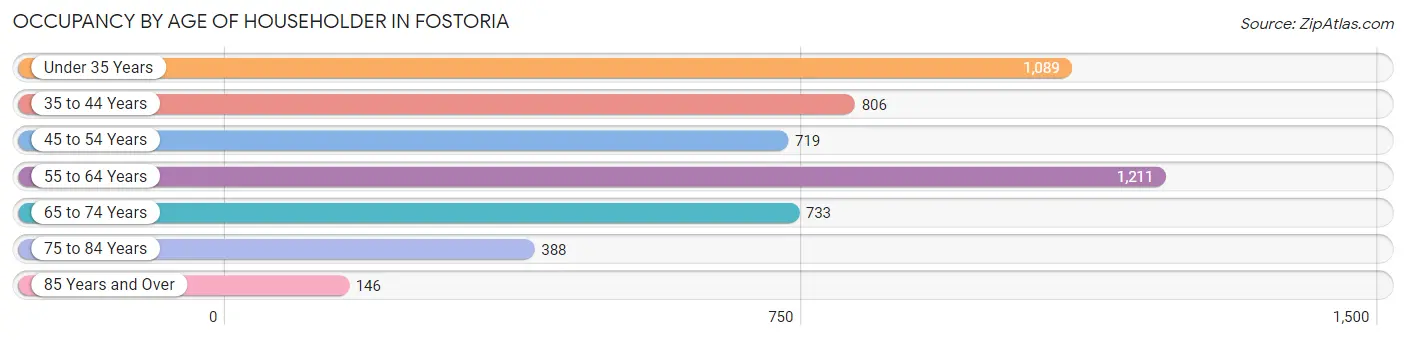
| Age Bracket | # Households | % Households |
| Under 35 Years | 1,089 | 21.4% |
| 35 to 44 Years | 806 | 15.8% |
| 45 to 54 Years | 719 | 14.1% |
| 55 to 64 Years | 1,211 | 23.8% |
| 65 to 74 Years | 733 | 14.4% |
| 75 to 84 Years | 388 | 7.6% |
| 85 Years and Over | 146 | 2.9% |
| Total | 5,092 | 100.0% |
Housing Finances in Fostoria
Median Income by Occupancy in Fostoria
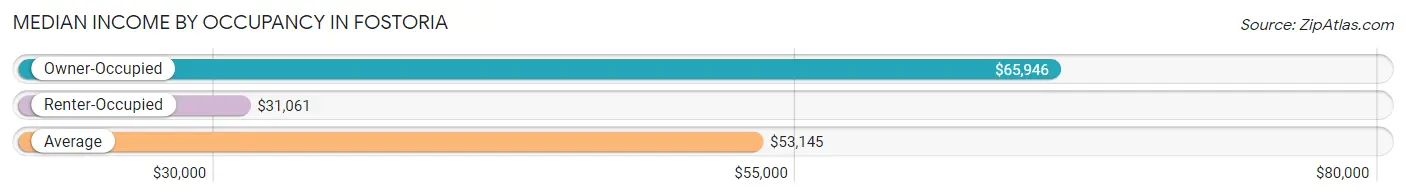
| Occupancy Type | # Households | Median Income |
| Owner-Occupied | 3,344 (65.7%) | $65,946 |
| Renter-Occupied | 1,748 (34.3%) | $31,061 |
| Average | 5,092 (100.0%) | $53,145 |
Occupancy by Householder Income Bracket in Fostoria
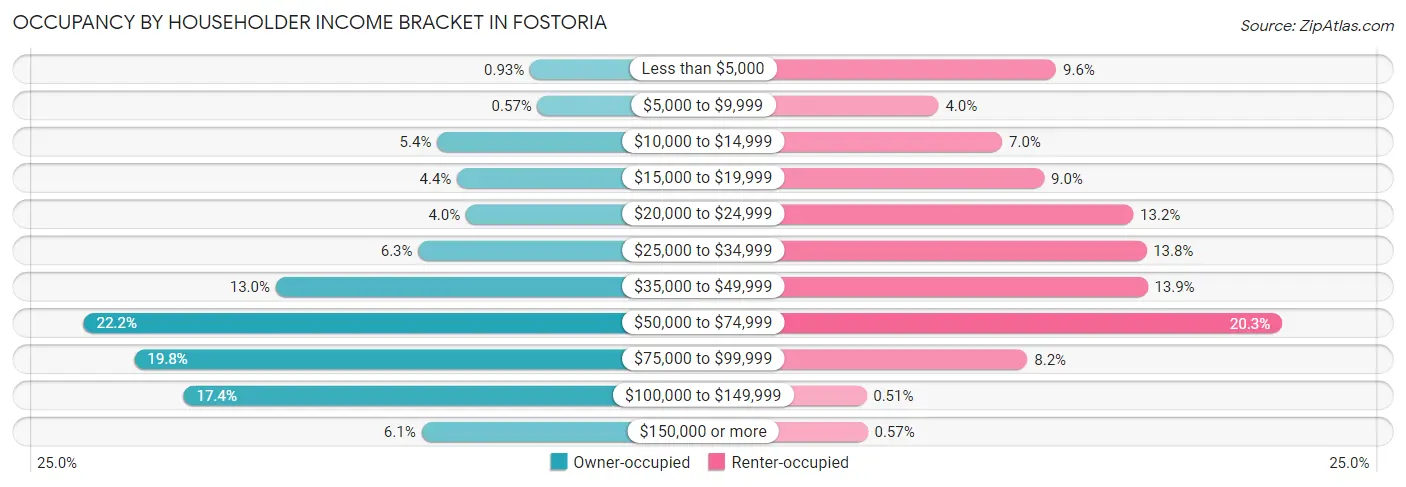
| Income Bracket | Owner-occupied | Renter-occupied |
| Less than $5,000 | 31 (0.9%) | 167 (9.6%) |
| $5,000 to $9,999 | 19 (0.6%) | 69 (4.0%) |
| $10,000 to $14,999 | 179 (5.3%) | 122 (7.0%) |
| $15,000 to $19,999 | 147 (4.4%) | 157 (9.0%) |
| $20,000 to $24,999 | 133 (4.0%) | 231 (13.2%) |
| $25,000 to $34,999 | 209 (6.2%) | 242 (13.8%) |
| $35,000 to $49,999 | 436 (13.0%) | 243 (13.9%) |
| $50,000 to $74,999 | 742 (22.2%) | 355 (20.3%) |
| $75,000 to $99,999 | 661 (19.8%) | 143 (8.2%) |
| $100,000 to $149,999 | 583 (17.4%) | 9 (0.5%) |
| $150,000 or more | 204 (6.1%) | 10 (0.6%) |
| Total | 3,344 (100.0%) | 1,748 (100.0%) |
Monthly Housing Cost Tiers in Fostoria
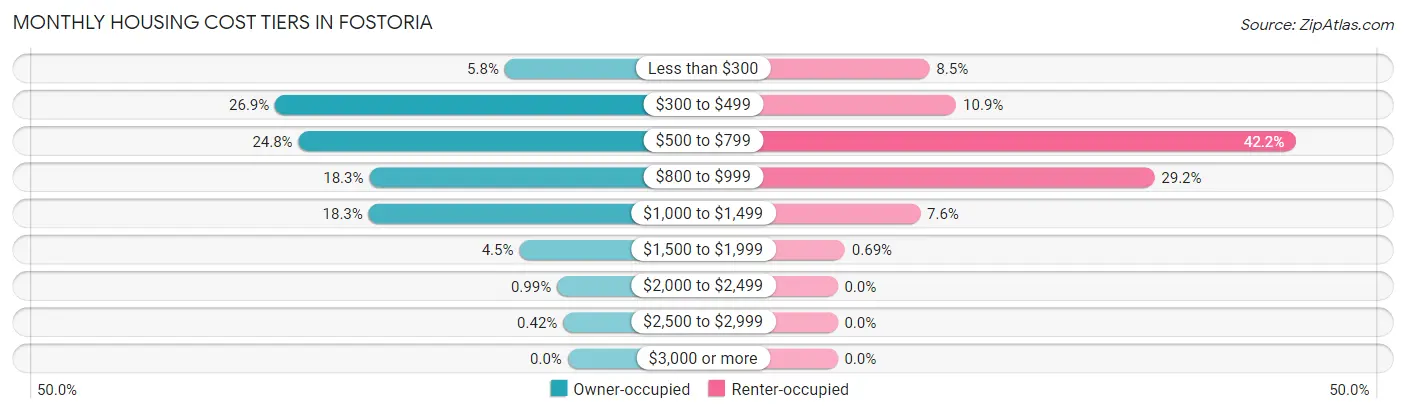
| Monthly Cost | Owner-occupied | Renter-occupied |
| Less than $300 | 194 (5.8%) | 148 (8.5%) |
| $300 to $499 | 901 (26.9%) | 191 (10.9%) |
| $500 to $799 | 829 (24.8%) | 738 (42.2%) |
| $800 to $999 | 611 (18.3%) | 510 (29.2%) |
| $1,000 to $1,499 | 613 (18.3%) | 133 (7.6%) |
| $1,500 to $1,999 | 149 (4.5%) | 12 (0.7%) |
| $2,000 to $2,499 | 33 (1.0%) | 0 (0.0%) |
| $2,500 to $2,999 | 14 (0.4%) | 0 (0.0%) |
| $3,000 or more | 0 (0.0%) | 0 (0.0%) |
| Total | 3,344 (100.0%) | 1,748 (100.0%) |
Physical Housing Characteristics in Fostoria
Housing Structures in Fostoria
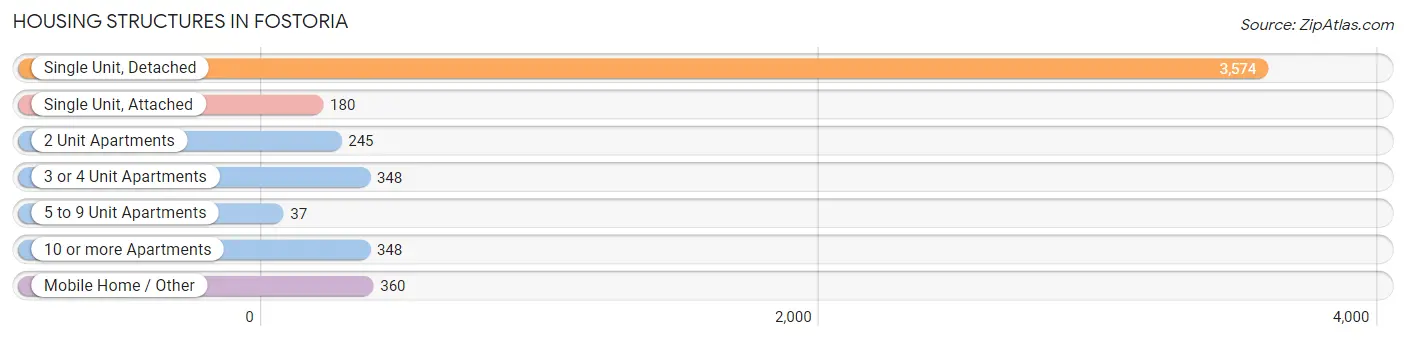
| Structure Type | # Housing Units | % Housing Units |
| Single Unit, Detached | 3,574 | 70.2% |
| Single Unit, Attached | 180 | 3.5% |
| 2 Unit Apartments | 245 | 4.8% |
| 3 or 4 Unit Apartments | 348 | 6.8% |
| 5 to 9 Unit Apartments | 37 | 0.7% |
| 10 or more Apartments | 348 | 6.8% |
| Mobile Home / Other | 360 | 7.1% |
| Total | 5,092 | 100.0% |
Housing Structures by Occupancy in Fostoria
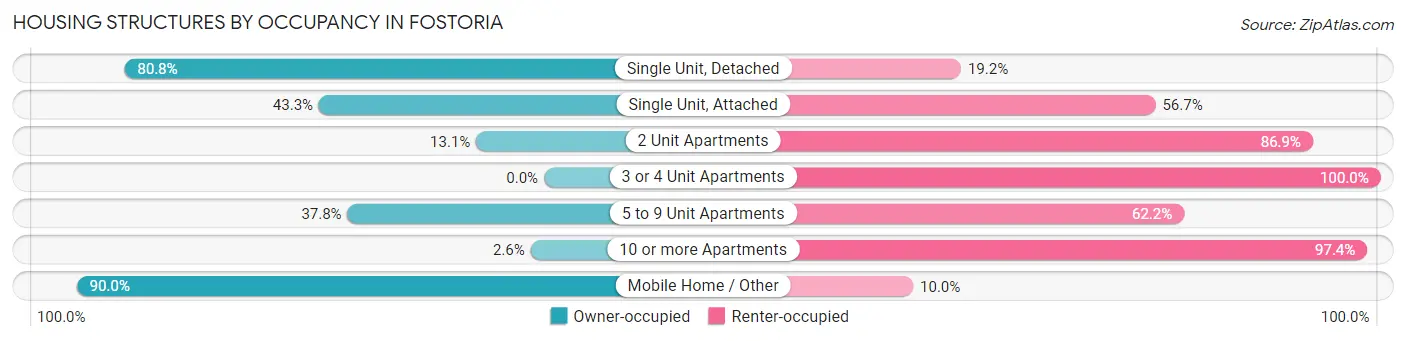
| Structure Type | Owner-occupied | Renter-occupied |
| Single Unit, Detached | 2,887 (80.8%) | 687 (19.2%) |
| Single Unit, Attached | 78 (43.3%) | 102 (56.7%) |
| 2 Unit Apartments | 32 (13.1%) | 213 (86.9%) |
| 3 or 4 Unit Apartments | 0 (0.0%) | 348 (100.0%) |
| 5 to 9 Unit Apartments | 14 (37.8%) | 23 (62.2%) |
| 10 or more Apartments | 9 (2.6%) | 339 (97.4%) |
| Mobile Home / Other | 324 (90.0%) | 36 (10.0%) |
| Total | 3,344 (65.7%) | 1,748 (34.3%) |
Housing Structures by Number of Rooms in Fostoria
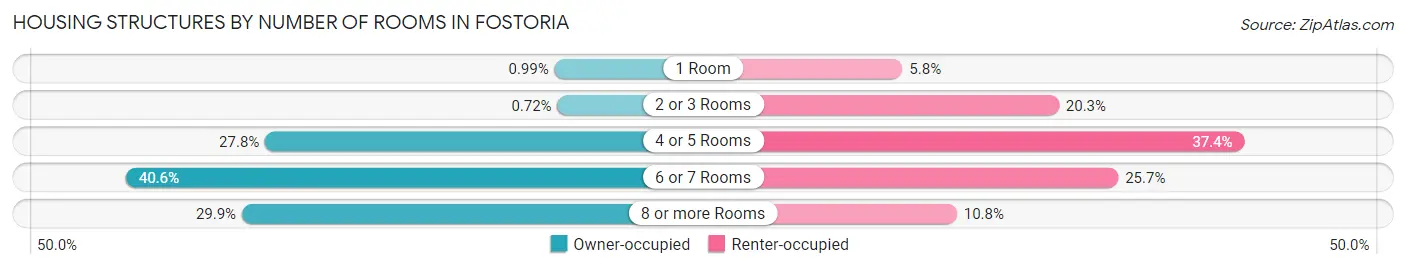
| Number of Rooms | Owner-occupied | Renter-occupied |
| 1 Room | 33 (1.0%) | 101 (5.8%) |
| 2 or 3 Rooms | 24 (0.7%) | 354 (20.3%) |
| 4 or 5 Rooms | 928 (27.8%) | 654 (37.4%) |
| 6 or 7 Rooms | 1,359 (40.6%) | 450 (25.7%) |
| 8 or more Rooms | 1,000 (29.9%) | 189 (10.8%) |
| Total | 3,344 (100.0%) | 1,748 (100.0%) |
Housing Structure by Heating Type in Fostoria
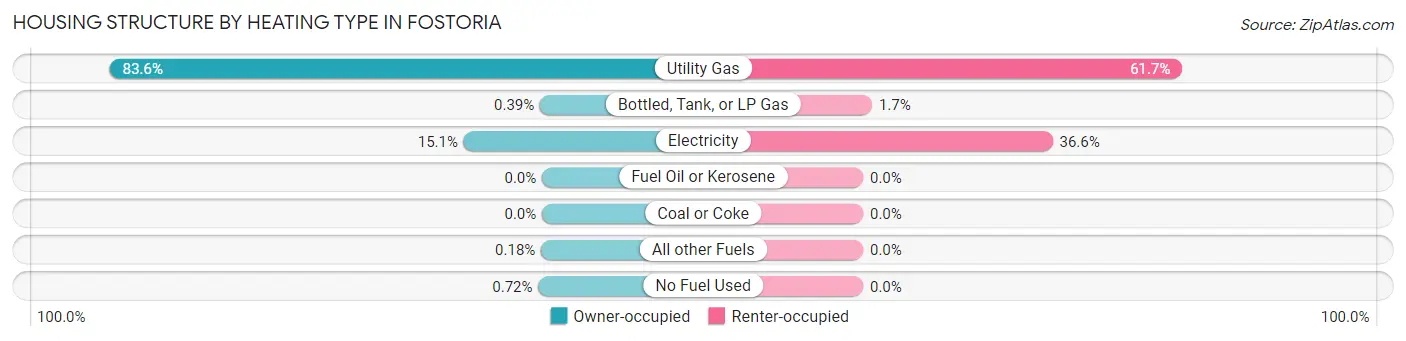
| Heating Type | Owner-occupied | Renter-occupied |
| Utility Gas | 2,795 (83.6%) | 1,078 (61.7%) |
| Bottled, Tank, or LP Gas | 13 (0.4%) | 30 (1.7%) |
| Electricity | 506 (15.1%) | 640 (36.6%) |
| Fuel Oil or Kerosene | 0 (0.0%) | 0 (0.0%) |
| Coal or Coke | 0 (0.0%) | 0 (0.0%) |
| All other Fuels | 6 (0.2%) | 0 (0.0%) |
| No Fuel Used | 24 (0.7%) | 0 (0.0%) |
| Total | 3,344 (100.0%) | 1,748 (100.0%) |
Household Vehicle Usage in Fostoria
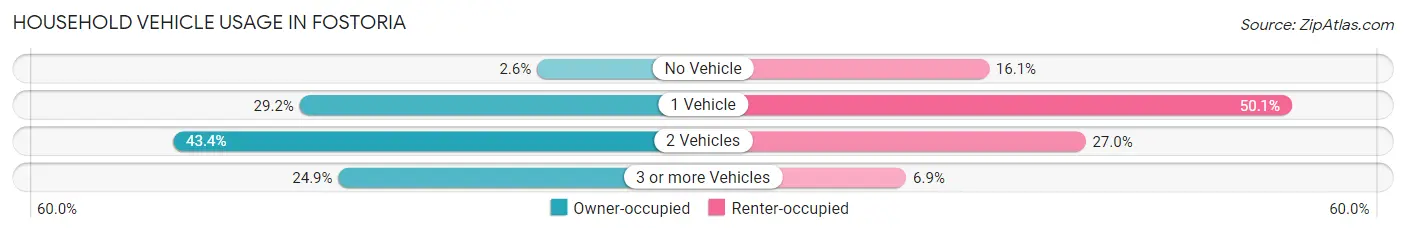
| Vehicles per Household | Owner-occupied | Renter-occupied |
| No Vehicle | 87 (2.6%) | 282 (16.1%) |
| 1 Vehicle | 976 (29.2%) | 875 (50.1%) |
| 2 Vehicles | 1,450 (43.4%) | 471 (27.0%) |
| 3 or more Vehicles | 831 (24.8%) | 120 (6.9%) |
| Total | 3,344 (100.0%) | 1,748 (100.0%) |
Real Estate & Mortgages in Fostoria
Real Estate and Mortgage Overview in Fostoria
| Characteristic | Without Mortgage | With Mortgage |
| Housing Units | 1,571 | 1,773 |
| Median Property Value | $64,500 | $89,600 |
| Median Household Income | $51,250 | $129 |
| Monthly Housing Costs | $446 | $0 |
| Real Estate Taxes | $974 | $16 |
Property Value by Mortgage Status in Fostoria
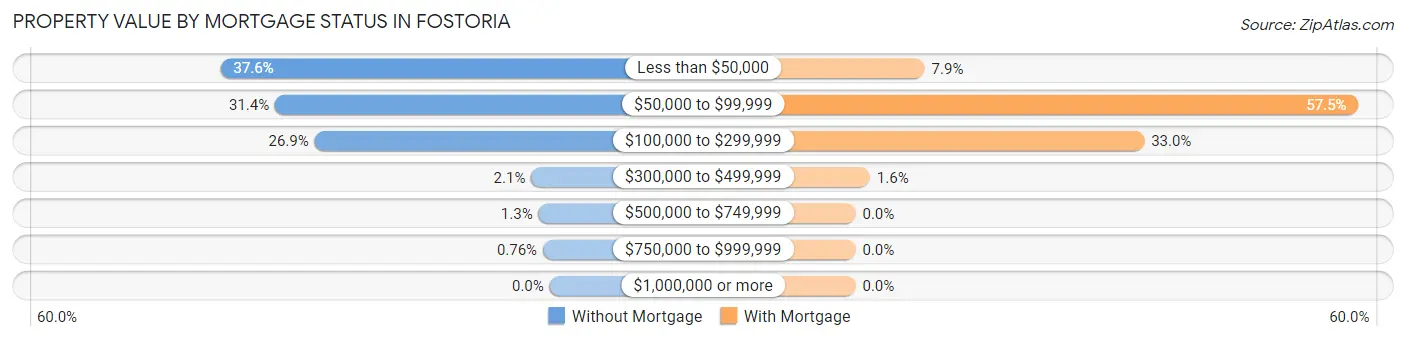
| Property Value | Without Mortgage | With Mortgage |
| Less than $50,000 | 591 (37.6%) | 140 (7.9%) |
| $50,000 to $99,999 | 493 (31.4%) | 1,019 (57.5%) |
| $100,000 to $299,999 | 422 (26.9%) | 585 (33.0%) |
| $300,000 to $499,999 | 33 (2.1%) | 29 (1.6%) |
| $500,000 to $749,999 | 20 (1.3%) | 0 (0.0%) |
| $750,000 to $999,999 | 12 (0.8%) | 0 (0.0%) |
| $1,000,000 or more | 0 (0.0%) | 0 (0.0%) |
| Total | 1,571 (100.0%) | 1,773 (100.0%) |
Household Income by Mortgage Status in Fostoria
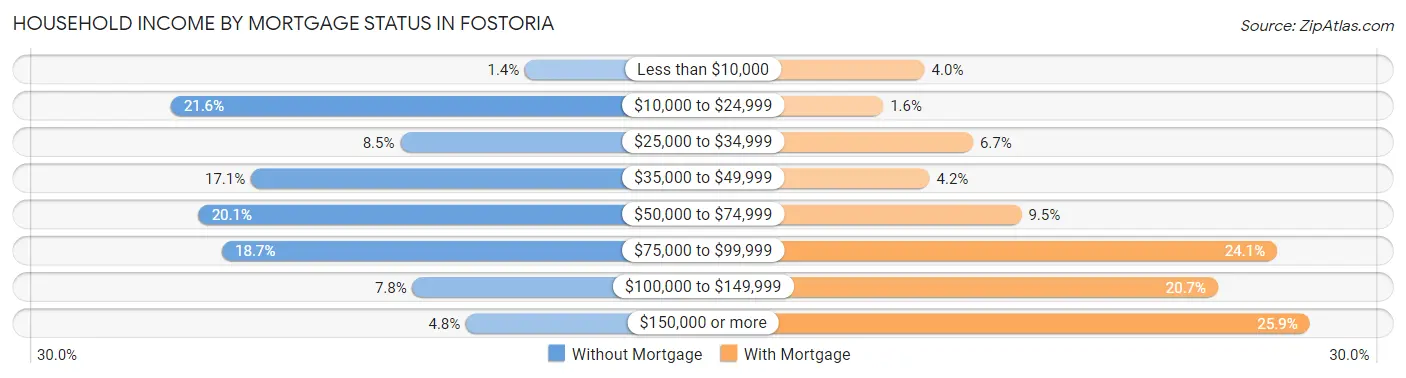
| Household Income | Without Mortgage | With Mortgage |
| Less than $10,000 | 22 (1.4%) | 70 (4.0%) |
| $10,000 to $24,999 | 340 (21.6%) | 28 (1.6%) |
| $25,000 to $34,999 | 134 (8.5%) | 119 (6.7%) |
| $35,000 to $49,999 | 268 (17.1%) | 75 (4.2%) |
| $50,000 to $74,999 | 315 (20.1%) | 168 (9.5%) |
| $75,000 to $99,999 | 294 (18.7%) | 427 (24.1%) |
| $100,000 to $149,999 | 123 (7.8%) | 367 (20.7%) |
| $150,000 or more | 75 (4.8%) | 460 (25.9%) |
| Total | 1,571 (100.0%) | 1,773 (100.0%) |
Property Value to Household Income Ratio in Fostoria
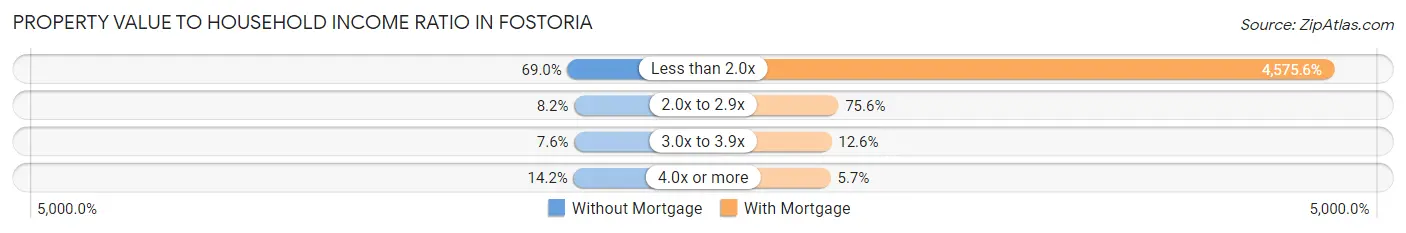
| Value-to-Income Ratio | Without Mortgage | With Mortgage |
| Less than 2.0x | 1,084 (69.0%) | 81,125 (4,575.6%) |
| 2.0x to 2.9x | 129 (8.2%) | 1,341 (75.6%) |
| 3.0x to 3.9x | 119 (7.6%) | 223 (12.6%) |
| 4.0x or more | 223 (14.2%) | 101 (5.7%) |
| Total | 1,571 (100.0%) | 1,773 (100.0%) |
Real Estate Taxes by Mortgage Status in Fostoria
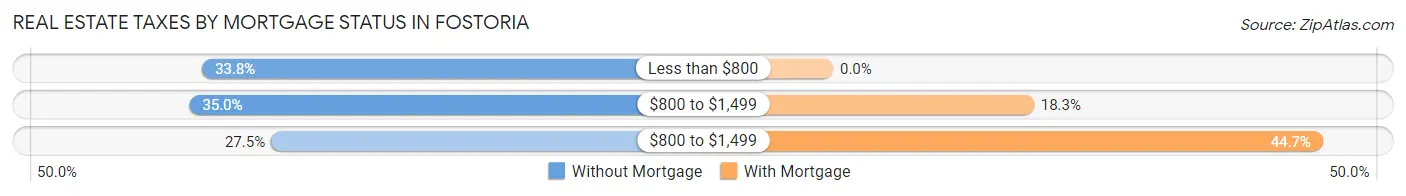
| Property Taxes | Without Mortgage | With Mortgage |
| Less than $800 | 531 (33.8%) | 0 (0.0%) |
| $800 to $1,499 | 549 (34.9%) | 325 (18.3%) |
| $800 to $1,499 | 432 (27.5%) | 793 (44.7%) |
| Total | 1,571 (100.0%) | 1,773 (100.0%) |
Health & Disability in Fostoria
Health Insurance Coverage by Age in Fostoria
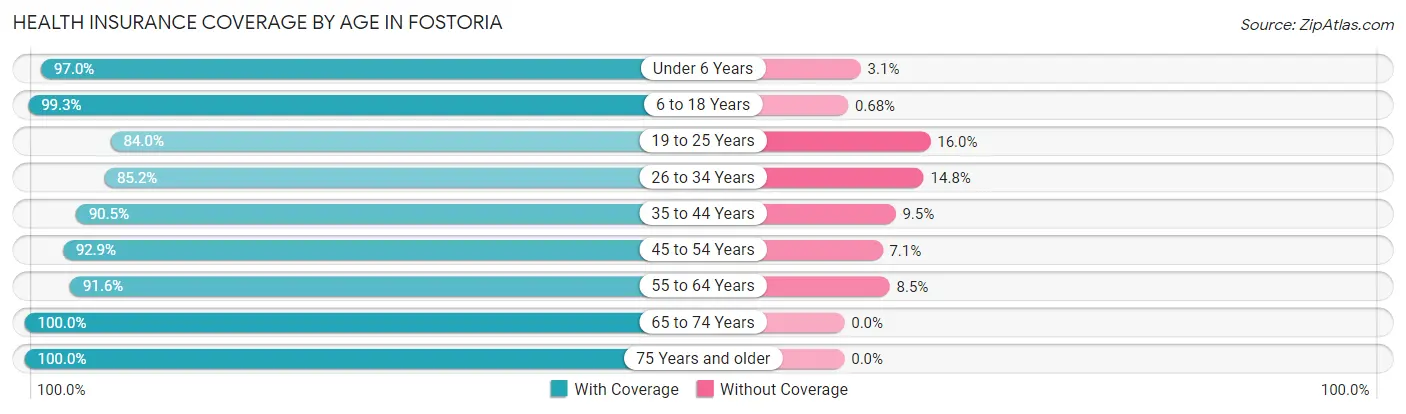
| Age Bracket | With Coverage | Without Coverage |
| Under 6 Years | 1,207 (97.0%) | 38 (3.0%) |
| 6 to 18 Years | 2,036 (99.3%) | 14 (0.7%) |
| 19 to 25 Years | 1,246 (84.0%) | 238 (16.0%) |
| 26 to 34 Years | 1,180 (85.2%) | 205 (14.8%) |
| 35 to 44 Years | 1,204 (90.5%) | 127 (9.5%) |
| 45 to 54 Years | 1,189 (92.9%) | 91 (7.1%) |
| 55 to 64 Years | 1,767 (91.5%) | 163 (8.5%) |
| 65 to 74 Years | 1,229 (100.0%) | 0 (0.0%) |
| 75 Years and older | 651 (100.0%) | 0 (0.0%) |
| Total | 11,709 (93.0%) | 876 (7.0%) |
Health Insurance Coverage by Citizenship Status in Fostoria
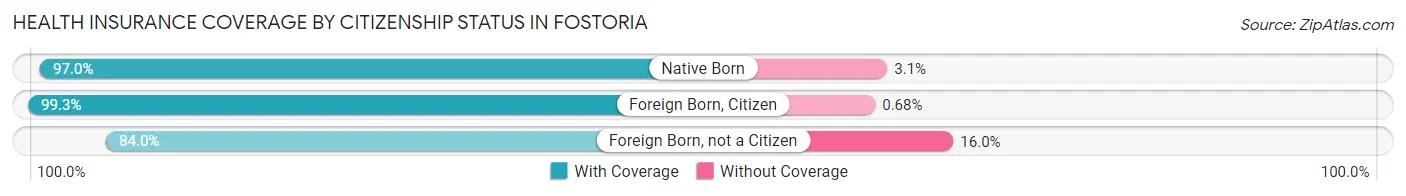
| Citizenship Status | With Coverage | Without Coverage |
| Native Born | 1,207 (97.0%) | 38 (3.0%) |
| Foreign Born, Citizen | 2,036 (99.3%) | 14 (0.7%) |
| Foreign Born, not a Citizen | 1,246 (84.0%) | 238 (16.0%) |
Health Insurance Coverage by Household Income in Fostoria
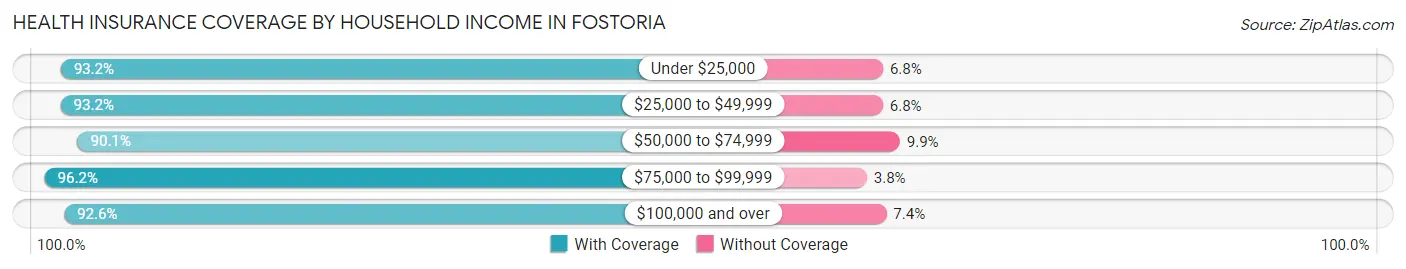
| Household Income | With Coverage | Without Coverage |
| Under $25,000 | 2,094 (93.2%) | 152 (6.8%) |
| $25,000 to $49,999 | 1,985 (93.2%) | 144 (6.8%) |
| $50,000 to $74,999 | 2,501 (90.1%) | 276 (9.9%) |
| $75,000 to $99,999 | 2,583 (96.2%) | 101 (3.8%) |
| $100,000 and over | 2,533 (92.6%) | 203 (7.4%) |
Public vs Private Health Insurance Coverage by Age in Fostoria
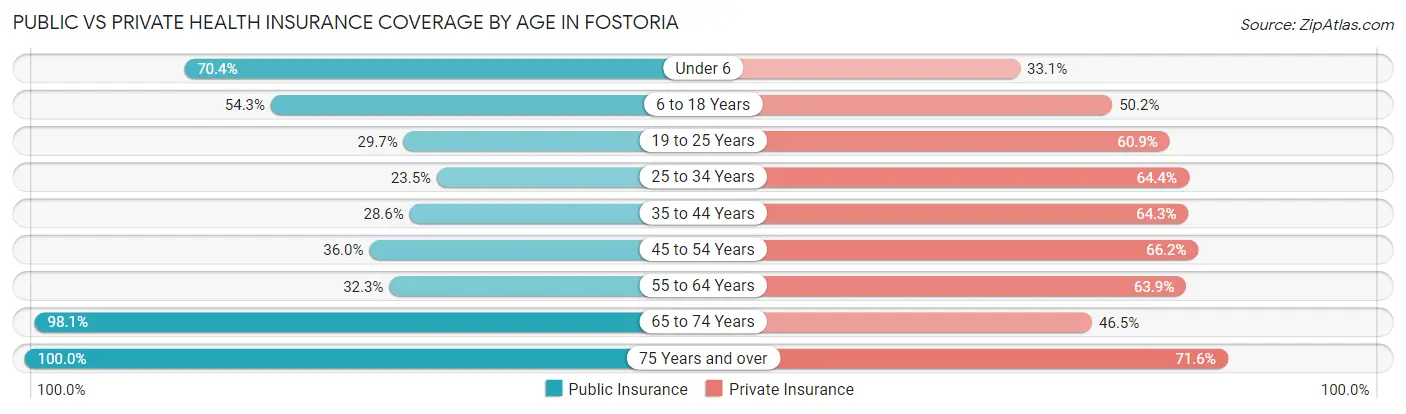
| Age Bracket | Public Insurance | Private Insurance |
| Under 6 | 876 (70.4%) | 412 (33.1%) |
| 6 to 18 Years | 1,113 (54.3%) | 1,029 (50.2%) |
| 19 to 25 Years | 440 (29.6%) | 903 (60.9%) |
| 25 to 34 Years | 325 (23.5%) | 892 (64.4%) |
| 35 to 44 Years | 380 (28.5%) | 856 (64.3%) |
| 45 to 54 Years | 461 (36.0%) | 847 (66.2%) |
| 55 to 64 Years | 624 (32.3%) | 1,233 (63.9%) |
| 65 to 74 Years | 1,206 (98.1%) | 571 (46.5%) |
| 75 Years and over | 651 (100.0%) | 466 (71.6%) |
| Total | 6,076 (48.3%) | 7,209 (57.3%) |
Disability Status by Sex by Age in Fostoria
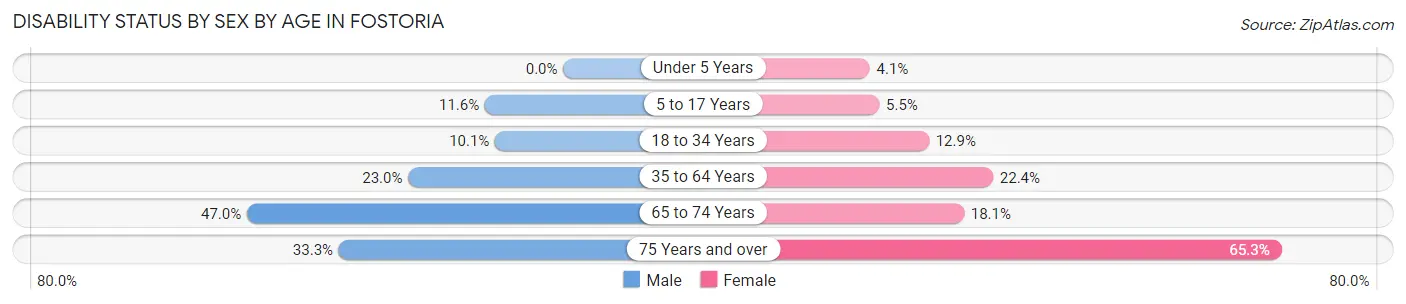
| Age Bracket | Male | Female |
| Under 5 Years | 0 (0.0%) | 25 (4.1%) |
| 5 to 17 Years | 136 (11.6%) | 52 (5.5%) |
| 18 to 34 Years | 147 (10.1%) | 194 (12.9%) |
| 35 to 64 Years | 519 (23.0%) | 513 (22.4%) |
| 65 to 74 Years | 287 (47.0%) | 112 (18.1%) |
| 75 Years and over | 96 (33.3%) | 237 (65.3%) |
Disability Class by Sex by Age in Fostoria
Disability Class: Hearing Difficulty
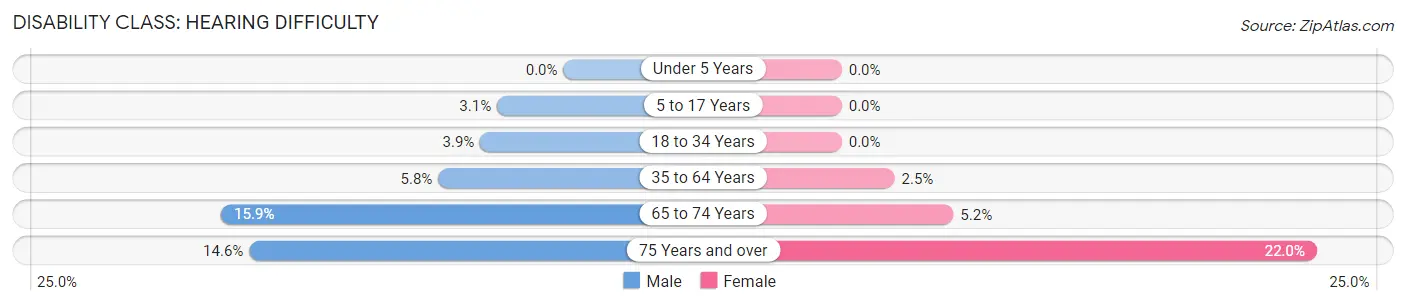
| Age Bracket | Male | Female |
| Under 5 Years | 0 (0.0%) | 0 (0.0%) |
| 5 to 17 Years | 36 (3.1%) | 0 (0.0%) |
| 18 to 34 Years | 56 (3.9%) | 0 (0.0%) |
| 35 to 64 Years | 131 (5.8%) | 56 (2.5%) |
| 65 to 74 Years | 97 (15.9%) | 32 (5.2%) |
| 75 Years and over | 42 (14.6%) | 80 (22.0%) |
Disability Class: Vision Difficulty
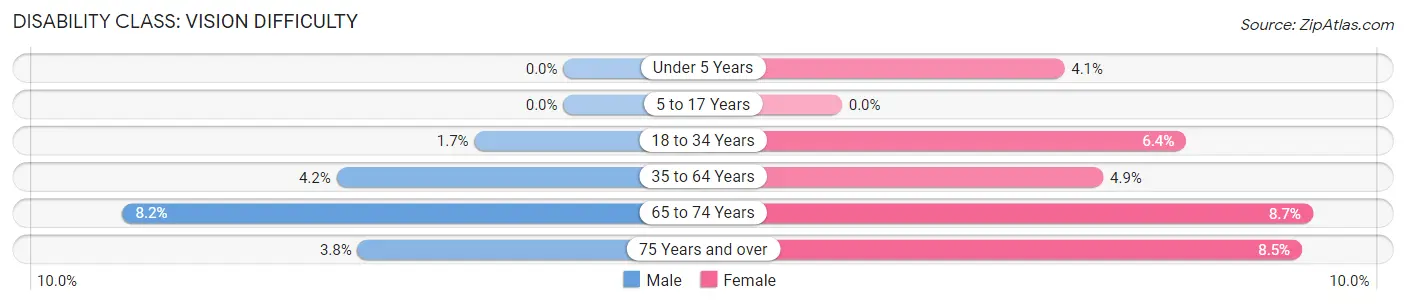
| Age Bracket | Male | Female |
| Under 5 Years | 0 (0.0%) | 25 (4.1%) |
| 5 to 17 Years | 0 (0.0%) | 0 (0.0%) |
| 18 to 34 Years | 24 (1.7%) | 96 (6.4%) |
| 35 to 64 Years | 95 (4.2%) | 111 (4.9%) |
| 65 to 74 Years | 50 (8.2%) | 54 (8.7%) |
| 75 Years and over | 11 (3.8%) | 31 (8.5%) |
Disability Class: Cognitive Difficulty
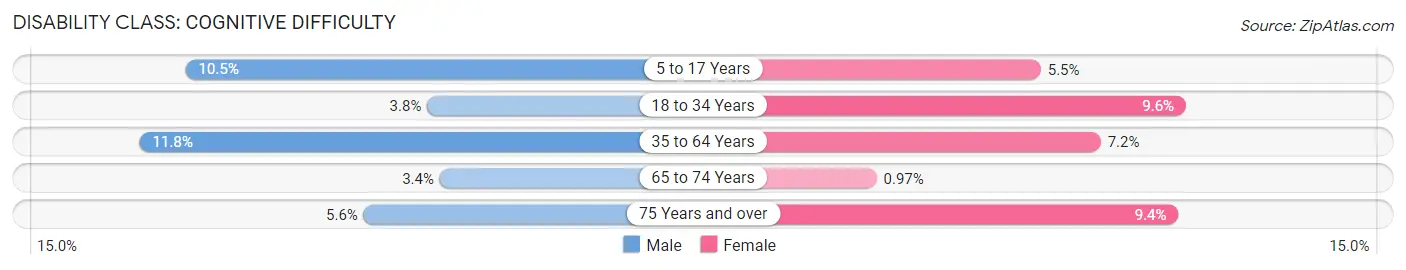
| Age Bracket | Male | Female |
| 5 to 17 Years | 123 (10.5%) | 52 (5.5%) |
| 18 to 34 Years | 55 (3.8%) | 144 (9.6%) |
| 35 to 64 Years | 266 (11.8%) | 165 (7.2%) |
| 65 to 74 Years | 21 (3.4%) | 6 (1.0%) |
| 75 Years and over | 16 (5.6%) | 34 (9.4%) |
Disability Class: Ambulatory Difficulty
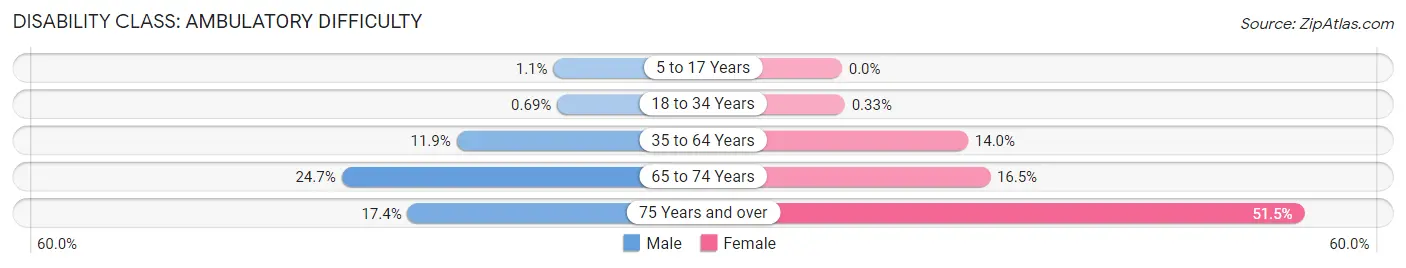
| Age Bracket | Male | Female |
| 5 to 17 Years | 13 (1.1%) | 0 (0.0%) |
| 18 to 34 Years | 10 (0.7%) | 5 (0.3%) |
| 35 to 64 Years | 268 (11.9%) | 321 (14.0%) |
| 65 to 74 Years | 151 (24.7%) | 102 (16.5%) |
| 75 Years and over | 50 (17.4%) | 187 (51.5%) |
Disability Class: Self-Care Difficulty
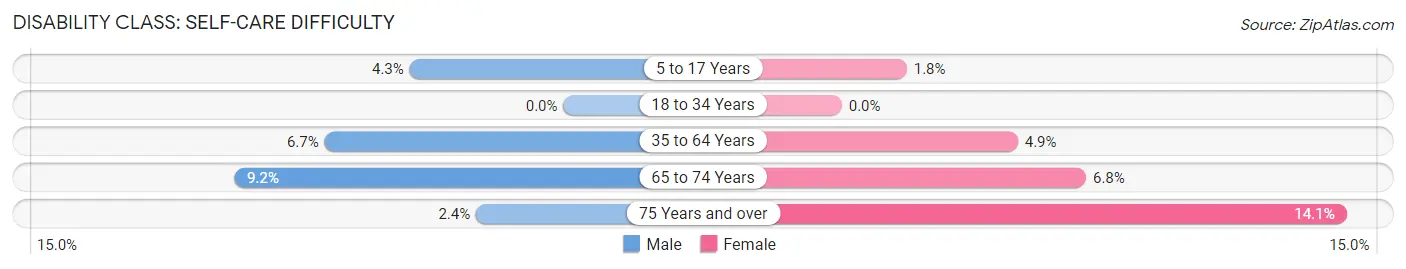
| Age Bracket | Male | Female |
| 5 to 17 Years | 50 (4.3%) | 17 (1.8%) |
| 18 to 34 Years | 0 (0.0%) | 0 (0.0%) |
| 35 to 64 Years | 150 (6.7%) | 112 (4.9%) |
| 65 to 74 Years | 56 (9.2%) | 42 (6.8%) |
| 75 Years and over | 7 (2.4%) | 51 (14.1%) |
Technology Access in Fostoria
Computing Device Access in Fostoria
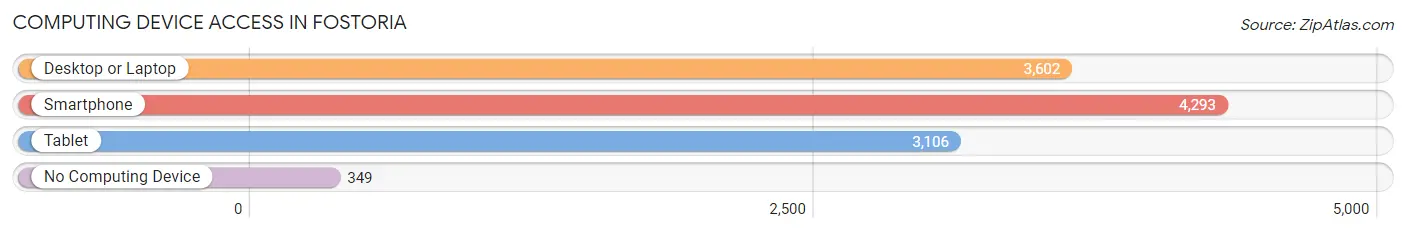
| Device Type | # Households | % Households |
| Desktop or Laptop | 3,602 | 70.7% |
| Smartphone | 4,293 | 84.3% |
| Tablet | 3,106 | 61.0% |
| No Computing Device | 349 | 6.9% |
| Total | 5,092 | 100.0% |
Internet Access in Fostoria
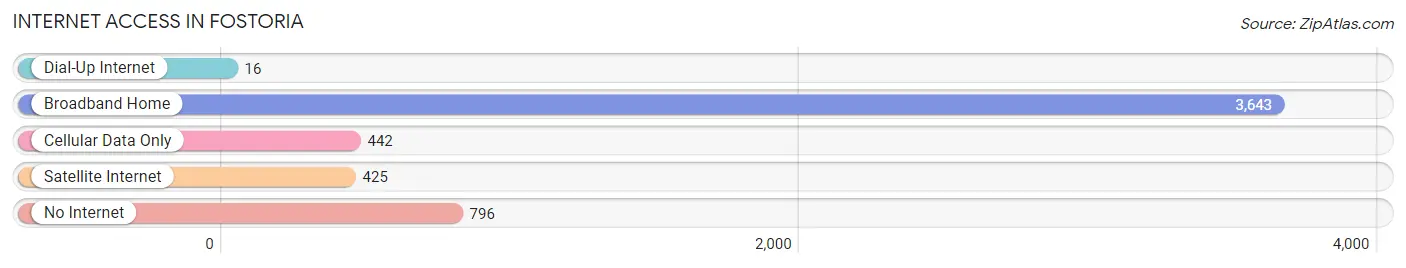
| Internet Type | # Households | % Households |
| Dial-Up Internet | 16 | 0.3% |
| Broadband Home | 3,643 | 71.5% |
| Cellular Data Only | 442 | 8.7% |
| Satellite Internet | 425 | 8.4% |
| No Internet | 796 | 15.6% |
| Total | 5,092 | 100.0% |
Fostoria Summary
Fostoria, Ohio is a city located in Seneca County, Ohio, United States. The population was 13,441 at the 2010 census. It is the county seat of Seneca County. Fostoria is approximately 40 miles southeast of Toledo and 75 miles northwest of Columbus.
History
Fostoria was founded in 1854 by two brothers, William and James Foster, who purchased land in the area and named it after themselves. The city was incorporated in 1867 and was a major railroad hub in the late 19th and early 20th centuries. The city was also home to the Fostoria Glass Company, which was founded in 1887 and produced a variety of glassware until it closed in 1986.
Geography
Fostoria is located at 41°10'25" North, 83°25'17" West (41.173611, -83.421389). According to the United States Census Bureau, the city has a total area of 8.2 square miles, all land.
Economy
Fostoria is home to several major employers, including Whirlpool Corporation, Fostoria Community Hospital, and Fostoria Manufacturing Company. The city also has a variety of small businesses, including restaurants, retail stores, and service providers.
Demographics
As of the 2010 census, there were 13,441 people, 5,541 households, and 3,541 families residing in the city. The population density was 1,637.2 people per square mile. The racial makeup of the city was 90.2% White, 5.3% African American, 0.3% Native American, 0.7% Asian, 0.1% Pacific Islander, 1.2% from other races, and 2.3% from two or more races. Hispanic or Latino of any race were 3.2% of the population.
The median income for a household in the city was $35,945, and the median income for a family was $45,945. The per capita income for the city was $18,945. About 11.2% of families and 14.2% of the population were below the poverty line, including 20.2% of those under age 18 and 8.2% of those age 65 or over.
Conclusion
Fostoria, Ohio is a city located in Seneca County, Ohio, United States. The city was founded in 1854 and was a major railroad hub in the late 19th and early 20th centuries. It is home to several major employers, including Whirlpool Corporation, Fostoria Community Hospital, and Fostoria Manufacturing Company. As of the 2010 census, the population was 13,441. The median income for a household in the city was $35,945, and the median income for a family was $45,945. The city has a variety of small businesses, including restaurants, retail stores, and service providers.
Common Questions
What is Per Capita Income in Fostoria?
Per Capita income in Fostoria is $26,669.
What is the Median Family Income in Fostoria?
Median Family Income in Fostoria is $66,286.
What is the Median Household income in Fostoria?
Median Household Income in Fostoria is $53,145.
What is Income or Wage Gap in Fostoria?
Income or Wage Gap in Fostoria is 30.2%.
Women in Fostoria earn 69.8 cents for every dollar earned by a man.
What is Family Income Deficit in Fostoria?
Family Income Deficit in Fostoria is $12,827.
Families that are below poverty line in Fostoria earn $12,827 less on average than the poverty threshold level.
What is Inequality or Gini Index in Fostoria?
Inequality or Gini Index in Fostoria is 0.42.
What is the Total Population of Fostoria?
Total Population of Fostoria is 12,904.
What is the Total Male Population of Fostoria?
Total Male Population of Fostoria is 6,347.
What is the Total Female Population of Fostoria?
Total Female Population of Fostoria is 6,557.
What is the Ratio of Males per 100 Females in Fostoria?
There are 96.80 Males per 100 Females in Fostoria.
What is the Ratio of Females per 100 Males in Fostoria?
There are 103.31 Females per 100 Males in Fostoria.
What is the Median Population Age in Fostoria?
Median Population Age in Fostoria is 37.4 Years.
What is the Average Family Size in Fostoria
Average Family Size in Fostoria is 3.1 People.
What is the Average Household Size in Fostoria
Average Household Size in Fostoria is 2.5 People.
How Large is the Labor Force in Fostoria?
There are 6,240 People in the Labor Forcein in Fostoria.
What is the Percentage of People in the Labor Force in Fostoria?
61.8% of People are in the Labor Force in Fostoria.
What is the Unemployment Rate in Fostoria?
Unemployment Rate in Fostoria is 5.8%.