Zip Codes with the Most Immigrants from South America in Cincinnati, OH
RELATED REPORTS & OPTIONS
South America
Cincinnati
Compare Zip Codes
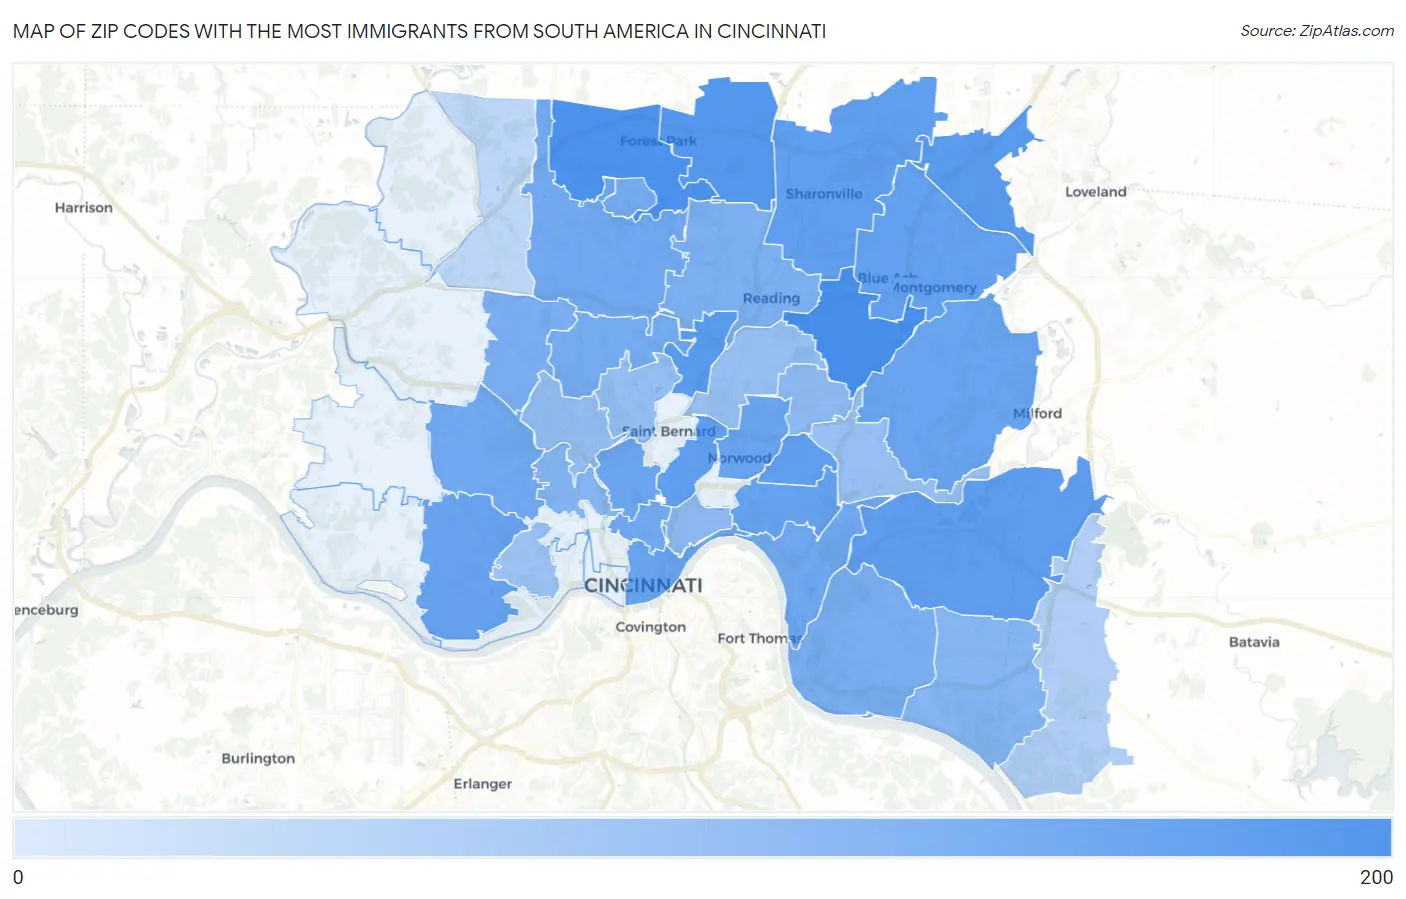
Map of Zip Codes with the Most Immigrants from South America in Cincinnati
2
186
Zip Codes with the Most Immigrants from South America in Cincinnati, OH
| Zip Code | South America | vs State | vs National | |
| 1. | 45236 | 186 | 22,909(0.81%)#27 | 3,636,375(0.01%)#3,519 |
| 2. | 45240 | 161 | 22,909(0.70%)#35 | 3,636,375(0.00%)#3,825 |
| 3. | 45246 | 117 | 22,909(0.51%)#50 | 3,636,375(0.00%)#4,647 |
| 4. | 45249 | 109 | 22,909(0.48%)#57 | 3,636,375(0.00%)#4,824 |
| 5. | 45216 | 105 | 22,909(0.46%)#58 | 3,636,375(0.00%)#4,917 |
| 6. | 45244 | 82 | 22,909(0.36%)#76 | 3,636,375(0.00%)#5,489 |
| 7. | 45209 | 79 | 22,909(0.34%)#85 | 3,636,375(0.00%)#5,600 |
| 8. | 45241 | 75 | 22,909(0.33%)#88 | 3,636,375(0.00%)#5,715 |
| 9. | 45229 | 74 | 22,909(0.32%)#90 | 3,636,375(0.00%)#5,763 |
| 10. | 45242 | 73 | 22,909(0.32%)#92 | 3,636,375(0.00%)#5,796 |
| 11. | 45208 | 64 | 22,909(0.28%)#113 | 3,636,375(0.00%)#6,133 |
| 12. | 45238 | 62 | 22,909(0.27%)#116 | 3,636,375(0.00%)#6,192 |
| 13. | 45243 | 56 | 22,909(0.24%)#124 | 3,636,375(0.00%)#6,470 |
| 14. | 45212 | 54 | 22,909(0.24%)#128 | 3,636,375(0.00%)#6,557 |
| 15. | 45202 | 54 | 22,909(0.24%)#129 | 3,636,375(0.00%)#6,566 |
| 16. | 45220 | 51 | 22,909(0.22%)#136 | 3,636,375(0.00%)#6,701 |
| 17. | 45211 | 44 | 22,909(0.19%)#149 | 3,636,375(0.00%)#7,036 |
| 18. | 45219 | 44 | 22,909(0.19%)#152 | 3,636,375(0.00%)#7,053 |
| 19. | 45231 | 43 | 22,909(0.19%)#153 | 3,636,375(0.00%)#7,090 |
| 20. | 45226 | 43 | 22,909(0.19%)#156 | 3,636,375(0.00%)#7,134 |
| 21. | 45224 | 37 | 22,909(0.16%)#166 | 3,636,375(0.00%)#7,476 |
| 22. | 45218 | 36 | 22,909(0.16%)#170 | 3,636,375(0.00%)#7,578 |
| 23. | 45239 | 32 | 22,909(0.14%)#181 | 3,636,375(0.00%)#7,807 |
| 24. | 45230 | 30 | 22,909(0.13%)#187 | 3,636,375(0.00%)#7,961 |
| 25. | 45215 | 28 | 22,909(0.12%)#195 | 3,636,375(0.00%)#8,125 |
| 26. | 45255 | 20 | 22,909(0.09%)#226 | 3,636,375(0.00%)#8,868 |
| 27. | 45225 | 20 | 22,909(0.09%)#230 | 3,636,375(0.00%)#8,907 |
| 28. | 45206 | 16 | 22,909(0.07%)#250 | 3,636,375(0.00%)#9,392 |
| 29. | 45213 | 14 | 22,909(0.06%)#266 | 3,636,375(0.00%)#9,658 |
| 30. | 45223 | 12 | 22,909(0.05%)#279 | 3,636,375(0.00%)#9,945 |
| 31. | 45237 | 11 | 22,909(0.05%)#283 | 3,636,375(0.00%)#10,088 |
| 32. | 45232 | 11 | 22,909(0.05%)#287 | 3,636,375(0.00%)#10,137 |
| 33. | 45227 | 10 | 22,909(0.04%)#291 | 3,636,375(0.00%)#10,250 |
| 34. | 45205 | 9 | 22,909(0.04%)#300 | 3,636,375(0.00%)#10,446 |
| 35. | 45245 | 4 | 22,909(0.02%)#342 | 3,636,375(0.00%)#11,490 |
| 36. | 45251 | 2 | 22,909(0.01%)#359 | 3,636,375(0.00%)#11,990 |
1
Common Questions
What are the Top 10 Zip Codes with the Most Immigrants from South America in Cincinnati, OH?
Top 10 Zip Codes with the Most Immigrants from South America in Cincinnati, OH are:
What zip code has the Most Immigrants from South America in Cincinnati, OH?
45236 has the Most Immigrants from South America in Cincinnati, OH with 186.
What is the Total Immigrants from South America in Cincinnati, OH?
Total Immigrants from South America in Cincinnati is 673.
What is the Total Immigrants from South America in Ohio?
Total Immigrants from South America in Ohio is 22,909.
What is the Total Immigrants from South America in the United States?
Total Immigrants from South America in the United States is 3,636,375.