Zip Codes with the Highest Percentage of Population with a Degree in Education in Cincinnati, OH
RELATED REPORTS & OPTIONS
Education
Cincinnati
Compare Zip Codes
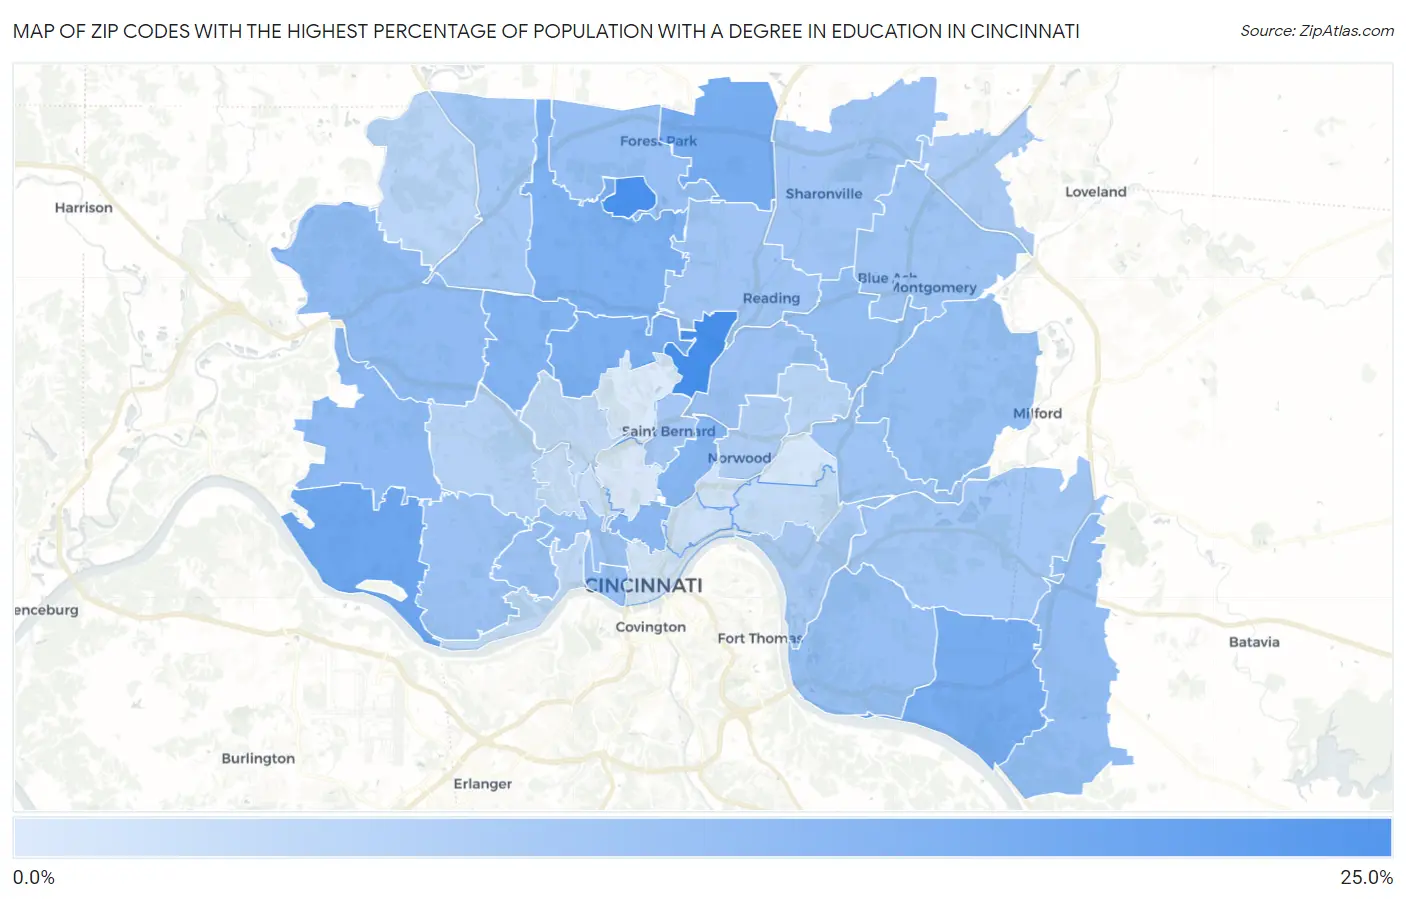
Map of Zip Codes with the Highest Percentage of Population with a Degree in Education in Cincinnati
4.1%
20.7%
Zip Codes with the Highest Percentage of Population with a Degree in Education in Cincinnati, OH
| Zip Code | % Graduates | vs State | vs National | |
| 1. | 45216 | 20.7% | 14.4%(+6.39)#422 | 11.1%(+9.69)#9,902 |
| 2. | 45218 | 20.6% | 14.4%(+6.23)#425 | 11.1%(+9.53)#10,028 |
| 3. | 45233 | 16.2% | 14.4%(+1.79)#619 | 11.1%(+5.09)#14,353 |
| 4. | 45255 | 15.0% | 14.4%(+0.680)#670 | 11.1%(+3.98)#15,629 |
| 5. | 45246 | 15.0% | 14.4%(+0.632)#673 | 11.1%(+3.93)#15,715 |
| 6. | 45224 | 14.7% | 14.4%(+0.313)#692 | 11.1%(+3.61)#16,117 |
| 7. | 45231 | 14.3% | 14.4%(-0.071)#720 | 11.1%(+3.23)#16,604 |
| 8. | 45239 | 13.8% | 14.4%(-0.531)#749 | 11.1%(+2.77)#17,227 |
| 9. | 45229 | 13.3% | 14.4%(-1.03)#772 | 11.1%(+2.27)#17,864 |
| 10. | 45219 | 12.7% | 14.4%(-1.63)#798 | 11.1%(+1.67)#18,607 |
| 11. | 45248 | 12.5% | 14.4%(-1.90)#817 | 11.1%(+1.40)#18,994 |
| 12. | 45247 | 12.2% | 14.4%(-2.14)#828 | 11.1%(+1.17)#19,298 |
| 13. | 45245 | 12.0% | 14.4%(-2.33)#837 | 11.1%(+0.969)#19,581 |
| 14. | 45236 | 11.7% | 14.4%(-2.65)#854 | 11.1%(+0.655)#20,022 |
| 15. | 45243 | 11.6% | 14.4%(-2.73)#859 | 11.1%(+0.572)#20,118 |
| 16. | 45203 | 11.5% | 14.4%(-2.85)#863 | 11.1%(+0.449)#20,285 |
| 17. | 45230 | 11.5% | 14.4%(-2.89)#866 | 11.1%(+0.414)#20,325 |
| 18. | 45240 | 11.3% | 14.4%(-3.01)#871 | 11.1%(+0.291)#20,484 |
| 19. | 45214 | 11.3% | 14.4%(-3.05)#873 | 11.1%(+0.253)#20,529 |
| 20. | 45205 | 11.0% | 14.4%(-3.36)#890 | 11.1%(-0.061)#20,971 |
| 21. | 45238 | 11.0% | 14.4%(-3.37)#891 | 11.1%(-0.067)#20,978 |
| 22. | 45237 | 10.8% | 14.4%(-3.52)#899 | 11.1%(-0.216)#21,171 |
| 23. | 45242 | 10.8% | 14.4%(-3.58)#905 | 11.1%(-0.275)#21,248 |
| 24. | 45227 | 10.8% | 14.4%(-3.59)#908 | 11.1%(-0.289)#21,260 |
| 25. | 45241 | 10.6% | 14.4%(-3.81)#918 | 11.1%(-0.504)#21,578 |
| 26. | 45215 | 10.3% | 14.4%(-4.02)#929 | 11.1%(-0.717)#21,868 |
| 27. | 45251 | 10.3% | 14.4%(-4.04)#931 | 11.1%(-0.738)#21,887 |
| 28. | 45244 | 10.2% | 14.4%(-4.20)#934 | 11.1%(-0.900)#22,114 |
| 29. | 45217 | 9.9% | 14.4%(-4.48)#945 | 11.1%(-1.18)#22,529 |
| 30. | 45249 | 9.6% | 14.4%(-4.80)#965 | 11.1%(-1.50)#22,930 |
| 31. | 45226 | 9.4% | 14.4%(-4.94)#970 | 11.1%(-1.64)#23,110 |
| 32. | 45212 | 8.9% | 14.4%(-5.44)#987 | 11.1%(-2.14)#23,795 |
| 33. | 45211 | 8.2% | 14.4%(-6.13)#1,001 | 11.1%(-2.83)#24,601 |
| 34. | 45252 | 7.8% | 14.4%(-6.55)#1,009 | 11.1%(-3.25)#25,084 |
| 35. | 45213 | 7.7% | 14.4%(-6.68)#1,012 | 11.1%(-3.38)#25,221 |
| 36. | 45204 | 7.2% | 14.4%(-7.13)#1,022 | 11.1%(-3.82)#25,668 |
| 37. | 45223 | 7.0% | 14.4%(-7.38)#1,027 | 11.1%(-4.08)#25,954 |
| 38. | 45208 | 6.4% | 14.4%(-7.95)#1,034 | 11.1%(-4.65)#26,466 |
| 39. | 45225 | 6.1% | 14.4%(-8.21)#1,036 | 11.1%(-4.91)#26,698 |
| 40. | 45206 | 5.7% | 14.4%(-8.66)#1,047 | 11.1%(-5.36)#27,065 |
| 41. | 45207 | 5.3% | 14.4%(-9.09)#1,053 | 11.1%(-5.79)#27,374 |
| 42. | 45202 | 5.2% | 14.4%(-9.16)#1,055 | 11.1%(-5.86)#27,427 |
| 43. | 45209 | 4.8% | 14.4%(-9.58)#1,063 | 11.1%(-6.28)#27,698 |
| 44. | 45220 | 4.3% | 14.4%(-10.0)#1,069 | 11.1%(-6.72)#27,990 |
| 45. | 45232 | 4.1% | 14.4%(-10.3)#1,073 | 11.1%(-6.97)#28,143 |
1
Common Questions
What are the Top 10 Zip Codes with the Highest Percentage of Population with a Degree in Education in Cincinnati, OH?
Top 10 Zip Codes with the Highest Percentage of Population with a Degree in Education in Cincinnati, OH are:
What zip code has the Highest Percentage of Population with a Degree in Education in Cincinnati, OH?
45216 has the Highest Percentage of Population with a Degree in Education in Cincinnati, OH with 20.7%.
What is the Percentage of Population with a Degree in Education in Cincinnati, OH?
Percentage of Population with a Degree in Education in Cincinnati is 8.0%.
What is the Percentage of Population with a Degree in Education in Ohio?
Percentage of Population with a Degree in Education in Ohio is 14.4%.
What is the Percentage of Population with a Degree in Education in the United States?
Percentage of Population with a Degree in Education in the United States is 11.1%.