Zip Codes with the Highest Percentage of Population Employed in Education, Arts & Media in Cincinnati, OH
RELATED REPORTS & OPTIONS
Education, Arts & Media
Cincinnati
Compare Zip Codes
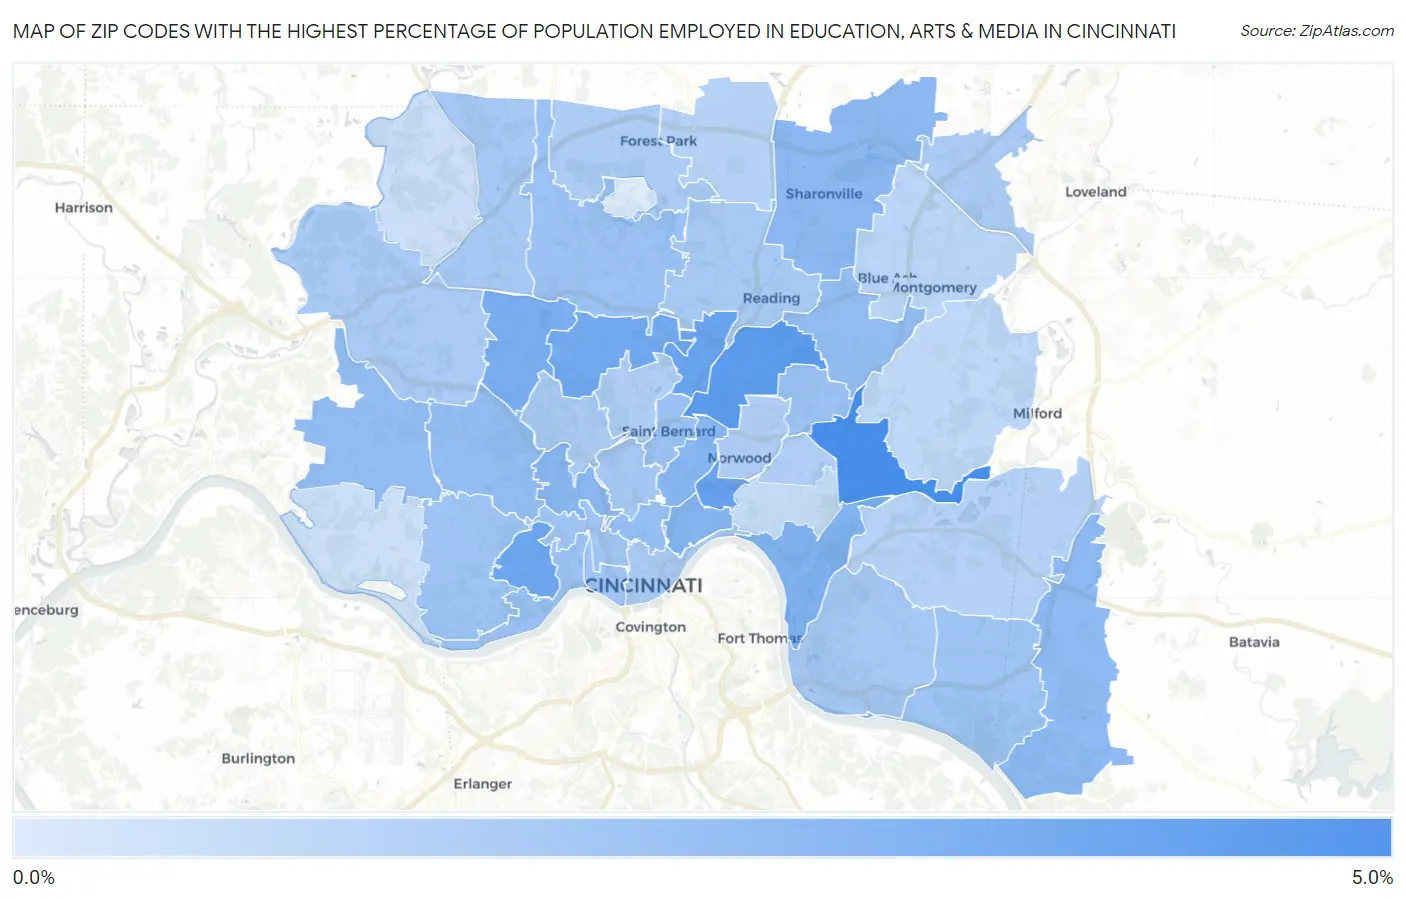
Map of Zip Codes with the Highest Percentage of Population Employed in Education, Arts & Media in Cincinnati
0.32%
4.6%
Zip Codes with the Highest Percentage of Population Employed in Education, Arts & Media in Cincinnati, OH
| Zip Code | % Employed | vs State | vs National | |
| 1. | 45227 | 4.6% | 1.8%(+2.72)#73 | 1.8%(+2.77)#1,861 |
| 2. | 45237 | 4.0% | 1.8%(+2.16)#93 | 1.8%(+2.20)#2,465 |
| 3. | 45207 | 3.6% | 1.8%(+1.81)#113 | 1.8%(+1.85)#3,038 |
| 4. | 45216 | 3.6% | 1.8%(+1.76)#117 | 1.8%(+1.81)#3,100 |
| 5. | 45205 | 3.4% | 1.8%(+1.61)#127 | 1.8%(+1.66)#3,388 |
| 6. | 45224 | 3.3% | 1.8%(+1.49)#138 | 1.8%(+1.54)#3,651 |
| 7. | 45239 | 3.1% | 1.8%(+1.28)#153 | 1.8%(+1.32)#4,181 |
| 8. | 45226 | 2.9% | 1.8%(+1.10)#174 | 1.8%(+1.14)#4,740 |
| 9. | 45206 | 2.8% | 1.8%(+0.943)#194 | 1.8%(+0.984)#5,318 |
| 10. | 45229 | 2.7% | 1.8%(+0.881)#205 | 1.8%(+0.923)#5,562 |
| 11. | 45225 | 2.6% | 1.8%(+0.822)#224 | 1.8%(+0.863)#5,824 |
| 12. | 45241 | 2.6% | 1.8%(+0.753)#237 | 1.8%(+0.794)#6,118 |
| 13. | 45245 | 2.5% | 1.8%(+0.698)#257 | 1.8%(+0.740)#6,401 |
| 14. | 45236 | 2.4% | 1.8%(+0.568)#273 | 1.8%(+0.610)#7,064 |
| 15. | 45211 | 2.4% | 1.8%(+0.564)#274 | 1.8%(+0.605)#7,092 |
| 16. | 45248 | 2.3% | 1.8%(+0.522)#284 | 1.8%(+0.564)#7,314 |
| 17. | 45219 | 2.3% | 1.8%(+0.474)#290 | 1.8%(+0.516)#7,599 |
| 18. | 45204 | 2.2% | 1.8%(+0.388)#310 | 1.8%(+0.430)#8,102 |
| 19. | 45217 | 2.2% | 1.8%(+0.387)#313 | 1.8%(+0.428)#8,112 |
| 20. | 45231 | 2.1% | 1.8%(+0.312)#336 | 1.8%(+0.353)#8,593 |
| 21. | 45213 | 2.1% | 1.8%(+0.266)#344 | 1.8%(+0.307)#8,915 |
| 22. | 45255 | 2.1% | 1.8%(+0.233)#348 | 1.8%(+0.274)#9,144 |
| 23. | 45238 | 2.1% | 1.8%(+0.223)#350 | 1.8%(+0.265)#9,195 |
| 24. | 45203 | 2.0% | 1.8%(+0.176)#363 | 1.8%(+0.218)#9,535 |
| 25. | 45214 | 2.0% | 1.8%(+0.152)#369 | 1.8%(+0.193)#9,716 |
| 26. | 45220 | 1.9% | 1.8%(+0.065)#395 | 1.8%(+0.106)#10,413 |
| 27. | 45230 | 1.9% | 1.8%(+0.053)#400 | 1.8%(+0.094)#10,517 |
| 28. | 45251 | 1.9% | 1.8%(+0.036)#405 | 1.8%(+0.077)#10,652 |
| 29. | 45215 | 1.8% | 1.8%(-0.020)#418 | 1.8%(+0.021)#11,097 |
| 30. | 45223 | 1.8% | 1.8%(-0.074)#441 | 1.8%(-0.033)#11,528 |
| 31. | 45202 | 1.7% | 1.8%(-0.079)#446 | 1.8%(-0.038)#11,570 |
| 32. | 45249 | 1.7% | 1.8%(-0.080)#447 | 1.8%(-0.039)#11,580 |
| 33. | 45247 | 1.7% | 1.8%(-0.087)#448 | 1.8%(-0.046)#11,622 |
| 34. | 45240 | 1.6% | 1.8%(-0.190)#478 | 1.8%(-0.149)#12,516 |
| 35. | 45212 | 1.6% | 1.8%(-0.243)#493 | 1.8%(-0.202)#12,976 |
| 36. | 45232 | 1.5% | 1.8%(-0.284)#505 | 1.8%(-0.243)#13,364 |
| 37. | 45209 | 1.5% | 1.8%(-0.316)#518 | 1.8%(-0.275)#13,680 |
| 38. | 45244 | 1.4% | 1.8%(-0.395)#551 | 1.8%(-0.354)#14,475 |
| 39. | 45246 | 1.4% | 1.8%(-0.409)#557 | 1.8%(-0.368)#14,622 |
| 40. | 45242 | 1.3% | 1.8%(-0.522)#589 | 1.8%(-0.480)#15,606 |
| 41. | 45243 | 1.1% | 1.8%(-0.692)#657 | 1.8%(-0.651)#17,271 |
| 42. | 45208 | 0.95% | 1.8%(-0.873)#723 | 1.8%(-0.832)#18,943 |
| 43. | 45252 | 0.85% | 1.8%(-0.973)#748 | 1.8%(-0.932)#19,797 |
| 44. | 45233 | 0.75% | 1.8%(-1.08)#783 | 1.8%(-1.04)#20,658 |
| 45. | 45218 | 0.32% | 1.8%(-1.51)#890 | 1.8%(-1.47)#23,363 |
1
Common Questions
What are the Top 10 Zip Codes with the Highest Percentage of Population Employed in Education, Arts & Media in Cincinnati, OH?
Top 10 Zip Codes with the Highest Percentage of Population Employed in Education, Arts & Media in Cincinnati, OH are:
What zip code has the Highest Percentage of Population Employed in Education, Arts & Media in Cincinnati, OH?
45227 has the Highest Percentage of Population Employed in Education, Arts & Media in Cincinnati, OH with 4.6%.
What is the Percentage of Population Employed in Education, Arts & Media in Cincinnati, OH?
Percentage of Population Employed in Education, Arts & Media in Cincinnati is 2.4%.
What is the Percentage of Population Employed in Education, Arts & Media in Ohio?
Percentage of Population Employed in Education, Arts & Media in Ohio is 1.8%.
What is the Percentage of Population Employed in Education, Arts & Media in the United States?
Percentage of Population Employed in Education, Arts & Media in the United States is 1.8%.