Zip Codes with the Highest Percentage of Families with Income Above $200,000 in Cincinnati, OH
RELATED REPORTS & OPTIONS
Family Income | $200k+
Cincinnati
Compare Zip Codes
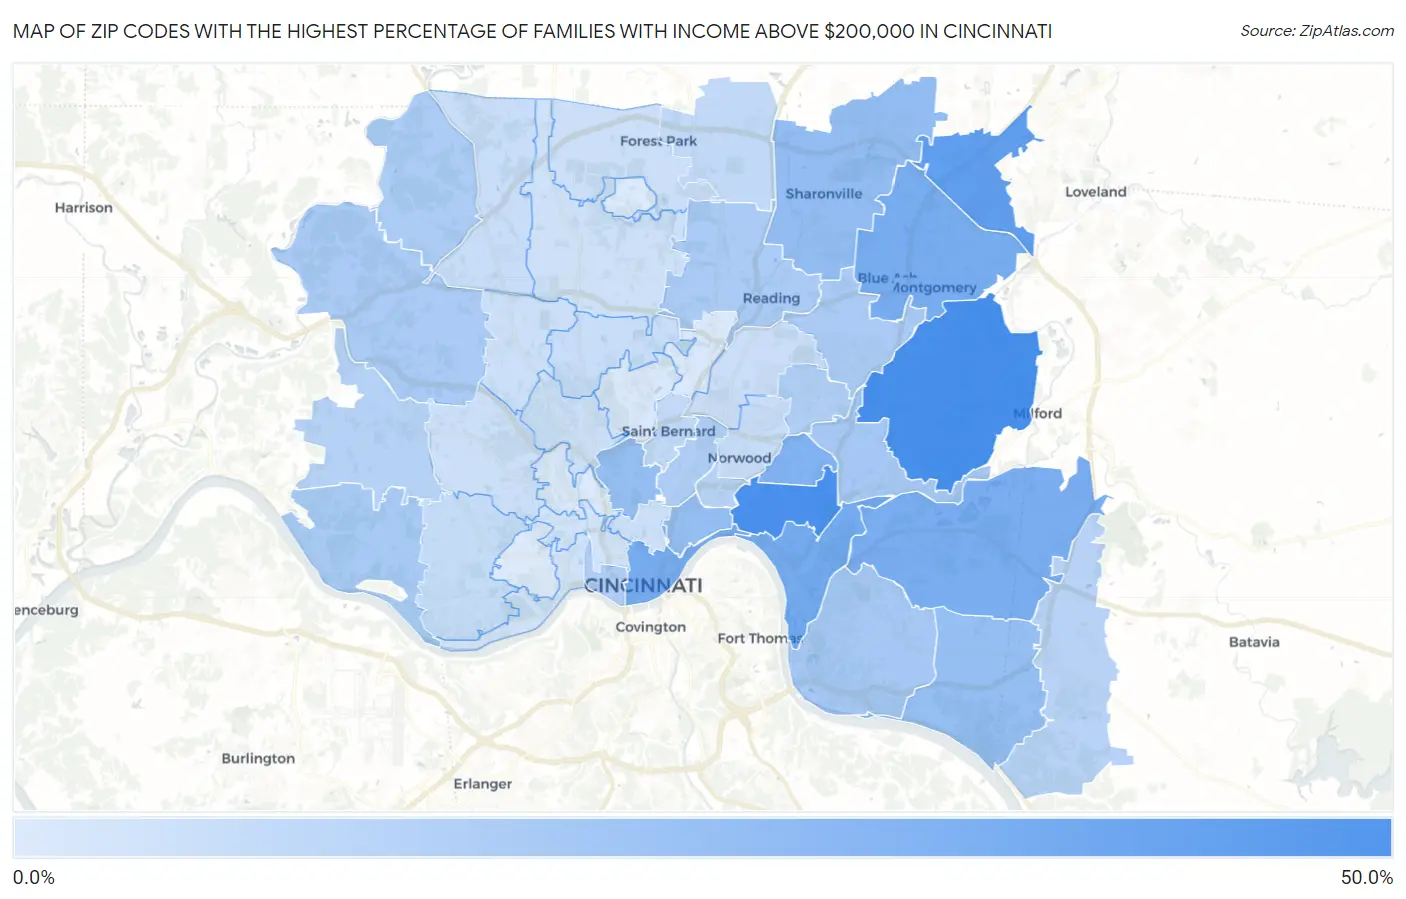
Map of Zip Codes with the Highest Percentage of Families with Income Above $200,000 in Cincinnati
0.60%
49.9%
Zip Codes with the Highest Percentage of Families with Income Above $200,000 in Cincinnati, OH
| Zip Code | Families with Income > $200k | vs State | vs National | |
| 1. | 45243 | 49.9% | 10.8%(+39.1)#10 | 14.8%(+35.1)#675 |
| 2. | 45208 | 48.9% | 10.8%(+38.1)#11 | 14.8%(+34.1)#718 |
| 3. | 45249 | 40.3% | 10.8%(+29.5)#20 | 14.8%(+25.5)#1,282 |
| 4. | 45226 | 32.7% | 10.8%(+21.9)#34 | 14.8%(+17.9)#2,146 |
| 5. | 45242 | 31.5% | 10.8%(+20.7)#41 | 14.8%(+16.7)#2,296 |
| 6. | 45202 | 31.5% | 10.8%(+20.7)#42 | 14.8%(+16.7)#2,297 |
| 7. | 45244 | 30.8% | 10.8%(+20.0)#44 | 14.8%(+16.0)#2,397 |
| 8. | 45209 | 28.7% | 10.8%(+17.9)#55 | 14.8%(+13.9)#2,734 |
| 9. | 45241 | 22.6% | 10.8%(+11.8)#74 | 14.8%(+7.80)#4,043 |
| 10. | 45220 | 21.9% | 10.8%(+11.1)#79 | 14.8%(+7.10)#4,242 |
| 11. | 45206 | 21.7% | 10.8%(+10.9)#80 | 14.8%(+6.90)#4,303 |
| 12. | 45255 | 21.6% | 10.8%(+10.8)#81 | 14.8%(+6.80)#4,329 |
| 13. | 45227 | 16.9% | 10.8%(+6.10)#114 | 14.8%(+2.10)#6,036 |
| 14. | 45230 | 16.8% | 10.8%(+6.00)#116 | 14.8%(+2.00)#6,073 |
| 15. | 45233 | 15.8% | 10.8%(+5.00)#132 | 14.8%(+1.000)#6,546 |
| 16. | 45247 | 15.2% | 10.8%(+4.40)#142 | 14.8%(+0.400)#6,849 |
| 17. | 45215 | 15.1% | 10.8%(+4.30)#146 | 14.8%(+0.300)#6,917 |
| 18. | 45236 | 15.0% | 10.8%(+4.20)#149 | 14.8%(+0.200)#6,983 |
| 19. | 45252 | 14.7% | 10.8%(+3.90)#154 | 14.8%(-0.100)#7,175 |
| 20. | 45229 | 13.9% | 10.8%(+3.10)#169 | 14.8%(-0.900)#7,605 |
| 21. | 45203 | 13.5% | 10.8%(+2.70)#179 | 14.8%(-1.30)#7,890 |
| 22. | 45213 | 13.3% | 10.8%(+2.50)#183 | 14.8%(-1.50)#7,998 |
| 23. | 45248 | 11.9% | 10.8%(+1.10)#215 | 14.8%(-2.90)#9,056 |
| 24. | 45245 | 11.3% | 10.8%(+0.500)#234 | 14.8%(-3.50)#9,541 |
| 25. | 45207 | 11.1% | 10.8%(+0.300)#240 | 14.8%(-3.70)#9,737 |
| 26. | 45246 | 8.4% | 10.8%(-2.40)#343 | 14.8%(-6.40)#12,669 |
| 27. | 45217 | 8.2% | 10.8%(-2.60)#356 | 14.8%(-6.60)#12,957 |
| 28. | 45238 | 6.7% | 10.8%(-4.10)#454 | 14.8%(-8.10)#15,174 |
| 29. | 45212 | 6.6% | 10.8%(-4.20)#465 | 14.8%(-8.20)#15,389 |
| 30. | 45224 | 6.0% | 10.8%(-4.80)#513 | 14.8%(-8.80)#16,452 |
| 31. | 45251 | 6.0% | 10.8%(-4.80)#514 | 14.8%(-8.80)#16,454 |
| 32. | 45237 | 5.9% | 10.8%(-4.90)#526 | 14.8%(-8.90)#16,631 |
| 33. | 45223 | 5.2% | 10.8%(-5.60)#581 | 14.8%(-9.60)#18,025 |
| 34. | 45240 | 5.0% | 10.8%(-5.80)#600 | 14.8%(-9.80)#18,409 |
| 35. | 45219 | 5.0% | 10.8%(-5.80)#603 | 14.8%(-9.80)#18,424 |
| 36. | 45211 | 4.9% | 10.8%(-5.90)#608 | 14.8%(-9.90)#18,599 |
| 37. | 45239 | 4.7% | 10.8%(-6.10)#618 | 14.8%(-10.1)#18,998 |
| 38. | 45231 | 4.3% | 10.8%(-6.50)#639 | 14.8%(-10.5)#19,755 |
| 39. | 45204 | 4.0% | 10.8%(-6.80)#680 | 14.8%(-10.8)#20,455 |
| 40. | 45214 | 3.8% | 10.8%(-7.00)#698 | 14.8%(-11.0)#20,889 |
| 41. | 45216 | 1.5% | 10.8%(-9.30)#906 | 14.8%(-13.3)#25,334 |
| 42. | 45232 | 1.4% | 10.8%(-9.40)#913 | 14.8%(-13.4)#25,478 |
| 43. | 45225 | 1.2% | 10.8%(-9.60)#930 | 14.8%(-13.6)#25,800 |
| 44. | 45205 | 0.70% | 10.8%(-10.1)#954 | 14.8%(-14.1)#26,467 |
| 45. | 45218 | 0.60% | 10.8%(-10.2)#967 | 14.8%(-14.2)#26,617 |
1
Common Questions
What are the Top 10 Zip Codes with the Highest Percentage of Families with Income Above $200,000 in Cincinnati, OH?
Top 10 Zip Codes with the Highest Percentage of Families with Income Above $200,000 in Cincinnati, OH are:
What zip code has the Highest Percentage of Families with Income Above $200,000 in Cincinnati, OH?
45243 has the Highest Percentage of Families with Income Above $200,000 in Cincinnati, OH with 49.9%.
What is the Percentage of Families with Income Above $200,000 in Cincinnati, OH?
Percentage of Families with Income Above $200,000 in Cincinnati is 12.3%.
What is the Percentage of Families with Income Above $200,000 in Ohio?
Percentage of Families with Income Above $200,000 in Ohio is 10.8%.
What is the Percentage of Families with Income Above $200,000 in the United States?
Percentage of Families with Income Above $200,000 in the United States is 14.8%.