Zip Codes with the Highest Percentage of Population Employed in Transportation & Warehousing in Cincinnati, OH
RELATED REPORTS & OPTIONS
Transportation & Warehousing
Cincinnati
Compare Zip Codes
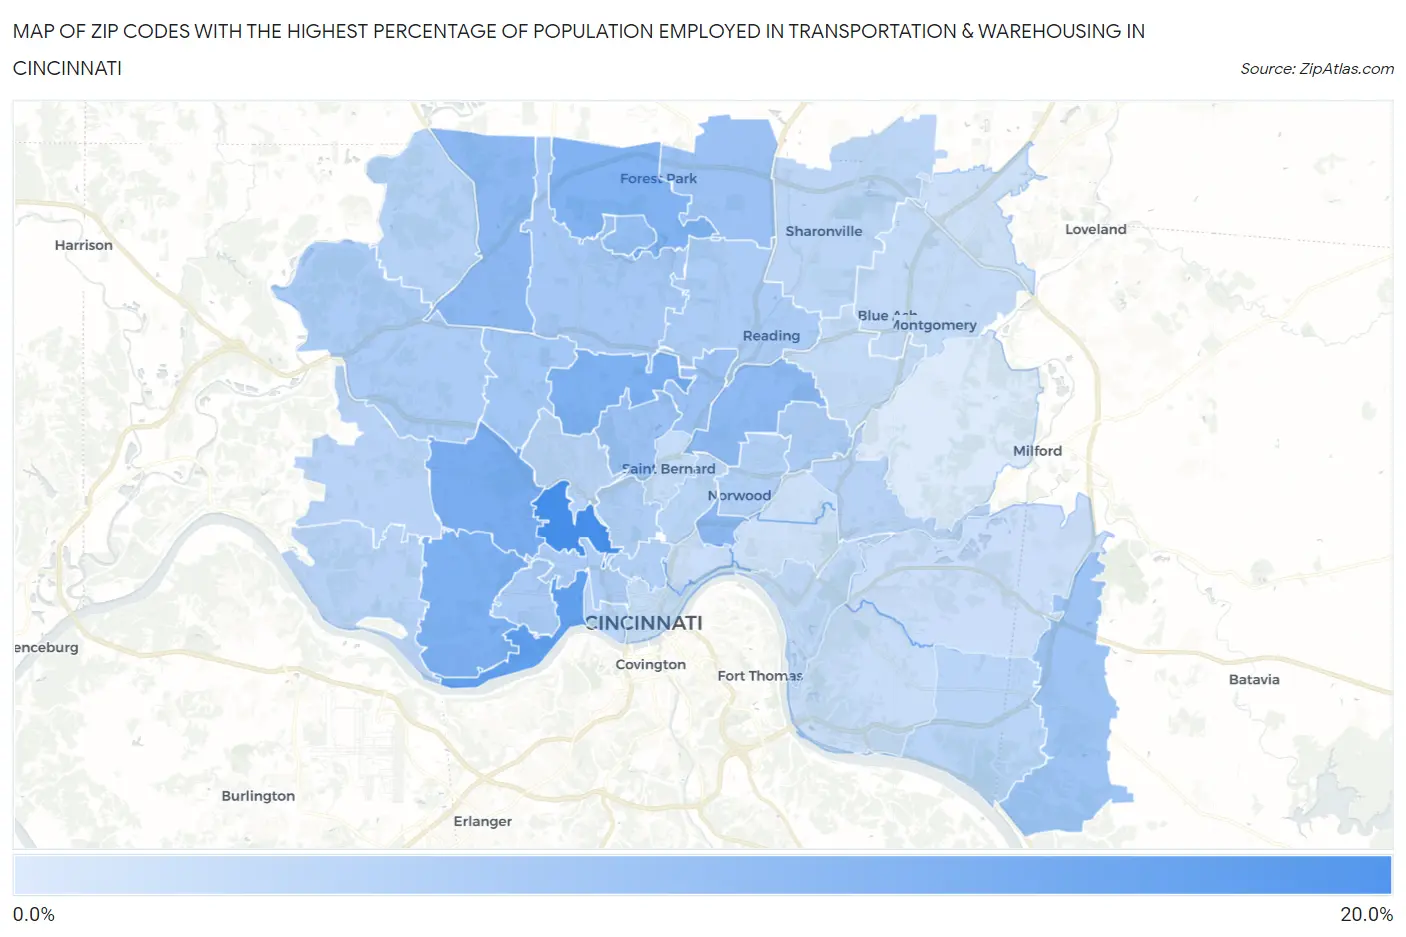
Map of Zip Codes with the Highest Percentage of Population Employed in Transportation & Warehousing in Cincinnati
0.36%
16.6%
Zip Codes with the Highest Percentage of Population Employed in Transportation & Warehousing in Cincinnati, OH
| Zip Code | % Employed | vs State | vs National | |
| 1. | 45225 | 16.6% | 4.9%(+11.7)#36 | 4.9%(+11.7)#831 |
| 2. | 45204 | 13.4% | 4.9%(+8.49)#51 | 4.9%(+8.48)#1,419 |
| 3. | 45211 | 11.0% | 4.9%(+6.05)#83 | 4.9%(+6.04)#2,333 |
| 4. | 45238 | 10.5% | 4.9%(+5.53)#93 | 4.9%(+5.52)#2,606 |
| 5. | 45224 | 10.3% | 4.9%(+5.41)#97 | 4.9%(+5.40)#2,683 |
| 6. | 45240 | 10.1% | 4.9%(+5.14)#100 | 4.9%(+5.13)#2,841 |
| 7. | 45207 | 8.8% | 4.9%(+3.88)#147 | 4.9%(+3.87)#3,908 |
| 8. | 45251 | 8.8% | 4.9%(+3.84)#151 | 4.9%(+3.83)#3,967 |
| 9. | 45237 | 8.5% | 4.9%(+3.59)#159 | 4.9%(+3.58)#4,250 |
| 10. | 45218 | 7.8% | 4.9%(+2.87)#200 | 4.9%(+2.86)#5,173 |
| 11. | 45216 | 7.4% | 4.9%(+2.42)#233 | 4.9%(+2.40)#5,906 |
| 12. | 45246 | 7.3% | 4.9%(+2.40)#235 | 4.9%(+2.39)#5,934 |
| 13. | 45232 | 7.0% | 4.9%(+2.04)#263 | 4.9%(+2.03)#6,600 |
| 14. | 45245 | 6.8% | 4.9%(+1.82)#288 | 4.9%(+1.81)#7,057 |
| 15. | 45239 | 6.3% | 4.9%(+1.37)#331 | 4.9%(+1.36)#8,039 |
| 16. | 45231 | 6.0% | 4.9%(+1.11)#361 | 4.9%(+1.10)#8,682 |
| 17. | 45205 | 5.7% | 4.9%(+0.763)#410 | 4.9%(+0.752)#9,659 |
| 18. | 45214 | 5.4% | 4.9%(+0.462)#450 | 4.9%(+0.451)#10,580 |
| 19. | 45215 | 5.4% | 4.9%(+0.445)#456 | 4.9%(+0.434)#10,641 |
| 20. | 45213 | 5.3% | 4.9%(+0.407)#459 | 4.9%(+0.396)#10,766 |
| 21. | 45247 | 5.3% | 4.9%(+0.384)#464 | 4.9%(+0.374)#10,852 |
| 22. | 45220 | 5.2% | 4.9%(+0.299)#473 | 4.9%(+0.289)#11,115 |
| 23. | 45212 | 4.7% | 4.9%(-0.191)#557 | 4.9%(-0.201)#12,855 |
| 24. | 45219 | 4.6% | 4.9%(-0.287)#573 | 4.9%(-0.297)#13,219 |
| 25. | 45252 | 4.3% | 4.9%(-0.664)#629 | 4.9%(-0.675)#14,713 |
| 26. | 45248 | 4.2% | 4.9%(-0.704)#638 | 4.9%(-0.715)#14,888 |
| 27. | 45233 | 4.2% | 4.9%(-0.748)#648 | 4.9%(-0.758)#15,066 |
| 28. | 45227 | 4.1% | 4.9%(-0.817)#660 | 4.9%(-0.828)#15,381 |
| 29. | 45223 | 4.1% | 4.9%(-0.849)#667 | 4.9%(-0.860)#15,535 |
| 30. | 45203 | 4.0% | 4.9%(-0.928)#683 | 4.9%(-0.939)#15,878 |
| 31. | 45255 | 4.0% | 4.9%(-0.942)#686 | 4.9%(-0.952)#15,942 |
| 32. | 45229 | 4.0% | 4.9%(-0.985)#692 | 4.9%(-0.996)#16,127 |
| 33. | 45241 | 3.6% | 4.9%(-1.38)#750 | 4.9%(-1.39)#17,833 |
| 34. | 45226 | 3.3% | 4.9%(-1.65)#796 | 4.9%(-1.66)#18,974 |
| 35. | 45236 | 2.8% | 4.9%(-2.09)#856 | 4.9%(-2.10)#20,921 |
| 36. | 45242 | 2.8% | 4.9%(-2.10)#858 | 4.9%(-2.11)#20,963 |
| 37. | 45202 | 2.8% | 4.9%(-2.14)#862 | 4.9%(-2.15)#21,150 |
| 38. | 45217 | 2.7% | 4.9%(-2.21)#874 | 4.9%(-2.22)#21,458 |
| 39. | 45230 | 2.5% | 4.9%(-2.42)#905 | 4.9%(-2.43)#22,317 |
| 40. | 45244 | 2.3% | 4.9%(-2.60)#930 | 4.9%(-2.61)#23,058 |
| 41. | 45206 | 2.3% | 4.9%(-2.67)#937 | 4.9%(-2.69)#23,330 |
| 42. | 45249 | 2.0% | 4.9%(-2.98)#982 | 4.9%(-2.99)#24,410 |
| 43. | 45209 | 1.9% | 4.9%(-3.01)#987 | 4.9%(-3.02)#24,496 |
| 44. | 45208 | 1.7% | 4.9%(-3.21)#1,002 | 4.9%(-3.22)#25,201 |
| 45. | 45243 | 0.36% | 4.9%(-4.57)#1,089 | 4.9%(-4.58)#27,940 |
1
Common Questions
What are the Top 10 Zip Codes with the Highest Percentage of Population Employed in Transportation & Warehousing in Cincinnati, OH?
Top 10 Zip Codes with the Highest Percentage of Population Employed in Transportation & Warehousing in Cincinnati, OH are:
What zip code has the Highest Percentage of Population Employed in Transportation & Warehousing in Cincinnati, OH?
45225 has the Highest Percentage of Population Employed in Transportation & Warehousing in Cincinnati, OH with 16.6%.
What is the Percentage of Population Employed in Transportation & Warehousing in Cincinnati, OH?
Percentage of Population Employed in Transportation & Warehousing in Cincinnati is 6.8%.
What is the Percentage of Population Employed in Transportation & Warehousing in Ohio?
Percentage of Population Employed in Transportation & Warehousing in Ohio is 4.9%.
What is the Percentage of Population Employed in Transportation & Warehousing in the United States?
Percentage of Population Employed in Transportation & Warehousing in the United States is 4.9%.