Zip Codes with the Highest Percentage of Population with a Degree in Communications in Cleveland, OH

RELATED REPORTS & OPTIONS

Communications
Population
Families and Households
Female Fertility
Female Fertility (Unmarried)
Race (Community Size)
Race (Percentage)
Ancestry (Community Size)
AfghanAfricanAlbanianAlsatianAmericanApacheArabArgentineanArmenianAustralianAustrianBahamianBangladeshiBarbadianBelgianBelizeanBhutaneseBlackfeetBrazilianBritishBritish West IndianBulgarianBurmeseCajunCambodianCanadianCape VerdeanCarpatho RusynCelticCentral AmericanCentral American IndianCherokeeChickasawChileanChippewaChoctawColombianComancheCosta RicanCreekCroatianCubanCzechCzechoslovakianDanishDelawareDominicanDutchDutch West IndianEastern EuropeanEcuadorianEgyptianEnglishEstonianEthiopianEuropeanFilipinoFinnishFrenchFrench American IndianFrench CanadianGermanGhanaianGreekGuamanian / ChamorroGuatemalanGuyaneseHaitianHonduranHungarianIcelanderIndian (Asian)IndonesianIranianIraqiIrishIroquoisIsraeliItalianJamaicanJapaneseJordanianKoreanLaotianLatvianLebaneseLiberianLithuanianLumbeeLuxembourgerMacedonianMalaysianMexicanMexican American IndianMongolianMoroccanNative HawaiianNavajoNicaraguanNigerianNorthern EuropeanNorwegianPakistaniPalestinianPanamanianParaguayanPennsylvania GermanPeruvianPolishPortuguesePuebloPuerto RicanRomanianRussianSalvadoranSamoanScandinavianScotch-IrishScottishSeminoleSerbianSierra LeoneanSiouxSlavicSlovakSloveneSomaliSouth AfricanSouth AmericanSouth American IndianSpaniardSpanishSri LankanSubsaharan AfricanSudaneseSwedishSwissSyrianThaiTrinidadian and TobagonianTurkishU.S. Virgin IslanderUgandanUkrainianUruguayanVenezuelanVietnameseWelshWest IndianYaquiYugoslavianZimbabwean
Ancestry (Percentage)
AfghanAfricanAlbanianAlsatianAmericanApacheArabArgentineanArmenianAustralianAustrianBahamianBangladeshiBarbadianBelgianBelizeanBhutaneseBlackfeetBrazilianBritishBritish West IndianBulgarianBurmeseCajunCambodianCanadianCape VerdeanCarpatho RusynCelticCentral AmericanCentral American IndianCherokeeChickasawChileanChippewaChoctawColombianComancheCosta RicanCreekCroatianCubanCzechCzechoslovakianDanishDelawareDominicanDutchDutch West IndianEastern EuropeanEcuadorianEgyptianEnglishEstonianEthiopianEuropeanFilipinoFinnishFrenchFrench American IndianFrench CanadianGermanGhanaianGreekGuamanian / ChamorroGuatemalanGuyaneseHaitianHonduranHungarianIcelanderIndian (Asian)IndonesianIranianIraqiIrishIroquoisIsraeliItalianJamaicanJapaneseJordanianKoreanLaotianLatvianLebaneseLiberianLithuanianLumbeeLuxembourgerMacedonianMalaysianMexicanMexican American IndianMongolianMoroccanNative HawaiianNavajoNicaraguanNigerianNorthern EuropeanNorwegianPakistaniPalestinianPanamanianParaguayanPennsylvania GermanPeruvianPolishPortuguesePuebloPuerto RicanRomanianRussianSalvadoranSamoanScandinavianScotch-IrishScottishSeminoleSerbianSierra LeoneanSiouxSlavicSlovakSloveneSomaliSouth AfricanSouth AmericanSouth American IndianSpaniardSpanishSri LankanSubsaharan AfricanSudaneseSwedishSwissSyrianThaiTrinidadian and TobagonianTurkishU.S. Virgin IslanderUgandanUkrainianUruguayanVenezuelanVietnameseWelshWest IndianYaquiYugoslavianZimbabwean
Immigrant Origin (Total)
AfghanistanAfricaAlbaniaArgentinaAsiaAustraliaAustriaBangladeshBarbadosBelarusBelgiumBelizeBosnia and HerzegovinaBrazilBulgariaBurma / MyanmarCambodiaCanadaCaribbeanCentral AmericaChileChinaColombiaCongoCosta RicaCroatiaCubaCzechoslovakiaDominican RepublicEastern AfricaEastern AsiaEastern EuropeEcuadorEgyptEl SalvadorEnglandEthiopiaEuropeFranceGermanyGhanaGreeceGuatemalaGuyanaHaitiHondurasHong KongHungaryIndiaIndonesiaIranIraqIrelandIsraelItalyJamaicaJapanJordanKazakhstanKenyaKoreaKuwaitLaosLatin AmericaLatviaLebanonLiberiaLithuaniaMalaysiaMexicoMiddle AfricaMoldovaMoroccoNepalNetherlandsNicaraguaNigeriaNorthern AfricaNorthern EuropeOceaniaPakistanPanamaPeruPhilippinesPolandRomaniaRussiaSaudi ArabiaScotlandSerbiaSierra LeoneSingaporeSomaliaSouth AfricaSouth AmericaSouth Central AsiaSouth Eastern AsiaSouthern EuropeSpainSri LankaSudanSwedenSyriaTaiwanThailandTrinidad and TobagoTurkeyUgandaUkraineUruguayUzbekistanVenezuelaVietnamWest IndiesWestern AfricaWestern AsiaWestern EuropeZaireZimbabwe
Immigrant Origin (Percentage)
AfghanistanAfricaAlbaniaArgentinaAsiaAustraliaAustriaBangladeshBarbadosBelarusBelgiumBelizeBosnia and HerzegovinaBrazilBulgariaBurma / MyanmarCambodiaCanadaCaribbeanCentral AmericaChileChinaColombiaCongoCosta RicaCroatiaCubaCzechoslovakiaDominican RepublicEastern AfricaEastern AsiaEastern EuropeEcuadorEgyptEl SalvadorEnglandEthiopiaEuropeFranceGermanyGhanaGreeceGuatemalaGuyanaHaitiHondurasHong KongHungaryIndiaIndonesiaIranIraqIrelandIsraelItalyJamaicaJapanJordanKazakhstanKenyaKoreaKuwaitLaosLatin AmericaLatviaLebanonLiberiaLithuaniaMalaysiaMexicoMiddle AfricaMoldovaMoroccoNepalNetherlandsNicaraguaNigeriaNorthern AfricaNorthern EuropeOceaniaPakistanPanamaPeruPhilippinesPolandRomaniaRussiaSaudi ArabiaScotlandSerbiaSierra LeoneSingaporeSomaliaSouth AfricaSouth AmericaSouth Central AsiaSouth Eastern AsiaSouthern EuropeSpainSri LankaSudanSwedenSyriaTaiwanThailandTrinidad and TobagoTurkeyUgandaUkraineUruguayUzbekistanVenezuelaVietnamWest IndiesWestern AfricaWestern AsiaWestern EuropeZaireZimbabwe
Income
Income (Families)
Income (Households)
Poverty
Poverty (Families)
Unemployment
Employment Occupations
Employment Industries
Employer Class
Commute Time
Commute Means
School Enrollment
Education by Degree Field
Occupancy
Finances
Physical Characteristics
Cleveland
Compare Zip Codes
Comparison Subject

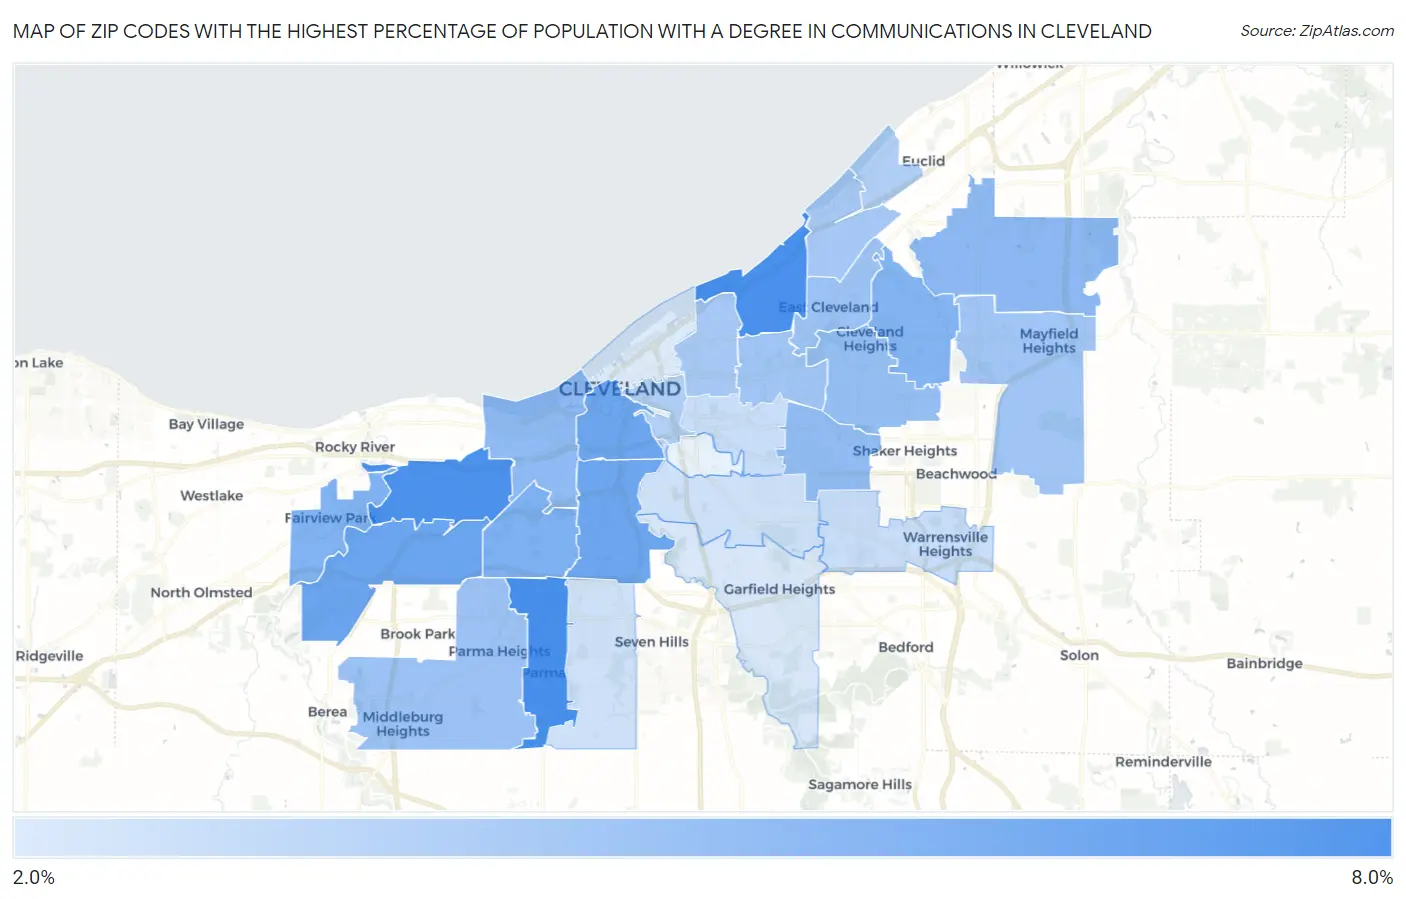
Map of Zip Codes with the Highest Percentage of Population with a Degree in Communications in Cleveland

0.0%
8.0%
Zip Codes with the Highest Percentage of Population with a Degree in Communications in Cleveland Map

Zip Codes with the Highest Percentage of Population with a Degree in Communications in Cleveland, OH

Zip Code % Graduates vs State vs National
1.441297.4%4.3%(+3.12)#1004.1%(+3.29)#2,247
2.441087.4%4.3%(+3.05)#1044.1%(+3.23)#2,293
3.441117.3%4.3%(+2.96)#1054.1%(+3.14)#2,367
4.441356.2%4.3%(+1.86)#1524.1%(+2.04)#3,522
5.441136.2%4.3%(+1.84)#1544.1%(+2.02)#3,543
6.441096.1%4.3%(+1.80)#1574.1%(+1.97)#3,622
7.441445.6%4.3%(+1.26)#1864.1%(+1.44)#4,507
8.441265.5%4.3%(+1.21)#1934.1%(+1.38)#4,620
9.441215.4%4.3%(+1.11)#2014.1%(+1.29)#4,798
10.441435.1%4.3%(+0.816)#2314.1%(+0.990)#5,409
11.441025.1%4.3%(+0.778)#2354.1%(+0.952)#5,491
12.441205.0%4.3%(+0.663)#2484.1%(+0.836)#5,765
13.441184.9%4.3%(+0.570)#2554.1%(+0.743)#5,969
14.441124.7%4.3%(+0.386)#2724.1%(+0.559)#6,419
15.441304.6%4.3%(+0.291)#2834.1%(+0.465)#6,692
16.441244.5%4.3%(+0.200)#2924.1%(+0.374)#6,930
17.441064.5%4.3%(+0.148)#2964.1%(+0.322)#7,073
18.441034.3%4.3%(+0.028)#3064.1%(+0.202)#7,468
19.441104.3%4.3%(-0.004)#3134.1%(+0.169)#7,576
20.441154.0%4.3%(-0.324)#3574.1%(-0.151)#8,616
21.441194.0%4.3%(-0.328)#3614.1%(-0.154)#8,629
22.441283.2%4.3%(-1.07)#4704.1%(-0.901)#11,314
23.441043.2%4.3%(-1.08)#4714.1%(-0.902)#11,317
24.441343.0%4.3%(-1.34)#5044.1%(-1.17)#12,310
25.441053.0%4.3%(-1.35)#5064.1%(-1.18)#12,359
26.441252.7%4.3%(-1.65)#5484.1%(-1.47)#13,561
27.441142.6%4.3%(-1.76)#5614.1%(-1.58)#13,964

Common Questions

What are the Top 10 Zip Codes with the Highest Percentage of Population with a Degree in Communications in Cleveland, OH?
Top 10 Zip Codes with the Highest Percentage of Population with a Degree in Communications in Cleveland, OH are:
#1
7.4%
#2
7.4%
#3
7.3%
#4
6.2%
#5
6.2%
#6
6.1%
#7
5.6%
#8
5.5%
#9
5.4%
#10
5.1%
What zip code has the Highest Percentage of Population with a Degree in Communications in Cleveland, OH?
44129 has the Highest Percentage of Population with a Degree in Communications in Cleveland, OH with 7.4%.
What is the Percentage of Population with a Degree in Communications in Cleveland, OH?
Percentage of Population with a Degree in Communications in Cleveland is 5.1%.
What is the Percentage of Population with a Degree in Communications in Ohio?
Percentage of Population with a Degree in Communications in Ohio is 4.3%.
What is the Percentage of Population with a Degree in Communications in the United States?
Percentage of Population with a Degree in Communications in the United States is 4.1%.