Zip Codes with the Highest Percentage of Population Employed in Arts, Entertainment & Recreation in Akron, OH
RELATED REPORTS & OPTIONS
Arts, Entertainment & Recreation
Akron
Compare Zip Codes
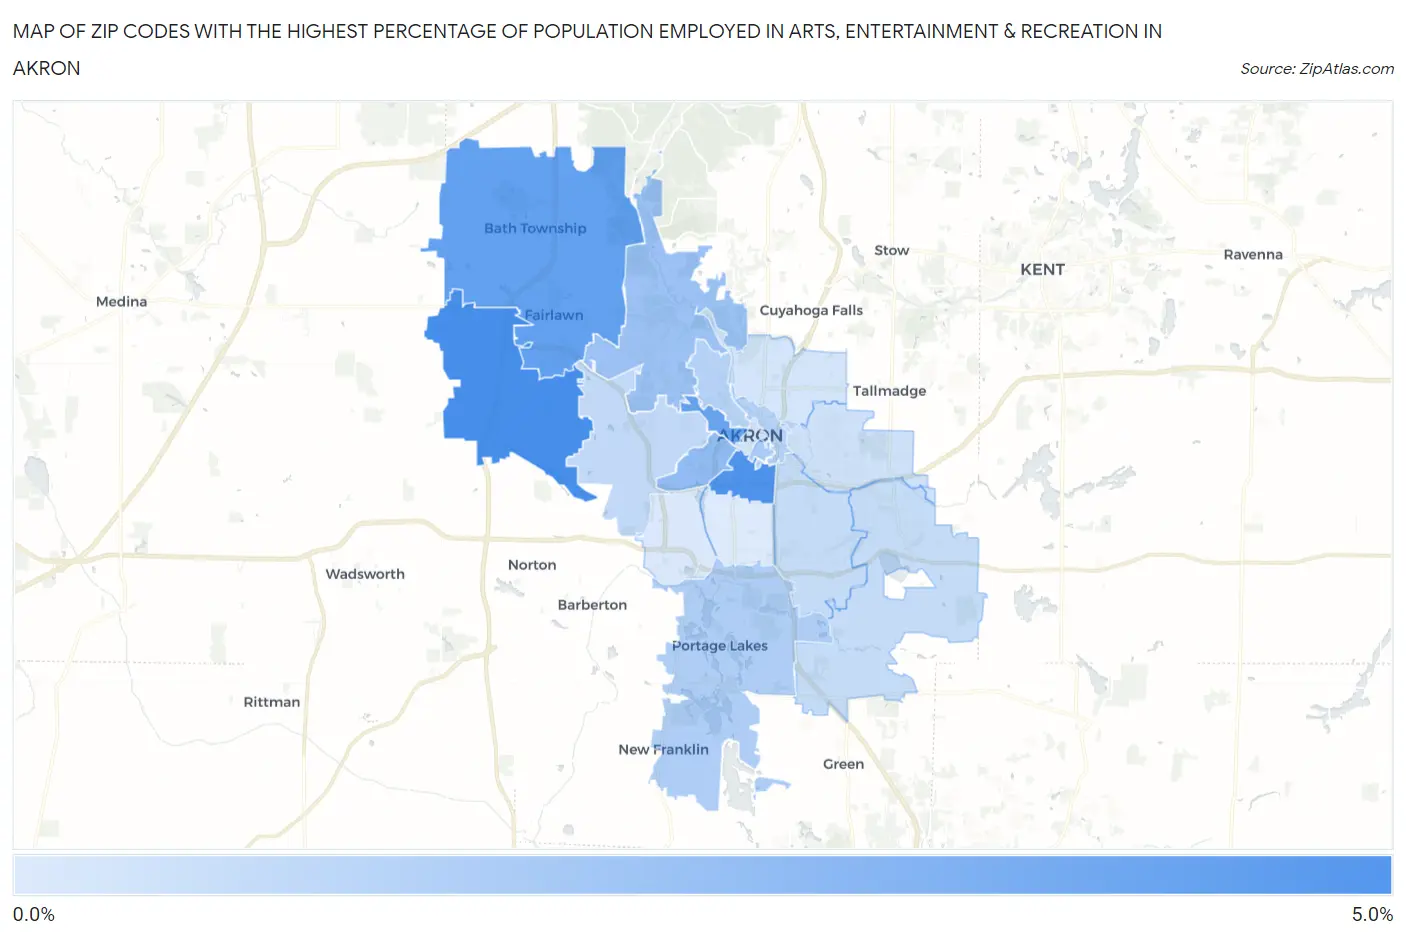
Map of Zip Codes with the Highest Percentage of Population Employed in Arts, Entertainment & Recreation in Akron
0.0%
5.0%
Zip Codes with the Highest Percentage of Population Employed in Arts, Entertainment & Recreation in Akron, OH
| Zip Code | % Employed | vs State | vs National | |
| 1. | 44321 | 4.2% | 1.7%(+2.48)#53 | 2.1%(+2.08)#3,128 |
| 2. | 44311 | 4.0% | 1.7%(+2.32)#58 | 2.1%(+1.92)#3,346 |
| 3. | 44333 | 3.5% | 1.7%(+1.80)#83 | 2.1%(+1.40)#4,176 |
| 4. | 44302 | 3.3% | 1.7%(+1.60)#91 | 2.1%(+1.19)#4,627 |
| 5. | 44307 | 2.3% | 1.7%(+0.620)#203 | 2.1%(+0.216)#8,132 |
| 6. | 44313 | 2.0% | 1.7%(+0.312)#259 | 2.1%(-0.092)#9,835 |
| 7. | 44325 | 1.7% | 1.7%(-0.012)#352 | 2.1%(-0.416)#11,970 |
| 8. | 44319 | 1.6% | 1.7%(-0.126)#389 | 2.1%(-0.530)#12,830 |
| 9. | 44303 | 1.4% | 1.7%(-0.304)#448 | 2.1%(-0.708)#14,177 |
| 10. | 44304 | 1.4% | 1.7%(-0.304)#449 | 2.1%(-0.708)#14,179 |
| 11. | 44320 | 1.1% | 1.7%(-0.598)#549 | 2.1%(-1.00)#16,390 |
| 12. | 44312 | 0.97% | 1.7%(-0.704)#589 | 2.1%(-1.11)#17,159 |
| 13. | 44306 | 0.95% | 1.7%(-0.732)#602 | 2.1%(-1.14)#17,353 |
| 14. | 44305 | 0.73% | 1.7%(-0.950)#671 | 2.1%(-1.35)#18,932 |
| 15. | 44308 | 0.63% | 1.7%(-1.04)#701 | 2.1%(-1.45)#19,596 |
| 16. | 44310 | 0.61% | 1.7%(-1.07)#711 | 2.1%(-1.47)#19,773 |
| 17. | 44314 | 0.47% | 1.7%(-1.20)#745 | 2.1%(-1.61)#20,645 |
| 18. | 44301 | 0.40% | 1.7%(-1.27)#769 | 2.1%(-1.68)#21,072 |
1
Common Questions
What are the Top 10 Zip Codes with the Highest Percentage of Population Employed in Arts, Entertainment & Recreation in Akron, OH?
Top 10 Zip Codes with the Highest Percentage of Population Employed in Arts, Entertainment & Recreation in Akron, OH are:
What zip code has the Highest Percentage of Population Employed in Arts, Entertainment & Recreation in Akron, OH?
44321 has the Highest Percentage of Population Employed in Arts, Entertainment & Recreation in Akron, OH with 4.2%.
What is the Percentage of Population Employed in Arts, Entertainment & Recreation in Akron, OH?
Percentage of Population Employed in Arts, Entertainment & Recreation in Akron is 1.3%.
What is the Percentage of Population Employed in Arts, Entertainment & Recreation in Ohio?
Percentage of Population Employed in Arts, Entertainment & Recreation in Ohio is 1.7%.
What is the Percentage of Population Employed in Arts, Entertainment & Recreation in the United States?
Percentage of Population Employed in Arts, Entertainment & Recreation in the United States is 2.1%.