Zip Codes with the Highest Percentage of Households with Income Above $200,000 in Trenton, NJ
RELATED REPORTS & OPTIONS
Household Income | $200k+
Trenton
Compare Zip Codes
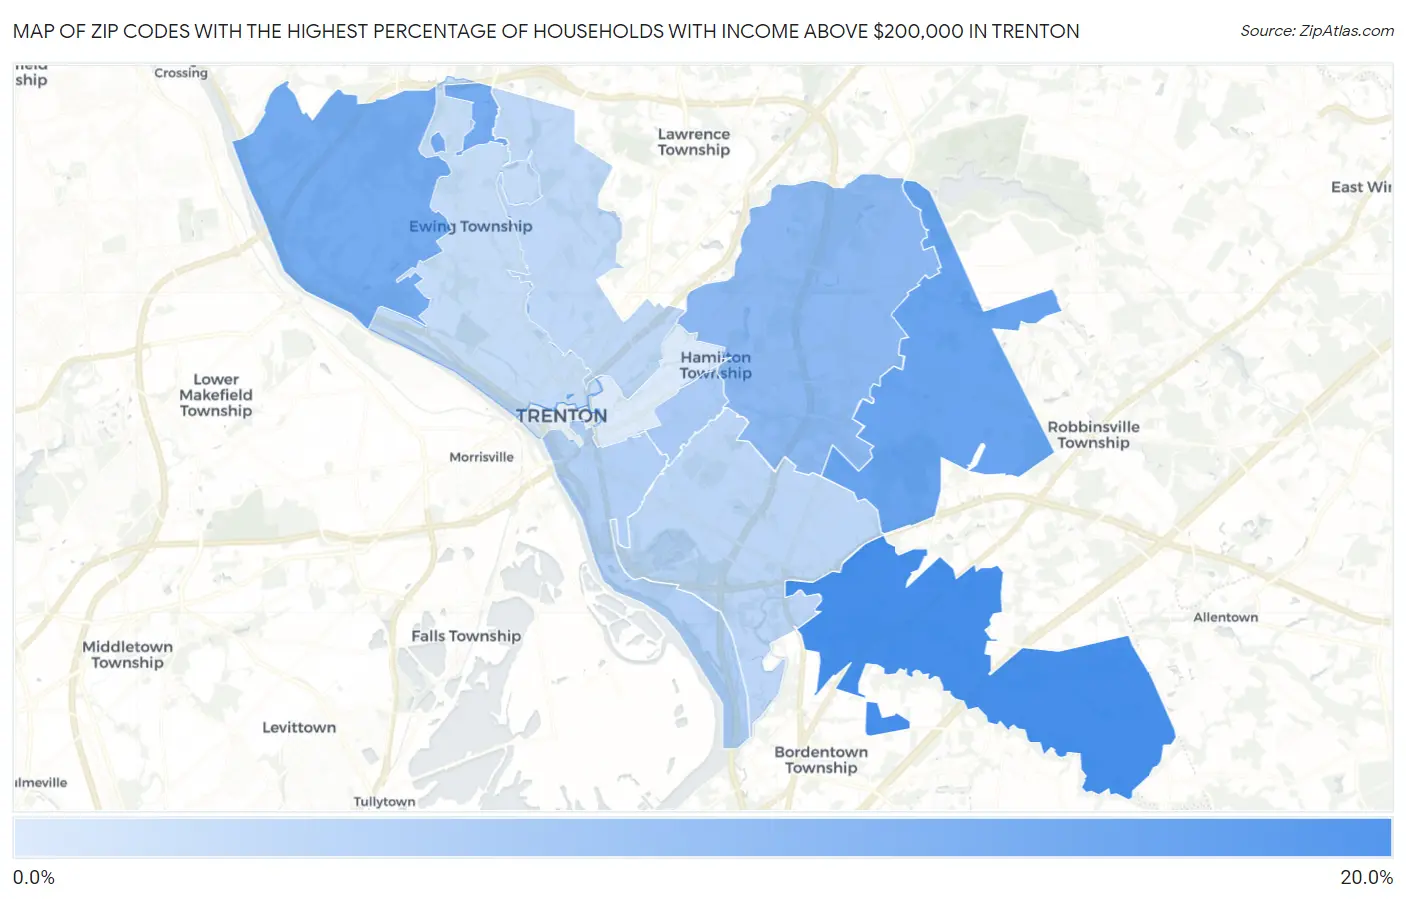
Map of Zip Codes with the Highest Percentage of Households with Income Above $200,000 in Trenton
1.9%
19.9%
Zip Codes with the Highest Percentage of Households with Income Above $200,000 in Trenton, NJ
| Zip Code | Households with Income > $200k | vs State | vs National | |
| 1. | 08620 | 19.9% | 19.2%(+0.700)#255 | 11.4%(+8.50)#3,325 |
| 2. | 08690 | 15.6% | 19.2%(-3.60)#325 | 11.4%(+4.20)#4,722 |
| 3. | 08628 | 14.1% | 19.2%(-5.10)#357 | 11.4%(+2.70)#5,427 |
| 4. | 08619 | 11.3% | 19.2%(-7.90)#416 | 11.4%(-0.100)#7,158 |
| 5. | 08629 | 7.8% | 19.2%(-11.4)#478 | 11.4%(-3.60)#10,641 |
| 6. | 08611 | 6.6% | 19.2%(-12.6)#493 | 11.4%(-4.80)#12,403 |
| 7. | 08610 | 5.5% | 19.2%(-13.7)#509 | 11.4%(-5.90)#14,487 |
| 8. | 08638 | 5.3% | 19.2%(-13.9)#512 | 11.4%(-6.10)#14,887 |
| 9. | 08618 | 4.4% | 19.2%(-14.8)#533 | 11.4%(-7.00)#17,012 |
| 10. | 08609 | 1.9% | 19.2%(-17.3)#562 | 11.4%(-9.50)#24,073 |
1
Common Questions
What are the Top 10 Zip Codes with the Highest Percentage of Households with Income Above $200,000 in Trenton, NJ?
Top 10 Zip Codes with the Highest Percentage of Households with Income Above $200,000 in Trenton, NJ are:
What zip code has the Highest Percentage of Households with Income Above $200,000 in Trenton, NJ?
08620 has the Highest Percentage of Households with Income Above $200,000 in Trenton, NJ with 19.9%.
What is the Percentage of Households with Income Above $200,000 in Trenton, NJ?
Percentage of Households with Income Above $200,000 in Trenton is 4.4%.
What is the Percentage of Households with Income Above $200,000 in New Jersey?
Percentage of Households with Income Above $200,000 in New Jersey is 19.2%.
What is the Percentage of Households with Income Above $200,000 in the United States?
Percentage of Households with Income Above $200,000 in the United States is 11.4%.