Zip Codes with the Highest Percentage of Households with Income Above $200,000 in Clifton, NJ
RELATED REPORTS & OPTIONS
Household Income | $200k+
Clifton
Compare Zip Codes
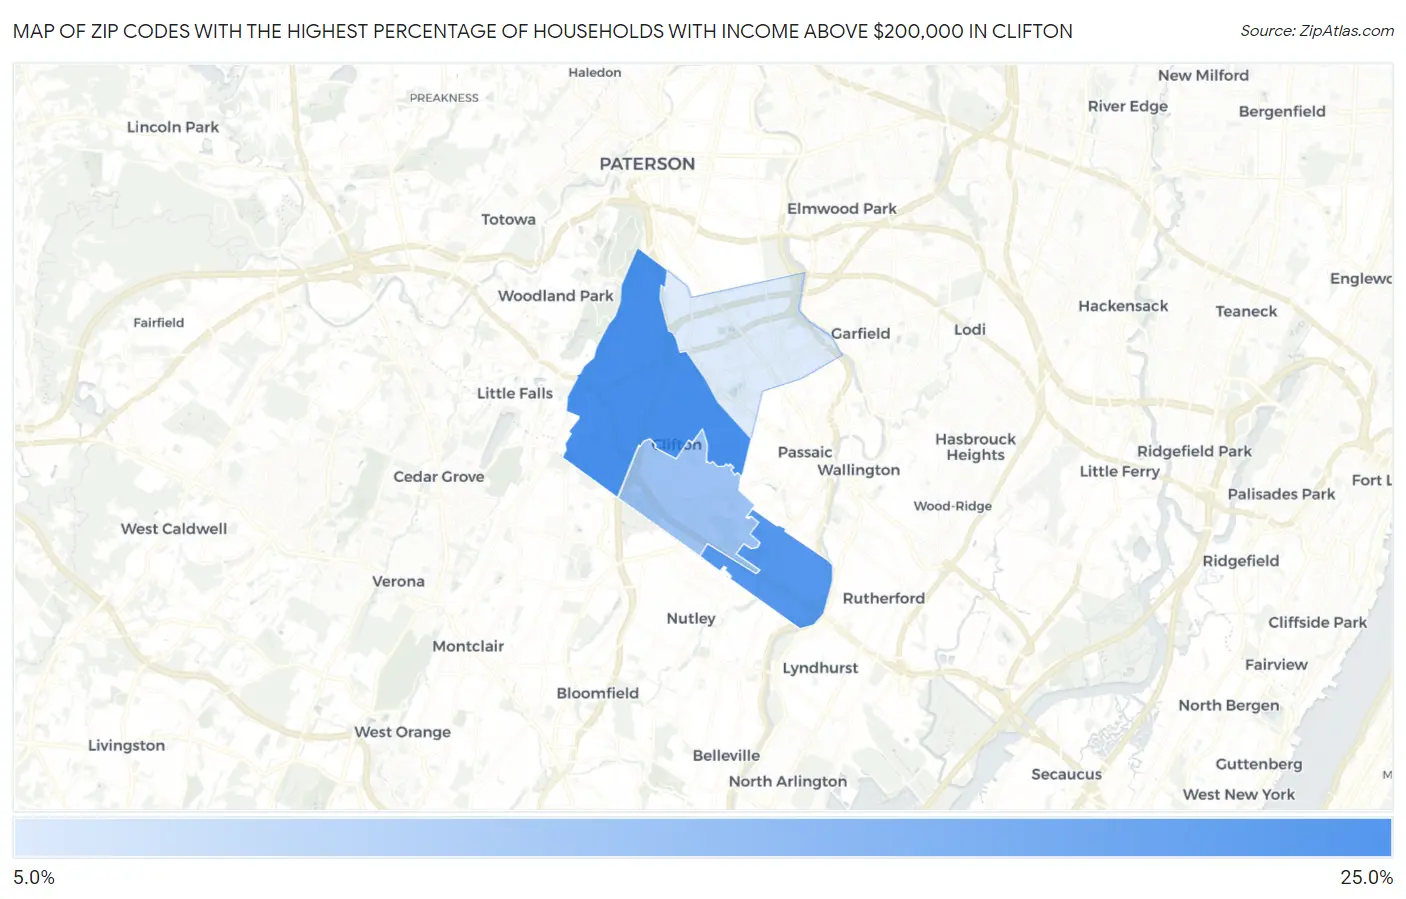
Map of Zip Codes with the Highest Percentage of Households with Income Above $200,000 in Clifton
7.3%
22.3%
Zip Codes with the Highest Percentage of Households with Income Above $200,000 in Clifton, NJ
| Zip Code | Households with Income > $200k | vs State | vs National | |
| 1. | 07013 | 22.3% | 19.2%(+3.10)#226 | 11.4%(+10.9)#2,717 |
| 2. | 07014 | 20.9% | 19.2%(+1.70)#248 | 11.4%(+9.50)#3,065 |
| 3. | 07012 | 13.8% | 19.2%(-5.40)#367 | 11.4%(+2.40)#5,573 |
| 4. | 07011 | 7.3% | 19.2%(-11.9)#488 | 11.4%(-4.10)#11,328 |
1
Common Questions
What are the Top 3 Zip Codes with the Highest Percentage of Households with Income Above $200,000 in Clifton, NJ?
Top 3 Zip Codes with the Highest Percentage of Households with Income Above $200,000 in Clifton, NJ are:
What zip code has the Highest Percentage of Households with Income Above $200,000 in Clifton, NJ?
07013 has the Highest Percentage of Households with Income Above $200,000 in Clifton, NJ with 22.3%.
What is the Percentage of Households with Income Above $200,000 in Clifton, NJ?
Percentage of Households with Income Above $200,000 in Clifton is 14.6%.
What is the Percentage of Households with Income Above $200,000 in New Jersey?
Percentage of Households with Income Above $200,000 in New Jersey is 19.2%.
What is the Percentage of Households with Income Above $200,000 in the United States?
Percentage of Households with Income Above $200,000 in the United States is 11.4%.