Zip Codes with the Highest Percentage of Population Employed in Accommodation & Food Services in Clifton, NJ
RELATED REPORTS & OPTIONS
Accommodation & Food Services
Clifton
Compare Zip Codes
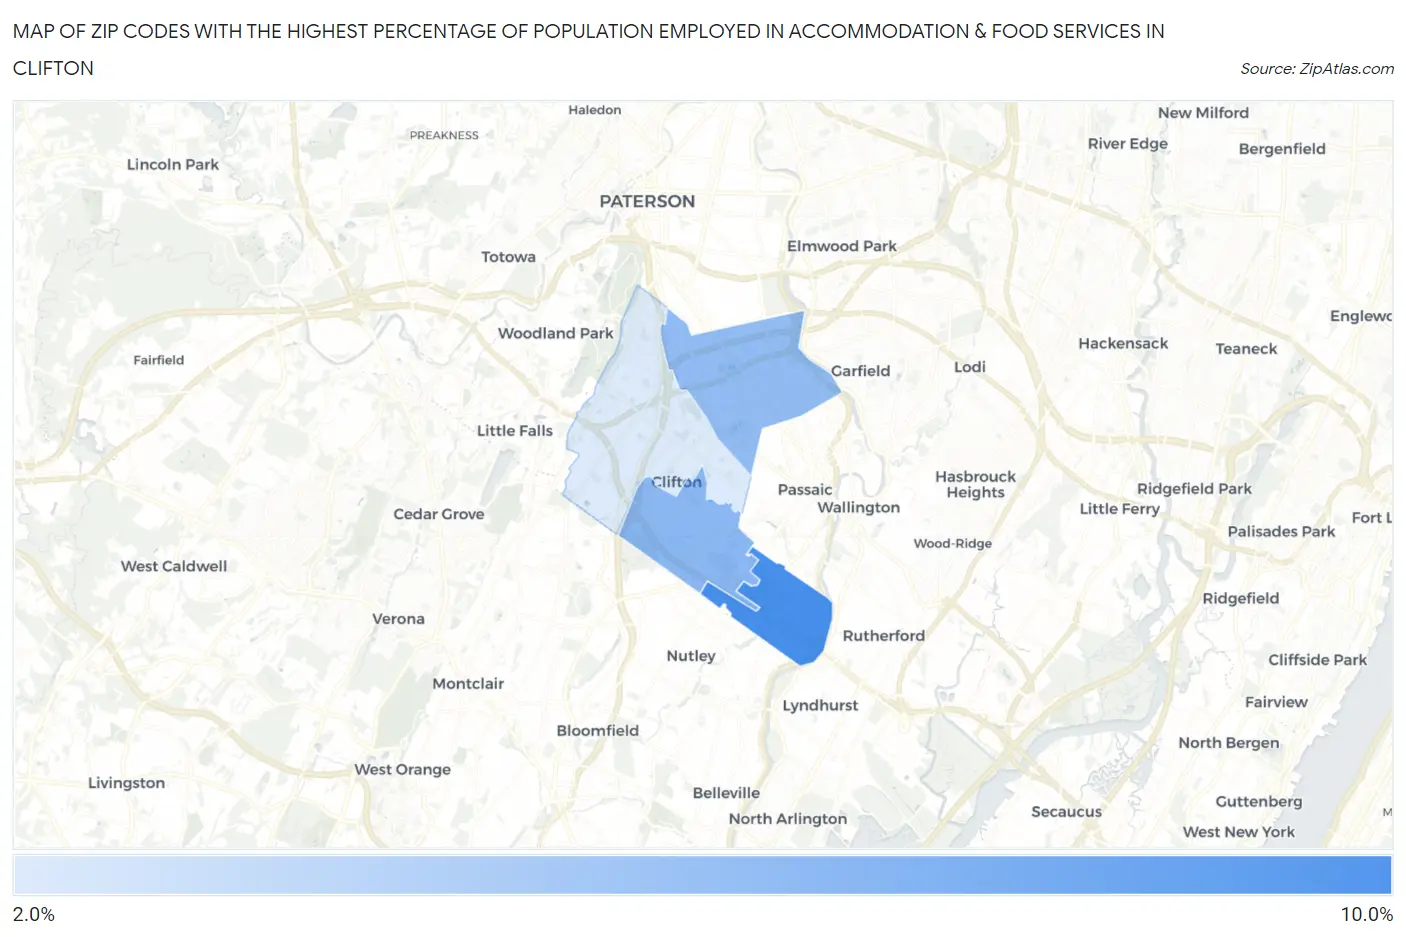
Map of Zip Codes with the Highest Percentage of Population Employed in Accommodation & Food Services in Clifton
2.7%
9.5%
Zip Codes with the Highest Percentage of Population Employed in Accommodation & Food Services in Clifton, NJ
| Zip Code | % Employed | vs State | vs National | |
| 1. | 07014 | 9.5% | 5.3%(+4.26)#37 | 6.9%(+2.65)#5,169 |
| 2. | 07012 | 6.4% | 5.3%(+1.13)#147 | 6.9%(-0.470)#12,123 |
| 3. | 07011 | 6.1% | 5.3%(+0.807)#165 | 6.9%(-0.797)#13,192 |
| 4. | 07013 | 2.7% | 5.3%(-2.58)#459 | 6.9%(-4.19)#24,025 |
1
Common Questions
What are the Top 3 Zip Codes with the Highest Percentage of Population Employed in Accommodation & Food Services in Clifton, NJ?
Top 3 Zip Codes with the Highest Percentage of Population Employed in Accommodation & Food Services in Clifton, NJ are:
What zip code has the Highest Percentage of Population Employed in Accommodation & Food Services in Clifton, NJ?
07014 has the Highest Percentage of Population Employed in Accommodation & Food Services in Clifton, NJ with 9.5%.
What is the Percentage of Population Employed in Accommodation & Food Services in Clifton, NJ?
Percentage of Population Employed in Accommodation & Food Services in Clifton is 5.2%.
What is the Percentage of Population Employed in Accommodation & Food Services in New Jersey?
Percentage of Population Employed in Accommodation & Food Services in New Jersey is 5.3%.
What is the Percentage of Population Employed in Accommodation & Food Services in the United States?
Percentage of Population Employed in Accommodation & Food Services in the United States is 6.9%.