Barnegat, NJ Map & Demographics
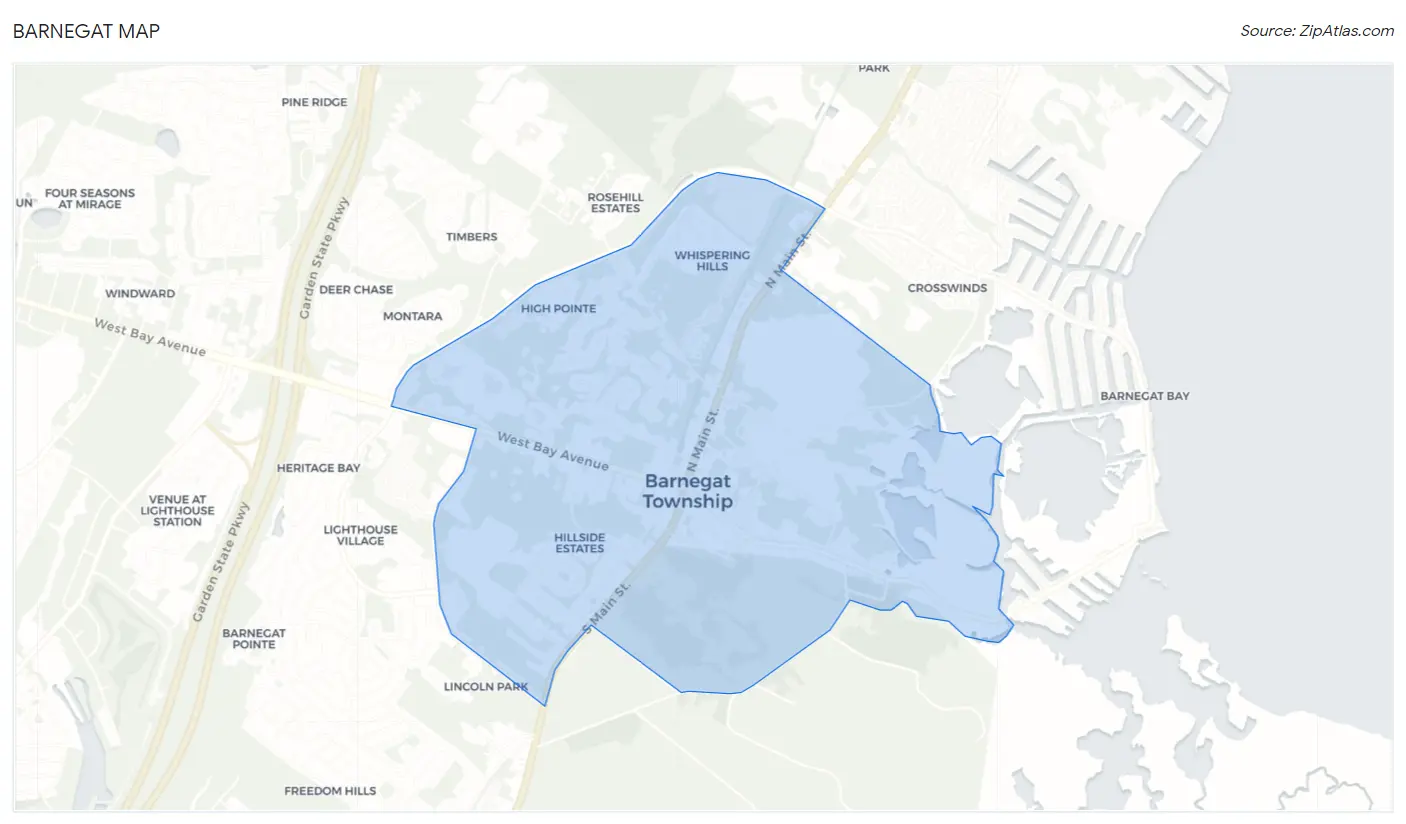
Barnegat Map
Barnegat Overview
$43,222
PER CAPITA INCOME
$101,144
AVG FAMILY INCOME
$98,621
AVG HOUSEHOLD INCOME
11.0%
WAGE / INCOME GAP [ % ]
89.0¢/ $1
WAGE / INCOME GAP [ $ ]
0.40
INEQUALITY / GINI INDEX
3,284
TOTAL POPULATION
1,707
MALE POPULATION
1,577
FEMALE POPULATION
108.24
MALES / 100 FEMALES
92.38
FEMALES / 100 MALES
41.1
MEDIAN AGE
2.9
AVG FAMILY SIZE
2.7
AVG HOUSEHOLD SIZE
1,792
LABOR FORCE [ PEOPLE ]
69.1%
PERCENT IN LABOR FORCE
4.8%
UNEMPLOYMENT RATE
Barnegat Zip Codes
Barnegat Area Codes
Income in Barnegat
Income Overview in Barnegat
Per Capita Income in Barnegat is $43,222, while median incomes of families and households are $101,144 and $98,621 respectively.
| Characteristic | Number | Measure |
| Per Capita Income | 3,284 | $43,222 |
| Median Family Income | 1,041 | $101,144 |
| Mean Family Income | 1,041 | $124,323 |
| Median Household Income | 1,204 | $98,621 |
| Mean Household Income | 1,204 | $120,431 |
| Income Deficit | 1,041 | $0 |
| Wage / Income Gap (%) | 3,284 | 10.99% |
| Wage / Income Gap ($) | 3,284 | 89.01¢ per $1 |
| Gini / Inequality Index | 3,284 | 0.40 |
Earnings by Sex in Barnegat
Average Earnings in Barnegat are $47,382, $50,649 for men and $45,085 for women, a difference of 11.0%.
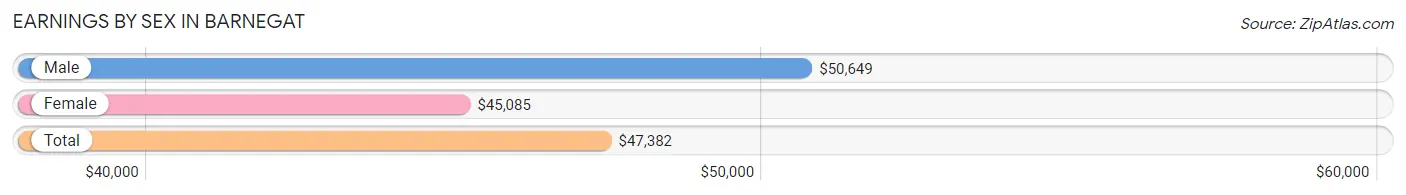
| Sex | Number | Average Earnings |
| Male | 976 (55.5%) | $50,649 |
| Female | 783 (44.5%) | $45,085 |
| Total | 1,759 (100.0%) | $47,382 |
Earnings by Sex by Income Bracket in Barnegat
The most common earnings brackets in Barnegat are $100,000+ for men (242 | 24.8%) and $50,000 to $54,999 for women (139 | 17.7%).
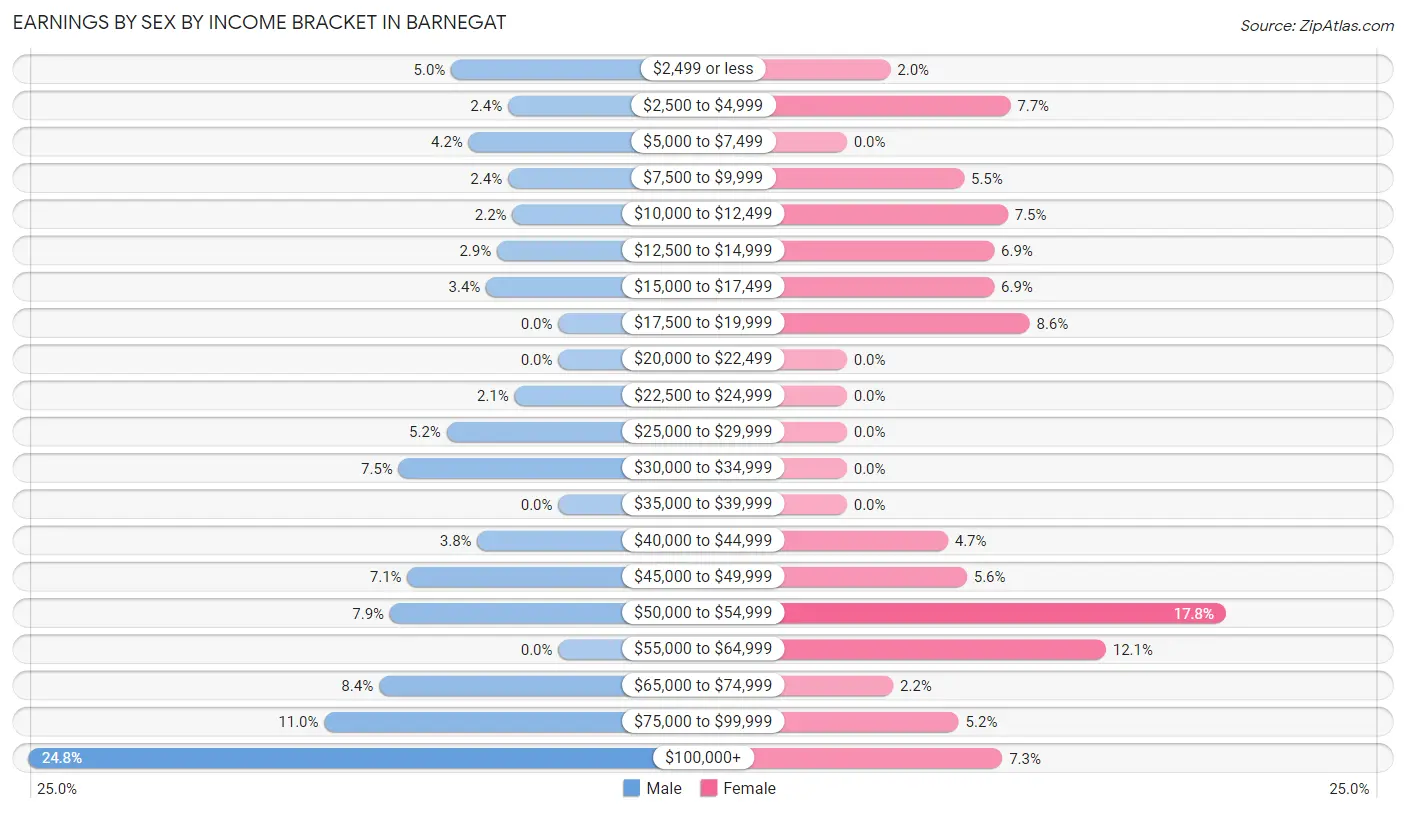
| Income | Male | Female |
| $2,499 or less | 49 (5.0%) | 16 (2.0%) |
| $2,500 to $4,999 | 23 (2.4%) | 60 (7.7%) |
| $5,000 to $7,499 | 41 (4.2%) | 0 (0.0%) |
| $7,500 to $9,999 | 23 (2.4%) | 43 (5.5%) |
| $10,000 to $12,499 | 21 (2.1%) | 59 (7.5%) |
| $12,500 to $14,999 | 28 (2.9%) | 54 (6.9%) |
| $15,000 to $17,499 | 33 (3.4%) | 54 (6.9%) |
| $17,500 to $19,999 | 0 (0.0%) | 67 (8.6%) |
| $20,000 to $22,499 | 0 (0.0%) | 0 (0.0%) |
| $22,500 to $24,999 | 20 (2.1%) | 0 (0.0%) |
| $25,000 to $29,999 | 51 (5.2%) | 0 (0.0%) |
| $30,000 to $34,999 | 73 (7.5%) | 0 (0.0%) |
| $35,000 to $39,999 | 0 (0.0%) | 0 (0.0%) |
| $40,000 to $44,999 | 37 (3.8%) | 37 (4.7%) |
| $45,000 to $49,999 | 69 (7.1%) | 44 (5.6%) |
| $50,000 to $54,999 | 77 (7.9%) | 139 (17.7%) |
| $55,000 to $64,999 | 0 (0.0%) | 95 (12.1%) |
| $65,000 to $74,999 | 82 (8.4%) | 17 (2.2%) |
| $75,000 to $99,999 | 107 (11.0%) | 41 (5.2%) |
| $100,000+ | 242 (24.8%) | 57 (7.3%) |
| Total | 976 (100.0%) | 783 (100.0%) |
Earnings by Sex by Educational Attainment in Barnegat
Average earnings in Barnegat are $65,671 for men and $46,278 for women, a difference of 29.5%. Men with an educational attainment of college or associate's degree enjoy the highest average annual earnings of $104,360, while those with high school diploma education earn the least with $32,813. Women with an educational attainment of bachelor's degree earn the most with the average annual earnings of $55,181, while those with high school diploma education have the smallest earnings of $14,417.
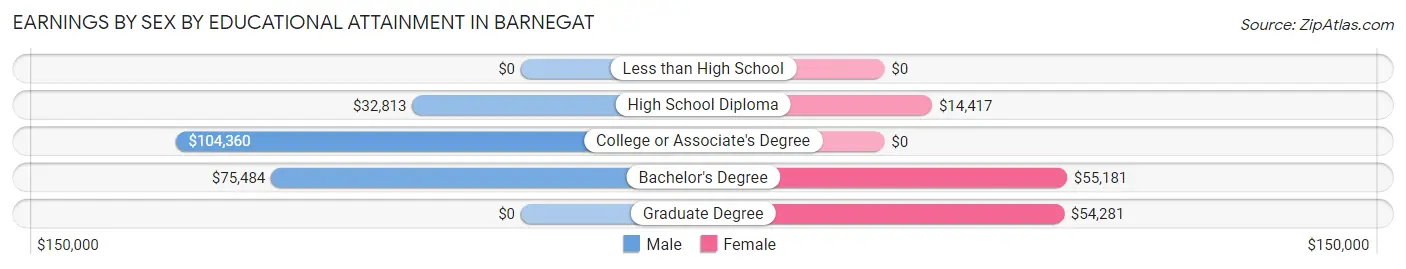
| Educational Attainment | Male Income | Female Income |
| Less than High School | - | - |
| High School Diploma | $32,813 | $14,417 |
| College or Associate's Degree | $104,360 | $0 |
| Bachelor's Degree | $75,484 | $55,181 |
| Graduate Degree | - | - |
| Total | $65,671 | $46,278 |
Family Income in Barnegat
Family Income Brackets in Barnegat
According to the Barnegat family income data, there are 246 families falling into the $100,000 to $149,999 income range, which is the most common income bracket and makes up 23.6% of all families.
| Income Bracket | # Families | % Families |
| Less than $10,000 | 16 | 1.5% |
| $10,000 to $14,999 | 0 | 0.0% |
| $15,000 to $24,999 | 21 | 2.0% |
| $25,000 to $34,999 | 178 | 17.1% |
| $35,000 to $49,999 | 15 | 1.4% |
| $50,000 to $74,999 | 85 | 8.2% |
| $75,000 to $99,999 | 184 | 17.7% |
| $100,000 to $149,999 | 246 | 23.6% |
| $150,000 to $199,999 | 211 | 20.3% |
| $200,000+ | 85 | 8.2% |
Family Income by Famaliy Size in Barnegat
4-person families (230 | 22.1%) account for the highest median family income in Barnegat with $151,548 per family, while 2-person families (500 | 48.0%) have the highest median income of $44,584 per family member.
| Income Bracket | # Families | Median Income |
| 2-Person Families | 500 (48.0%) | $89,167 |
| 3-Person Families | 246 (23.6%) | $0 |
| 4-Person Families | 230 (22.1%) | $151,548 |
| 5-Person Families | 44 (4.2%) | $0 |
| 6-Person Families | 21 (2.0%) | $0 |
| 7+ Person Families | 0 (0.0%) | $0 |
| Total | 1,041 (100.0%) | $101,144 |
Family Income by Number of Earners in Barnegat
| Number of Earners | # Families | Median Income |
| No Earners | 160 (15.4%) | $0 |
| 1 Earner | 358 (34.4%) | $77,083 |
| 2 Earners | 375 (36.0%) | $128,697 |
| 3+ Earners | 148 (14.2%) | $196,190 |
| Total | 1,041 (100.0%) | $101,144 |
Household Income in Barnegat
Household Income Brackets in Barnegat
With 246 households falling in the category, the $100,000 to $149,999 income range is the most frequent in Barnegat, accounting for 20.4% of all households.
| Income Bracket | # Households | % Households |
| Less than $10,000 | 39 | 3.2% |
| $10,000 to $14,999 | 0 | 0.0% |
| $15,000 to $24,999 | 43 | 3.6% |
| $25,000 to $34,999 | 107 | 8.9% |
| $35,000 to $49,999 | 72 | 6.0% |
| $50,000 to $74,999 | 130 | 10.8% |
| $75,000 to $99,999 | 228 | 18.9% |
| $100,000 to $149,999 | 246 | 20.4% |
| $150,000 to $199,999 | 223 | 18.5% |
| $200,000+ | 117 | 9.7% |
Household Income by Householder Age in Barnegat
The median household income in Barnegat is $98,621, with the highest median household income of $129,255 found in the 25 to 44 years age bracket for the primary householder. A total of 390 households (32.4%) fall into this category.
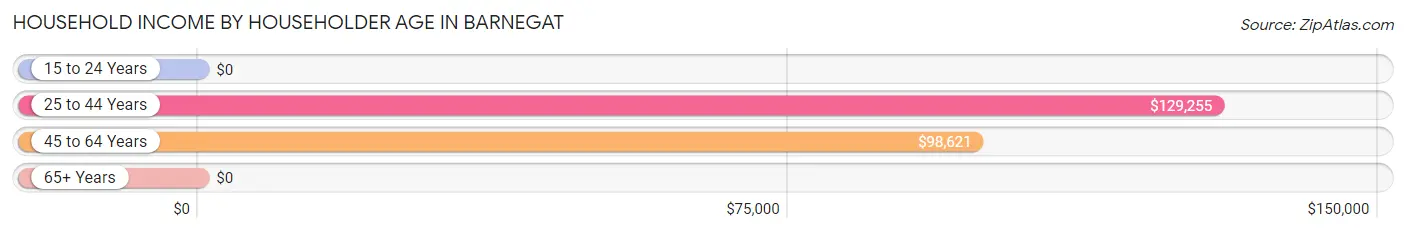
| Income Bracket | # Households | Median Income |
| 15 to 24 Years | 0 (0.0%) | $0 |
| 25 to 44 Years | 390 (32.4%) | $129,255 |
| 45 to 64 Years | 614 (51.0%) | $98,621 |
| 65+ Years | 200 (16.6%) | $0 |
| Total | 1,204 (100.0%) | $98,621 |
Poverty in Barnegat
Income Below Poverty by Sex and Age in Barnegat
With 2.1% poverty level for males and 6.2% for females among the residents of Barnegat, 45 to 54 year old males and 35 to 44 year old females are the most vulnerable to poverty, with 19 males (14.4%) and 82 females (33.9%) in their respective age groups living below the poverty level.
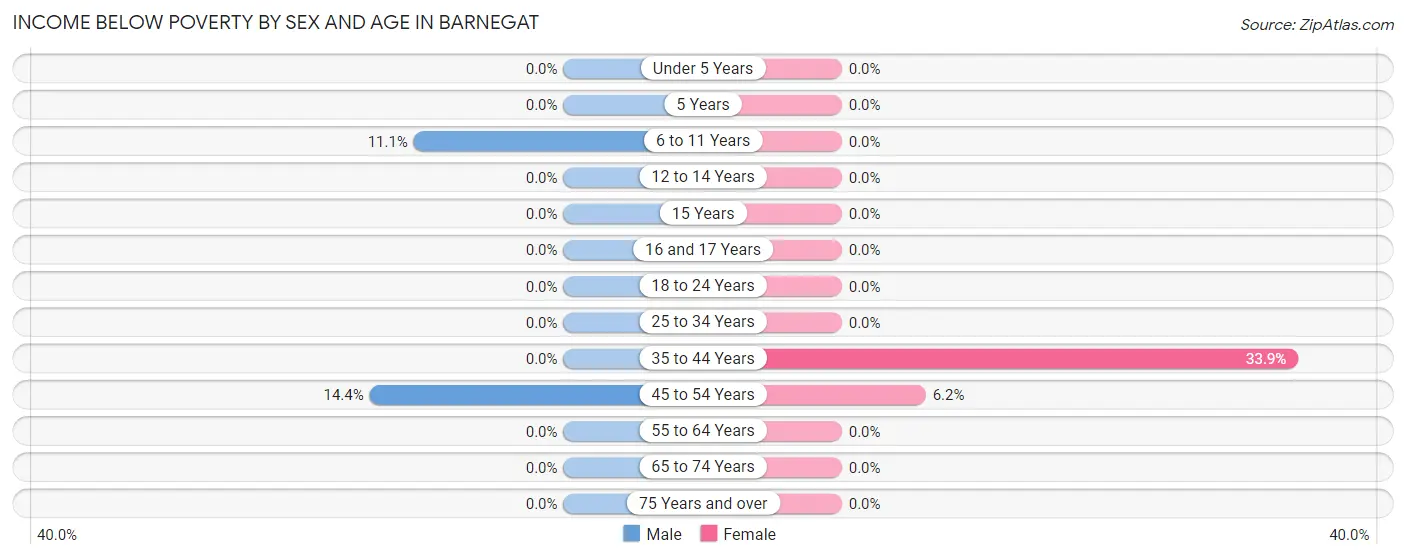
| Age Bracket | Male | Female |
| Under 5 Years | 0 (0.0%) | 0 (0.0%) |
| 5 Years | 0 (0.0%) | 0 (0.0%) |
| 6 to 11 Years | 17 (11.1%) | 0 (0.0%) |
| 12 to 14 Years | 0 (0.0%) | 0 (0.0%) |
| 15 Years | 0 (0.0%) | 0 (0.0%) |
| 16 and 17 Years | 0 (0.0%) | 0 (0.0%) |
| 18 to 24 Years | 0 (0.0%) | 0 (0.0%) |
| 25 to 34 Years | 0 (0.0%) | 0 (0.0%) |
| 35 to 44 Years | 0 (0.0%) | 82 (33.9%) |
| 45 to 54 Years | 19 (14.4%) | 16 (6.2%) |
| 55 to 64 Years | 0 (0.0%) | 0 (0.0%) |
| 65 to 74 Years | 0 (0.0%) | 0 (0.0%) |
| 75 Years and over | 0 (0.0%) | 0 (0.0%) |
| Total | 36 (2.1%) | 98 (6.2%) |
Income Above Poverty by Sex and Age in Barnegat
According to the poverty statistics in Barnegat, males aged under 5 years and females aged under 5 years are the age groups that are most secure financially, with 100.0% of males and 100.0% of females in these age groups living above the poverty line.
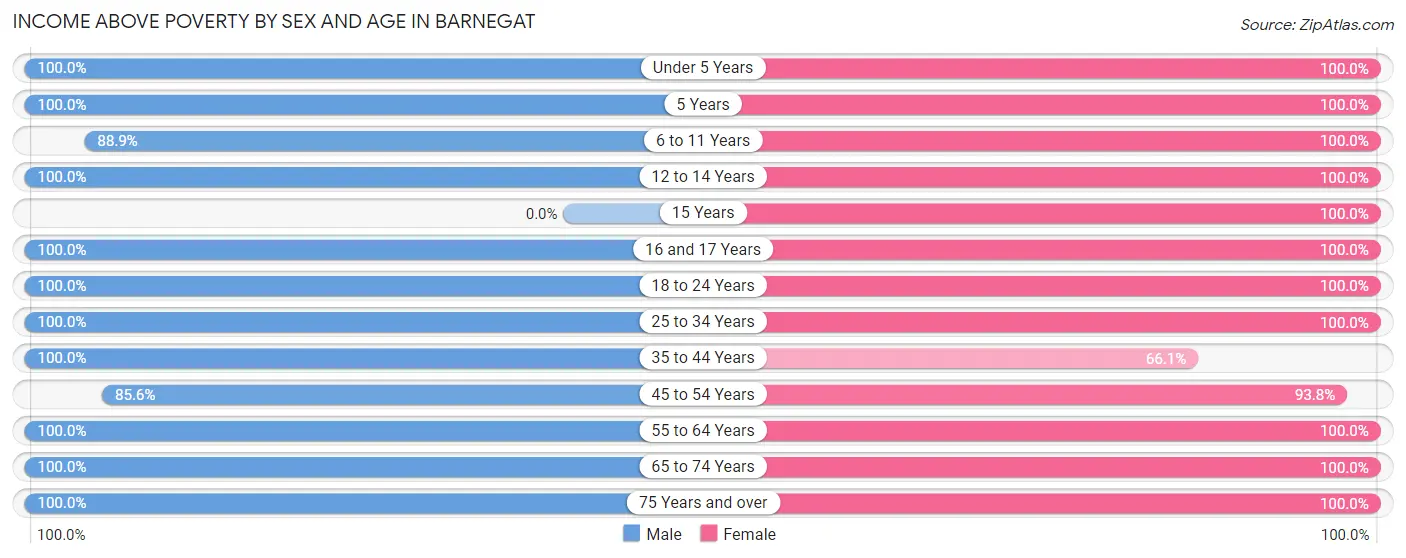
| Age Bracket | Male | Female |
| Under 5 Years | 181 (100.0%) | 130 (100.0%) |
| 5 Years | 20 (100.0%) | 21 (100.0%) |
| 6 to 11 Years | 136 (88.9%) | 121 (100.0%) |
| 12 to 14 Years | 14 (100.0%) | 30 (100.0%) |
| 15 Years | 0 (0.0%) | 21 (100.0%) |
| 16 and 17 Years | 18 (100.0%) | 46 (100.0%) |
| 18 to 24 Years | 166 (100.0%) | 42 (100.0%) |
| 25 to 34 Years | 173 (100.0%) | 192 (100.0%) |
| 35 to 44 Years | 187 (100.0%) | 160 (66.1%) |
| 45 to 54 Years | 113 (85.6%) | 241 (93.8%) |
| 55 to 64 Years | 327 (100.0%) | 377 (100.0%) |
| 65 to 74 Years | 245 (100.0%) | 77 (100.0%) |
| 75 Years and over | 91 (100.0%) | 21 (100.0%) |
| Total | 1,671 (97.9%) | 1,479 (93.8%) |
Income Below Poverty Among Married-Couple Families in Barnegat
The poverty statistics for married-couple families in Barnegat show that 1.8% or 16 of the total 905 families live below the poverty line. Families with 1 or 2 children have the highest poverty rate of 6.3%, comprising of 16 families. On the other hand, families with no children have the lowest poverty rate of 0.0%, which includes 0 families.
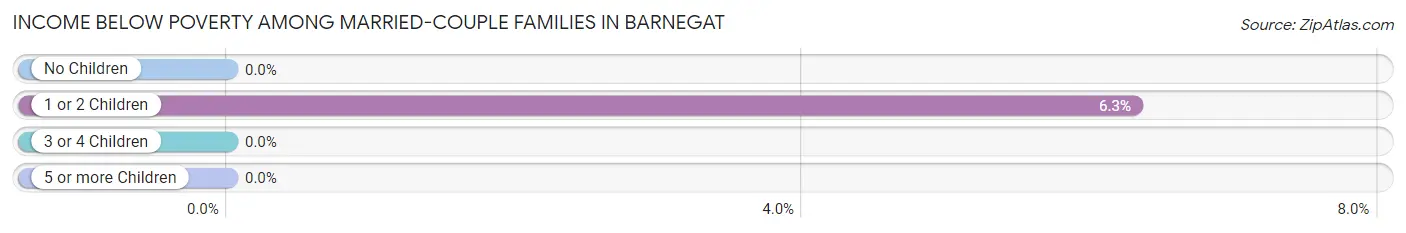
| Children | Above Poverty | Below Poverty |
| No Children | 603 (100.0%) | 0 (0.0%) |
| 1 or 2 Children | 238 (93.7%) | 16 (6.3%) |
| 3 or 4 Children | 48 (100.0%) | 0 (0.0%) |
| 5 or more Children | 0 (0.0%) | 0 (0.0%) |
| Total | 889 (98.2%) | 16 (1.8%) |
Income Below Poverty Among Single-Parent Households in Barnegat
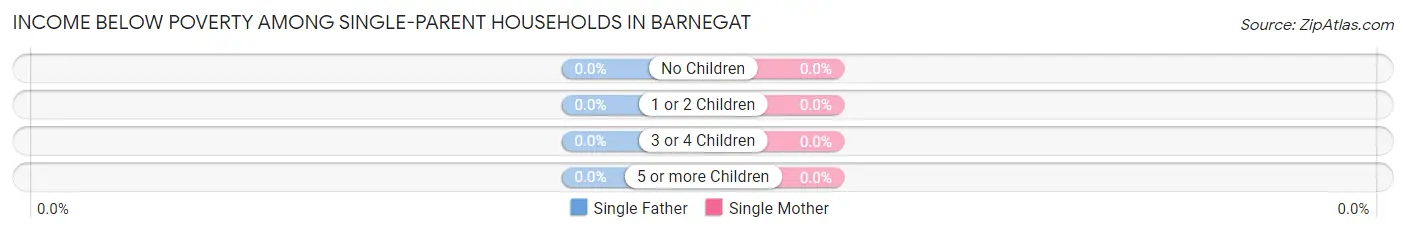
| Children | Single Father | Single Mother |
| No Children | 0 (0.0%) | 0 (0.0%) |
| 1 or 2 Children | 0 (0.0%) | 0 (0.0%) |
| 3 or 4 Children | 0 (0.0%) | 0 (0.0%) |
| 5 or more Children | 0 (0.0%) | 0 (0.0%) |
| Total | 0 (0.0%) | 0 (0.0%) |
Income Below Poverty Among Married-Couple vs Single-Parent Households in Barnegat
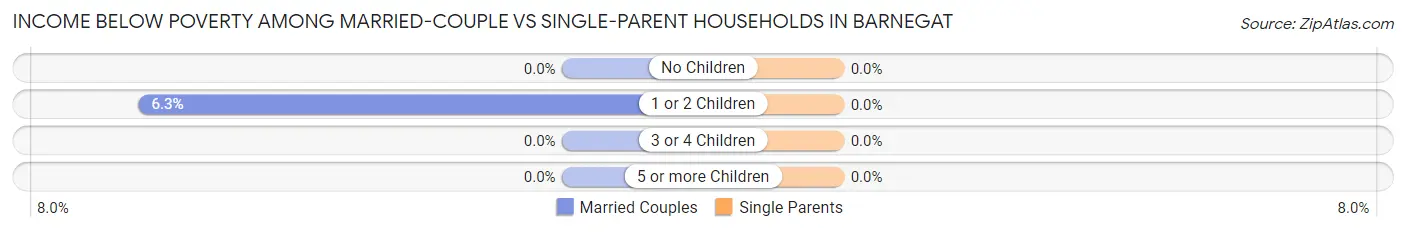
| Children | Married-Couple Families | Single-Parent Households |
| No Children | 0 (0.0%) | 0 (0.0%) |
| 1 or 2 Children | 16 (6.3%) | 0 (0.0%) |
| 3 or 4 Children | 0 (0.0%) | 0 (0.0%) |
| 5 or more Children | 0 (0.0%) | 0 (0.0%) |
| Total | 16 (1.8%) | 0 (0.0%) |
Race in Barnegat
The most populous races in Barnegat are White / Caucasian (3,058 | 93.1%), Hispanic or Latino (329 | 10.0%), and Two or more Races (80 | 2.4%).
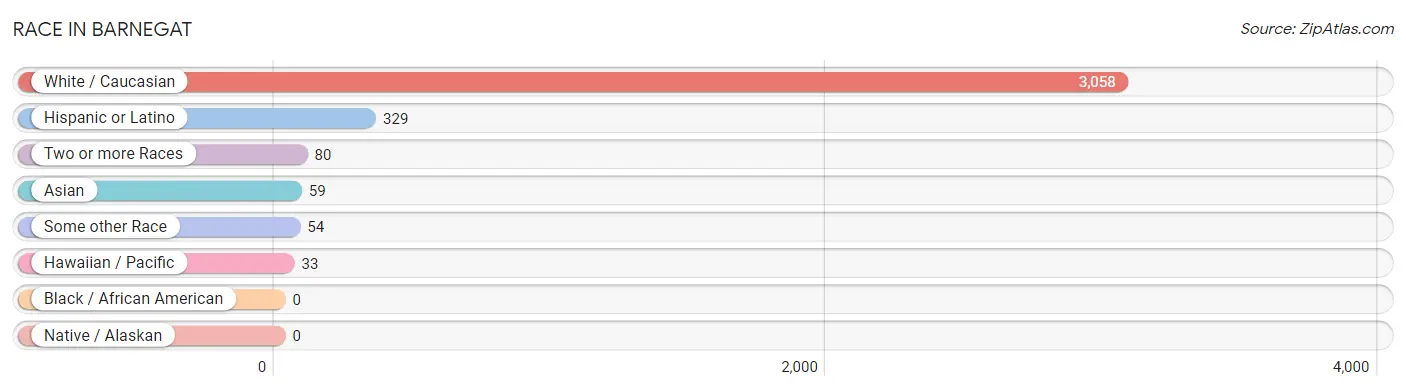
| Race | # Population | % Population |
| Asian | 59 | 1.8% |
| Black / African American | 0 | 0.0% |
| Hawaiian / Pacific | 33 | 1.0% |
| Hispanic or Latino | 329 | 10.0% |
| Native / Alaskan | 0 | 0.0% |
| White / Caucasian | 3,058 | 93.1% |
| Two or more Races | 80 | 2.4% |
| Some other Race | 54 | 1.6% |
| Total | 3,284 | 100.0% |
Ancestry in Barnegat
The most populous ancestries reported in Barnegat are Italian (1,269 | 38.6%), German (878 | 26.7%), Irish (758 | 23.1%), English (370 | 11.3%), and Puerto Rican (221 | 6.7%), together accounting for 106.5% of all Barnegat residents.
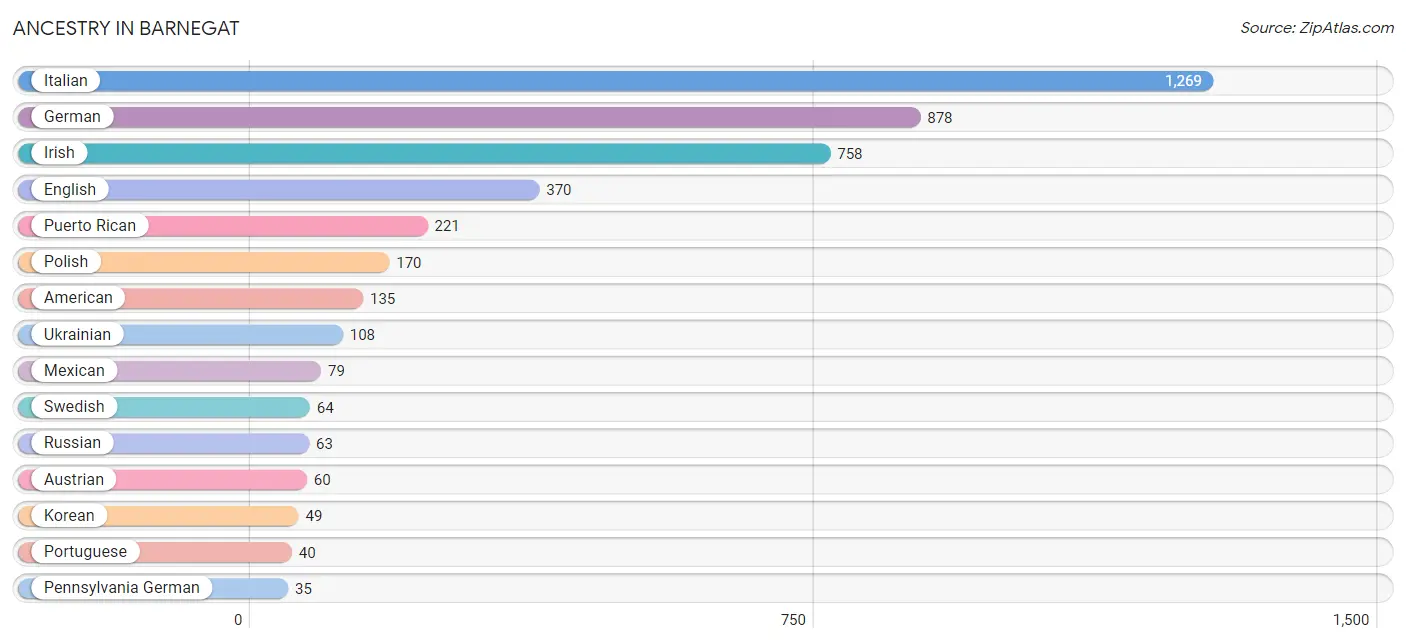
| Ancestry | # Population | % Population |
| African | 13 | 0.4% |
| American | 135 | 4.1% |
| Austrian | 60 | 1.8% |
| Burmese | 18 | 0.5% |
| Central American | 29 | 0.9% |
| Czechoslovakian | 14 | 0.4% |
| English | 370 | 11.3% |
| French | 17 | 0.5% |
| German | 878 | 26.7% |
| Irish | 758 | 23.1% |
| Italian | 1,269 | 38.6% |
| Korean | 49 | 1.5% |
| Mexican | 79 | 2.4% |
| Panamanian | 29 | 0.9% |
| Pennsylvania German | 35 | 1.1% |
| Polish | 170 | 5.2% |
| Portuguese | 40 | 1.2% |
| Puerto Rican | 221 | 6.7% |
| Russian | 63 | 1.9% |
| Slovak | 14 | 0.4% |
| Subsaharan African | 13 | 0.4% |
| Swedish | 64 | 1.9% |
| Tongan | 33 | 1.0% |
| Ukrainian | 108 | 3.3% | View All 24 Rows |
Immigrants in Barnegat
The most numerous immigrant groups reported in Barnegat came from Asia (49 | 1.5%), Philippines (34 | 1.0%), South Eastern Asia (34 | 1.0%), Australia (33 | 1.0%), and Oceania (33 | 1.0%), together accounting for 5.6% of all Barnegat residents.
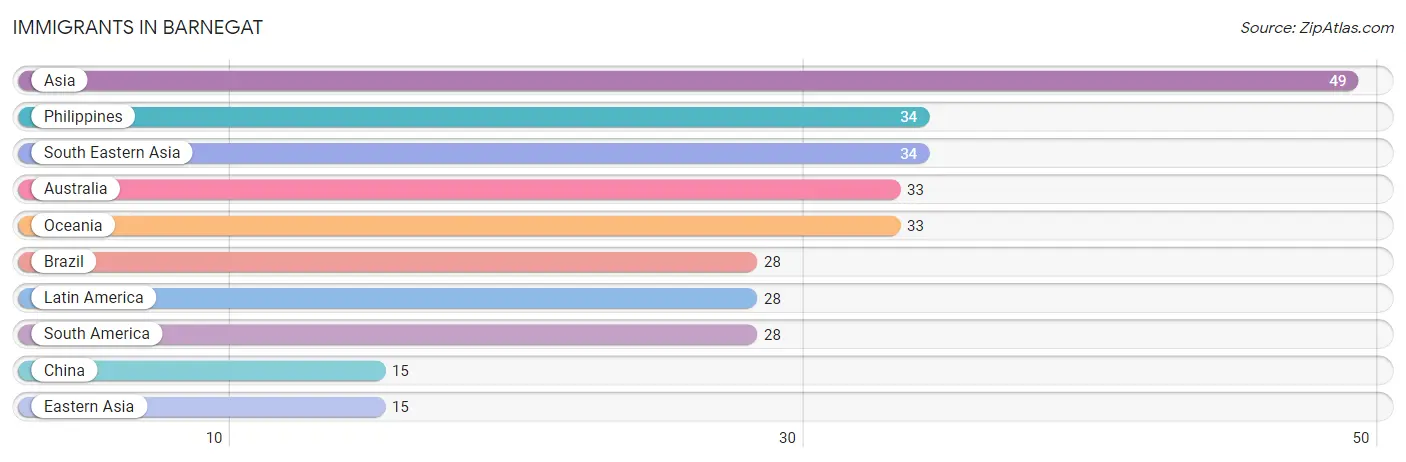
| Immigration Origin | # Population | % Population |
| Asia | 49 | 1.5% |
| Australia | 33 | 1.0% |
| Brazil | 28 | 0.9% |
| China | 15 | 0.5% |
| Eastern Asia | 15 | 0.5% |
| Latin America | 28 | 0.9% |
| Oceania | 33 | 1.0% |
| Philippines | 34 | 1.0% |
| South America | 28 | 0.9% |
| South Eastern Asia | 34 | 1.0% | View All 10 Rows |
Sex and Age in Barnegat
Sex and Age in Barnegat
The most populous age groups in Barnegat are 60 to 64 Years (195 | 11.4%) for men and 60 to 64 Years (297 | 18.8%) for women.
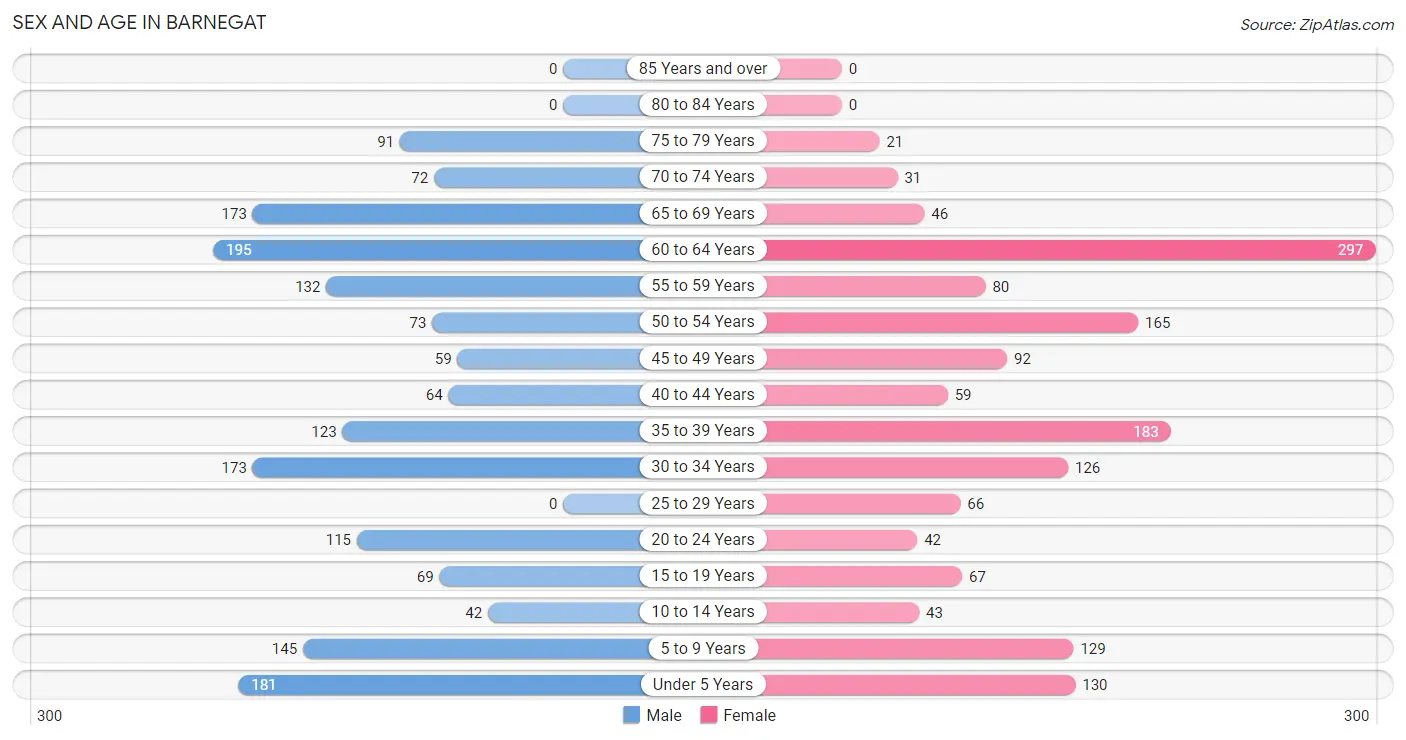
| Age Bracket | Male | Female |
| Under 5 Years | 181 (10.6%) | 130 (8.2%) |
| 5 to 9 Years | 145 (8.5%) | 129 (8.2%) |
| 10 to 14 Years | 42 (2.5%) | 43 (2.7%) |
| 15 to 19 Years | 69 (4.0%) | 67 (4.3%) |
| 20 to 24 Years | 115 (6.7%) | 42 (2.7%) |
| 25 to 29 Years | 0 (0.0%) | 66 (4.2%) |
| 30 to 34 Years | 173 (10.1%) | 126 (8.0%) |
| 35 to 39 Years | 123 (7.2%) | 183 (11.6%) |
| 40 to 44 Years | 64 (3.7%) | 59 (3.7%) |
| 45 to 49 Years | 59 (3.5%) | 92 (5.8%) |
| 50 to 54 Years | 73 (4.3%) | 165 (10.5%) |
| 55 to 59 Years | 132 (7.7%) | 80 (5.1%) |
| 60 to 64 Years | 195 (11.4%) | 297 (18.8%) |
| 65 to 69 Years | 173 (10.1%) | 46 (2.9%) |
| 70 to 74 Years | 72 (4.2%) | 31 (2.0%) |
| 75 to 79 Years | 91 (5.3%) | 21 (1.3%) |
| 80 to 84 Years | 0 (0.0%) | 0 (0.0%) |
| 85 Years and over | 0 (0.0%) | 0 (0.0%) |
| Total | 1,707 (100.0%) | 1,577 (100.0%) |
Families and Households in Barnegat
Median Family Size in Barnegat
The median family size in Barnegat is 2.90 persons per family, with single female/mother families (41 | 3.9%) accounting for the largest median family size of 3.49 persons per family. On the other hand, single male/father families (95 | 9.1%) represent the smallest median family size with 2.63 persons per family.
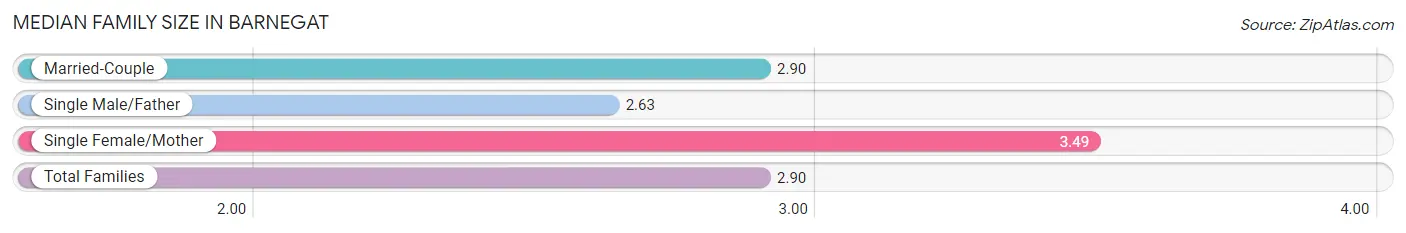
| Family Type | # Families | Family Size |
| Married-Couple | 905 (86.9%) | 2.90 |
| Single Male/Father | 95 (9.1%) | 2.63 |
| Single Female/Mother | 41 (3.9%) | 3.49 |
| Total Families | 1,041 (100.0%) | 2.90 |
Median Household Size in Barnegat
The median household size in Barnegat is 2.73 persons per household, with single female/mother households (41 | 3.4%) accounting for the largest median household size of 3.88 persons per household. non-family households (163 | 13.5%) represent the smallest median household size with 1.15 persons per household.
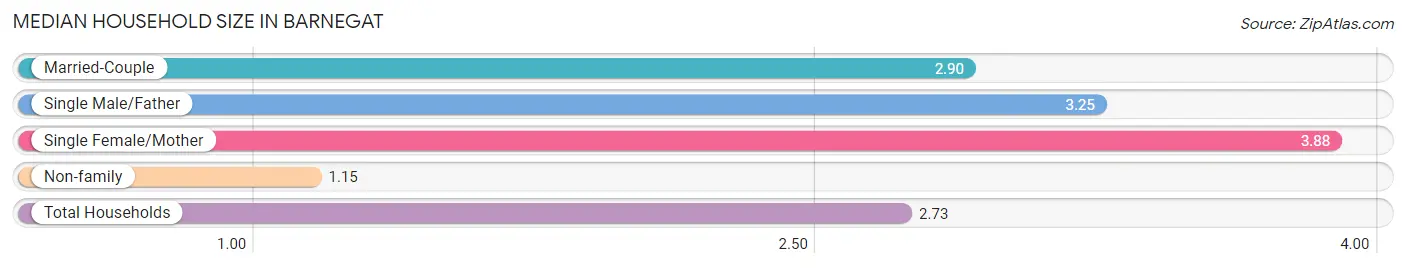
| Household Type | # Households | Household Size |
| Married-Couple | 905 (75.2%) | 2.90 |
| Single Male/Father | 95 (7.9%) | 3.25 |
| Single Female/Mother | 41 (3.4%) | 3.88 |
| Non-family | 163 (13.5%) | 1.15 |
| Total Households | 1,204 (100.0%) | 2.73 |
Household Size by Marriage Status in Barnegat
Out of a total of 1,204 households in Barnegat, 1,041 (86.5%) are family households, while 163 (13.5%) are nonfamily households. The most numerous type of family households are 2-person households, comprising 500, and the most common type of nonfamily households are 1-person households, comprising 131.
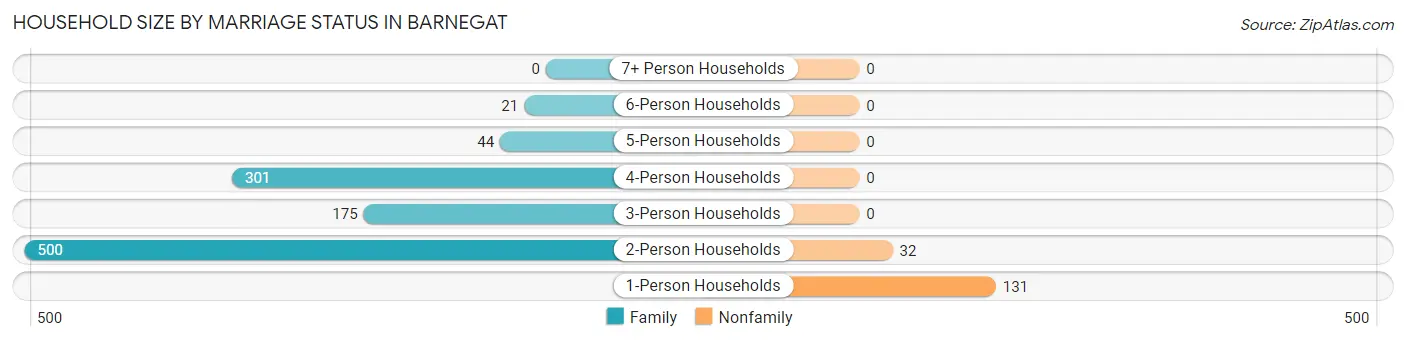
| Household Size | Family Households | Nonfamily Households |
| 1-Person Households | - | 131 (10.9%) |
| 2-Person Households | 500 (41.5%) | 32 (2.7%) |
| 3-Person Households | 175 (14.5%) | 0 (0.0%) |
| 4-Person Households | 301 (25.0%) | 0 (0.0%) |
| 5-Person Households | 44 (3.6%) | 0 (0.0%) |
| 6-Person Households | 21 (1.7%) | 0 (0.0%) |
| 7+ Person Households | 0 (0.0%) | 0 (0.0%) |
| Total | 1,041 (86.5%) | 163 (13.5%) |
Female Fertility in Barnegat
Fertility by Age in Barnegat
Average fertility rate in Barnegat is 145.0 births per 1,000 women. Women in the age bracket of 35 to 50 years have the highest fertility rate with 177.0 births per 1,000 women. Women in the age bracket of 35 to 50 years acount for 64.1% of all women with births.
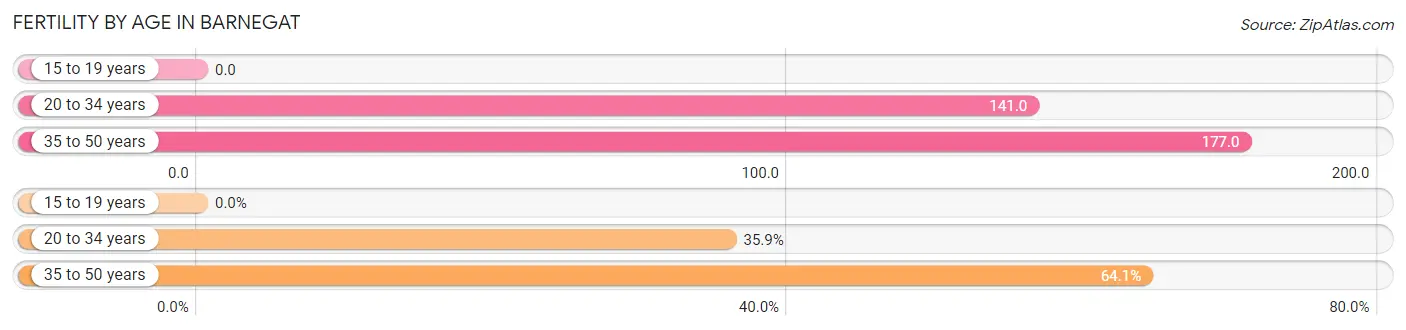
| Age Bracket | Women with Births | Births / 1,000 Women |
| 15 to 19 years | 0 (0.0%) | 0.0 |
| 20 to 34 years | 33 (35.9%) | 141.0 |
| 35 to 50 years | 59 (64.1%) | 177.0 |
| Total | 92 (100.0%) | 145.0 |
Fertility by Age by Marriage Status in Barnegat
35.9% of women with births (92) in Barnegat are married. The highest percentage of unmarried women with births falls into 35 to 50 years age bracket with 100.0% of them unmarried at the time of birth, while the lowest percentage of unmarried women with births belong to 20 to 34 years age bracket with 0.0% of them unmarried.
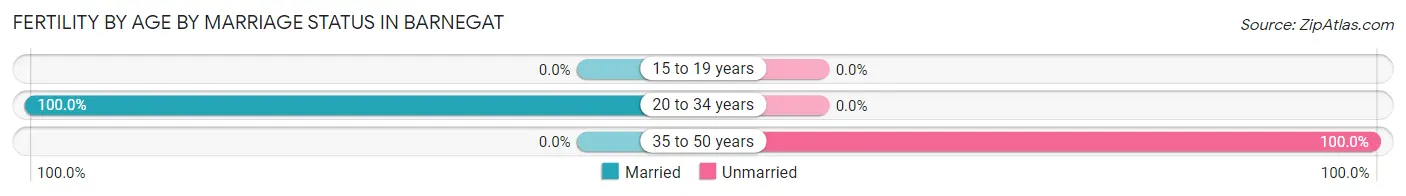
| Age Bracket | Married | Unmarried |
| 15 to 19 years | 0 (0.0%) | 0 (0.0%) |
| 20 to 34 years | 33 (100.0%) | 0 (0.0%) |
| 35 to 50 years | 0 (0.0%) | 59 (100.0%) |
| Total | 33 (35.9%) | 59 (64.1%) |
Fertility by Education in Barnegat
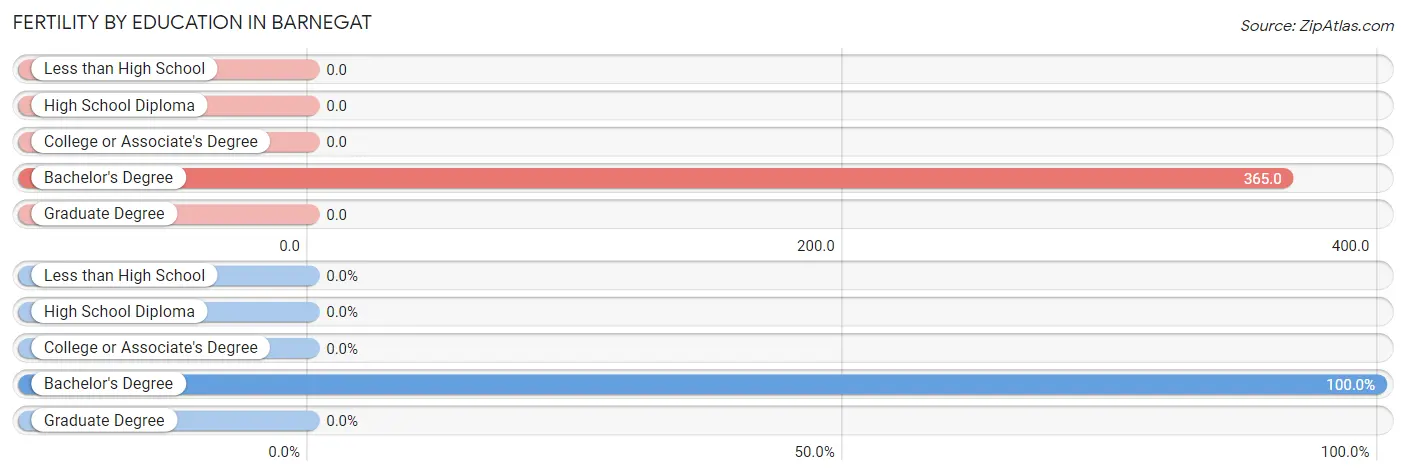
| Educational Attainment | Women with Births | Births / 1,000 Women |
| Less than High School | 0 (0.0%) | 0.0 |
| High School Diploma | 0 (0.0%) | 0.0 |
| College or Associate's Degree | 0 (0.0%) | 0.0 |
| Bachelor's Degree | 92 (100.0%) | 365.0 |
| Graduate Degree | 0 (0.0%) | 0.0 |
| Total | 92 (100.0%) | 145.0 |
Fertility by Education by Marriage Status in Barnegat
64.1% of women with births in Barnegat are unmarried. Women with the educational attainment of bachelor's degree are most likely to be married with 35.9% of them married at childbirth, while women with the educational attainment of bachelor's degree are least likely to be married with 64.1% of them unmarried at childbirth.
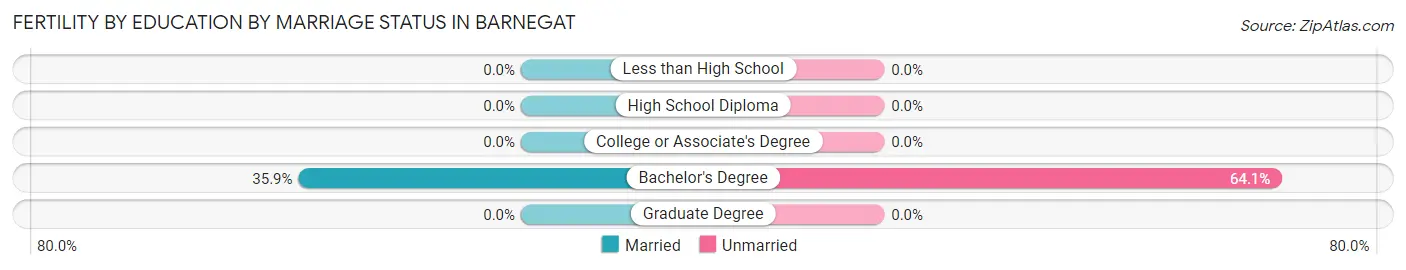
| Educational Attainment | Married | Unmarried |
| Less than High School | 0 (0.0%) | 0 (0.0%) |
| High School Diploma | 0 (0.0%) | 0 (0.0%) |
| College or Associate's Degree | 0 (0.0%) | 0 (0.0%) |
| Bachelor's Degree | 33 (35.9%) | 59 (64.1%) |
| Graduate Degree | 0 (0.0%) | 0 (0.0%) |
| Total | 33 (35.9%) | 59 (64.1%) |
Employment Characteristics in Barnegat
Employment by Class of Employer in Barnegat
Among the 1,667 employed individuals in Barnegat, private company employees (876 | 52.5%), local government employees (274 | 16.4%), and self-employed (not incorporated) (187 | 11.2%) make up the most common classes of employment.
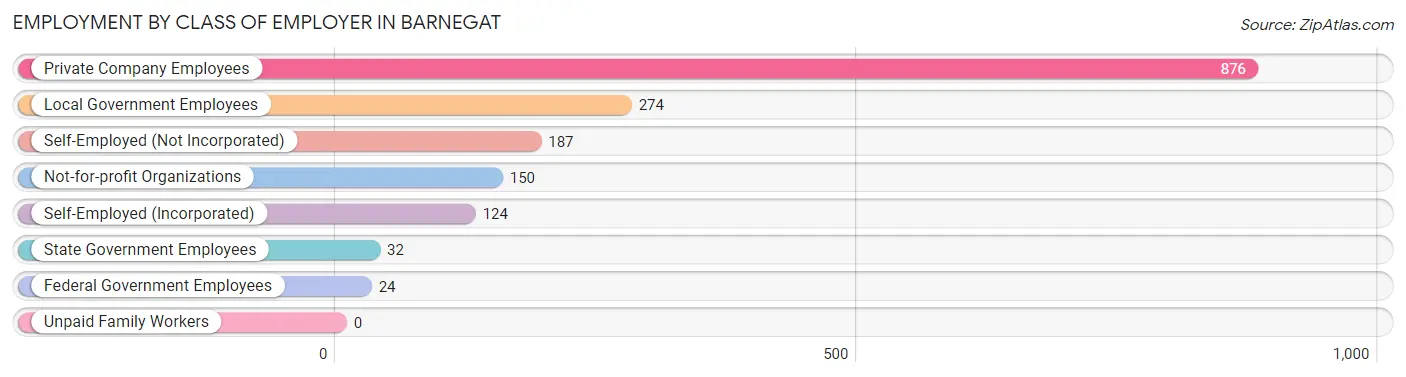
| Employer Class | # Employees | % Employees |
| Private Company Employees | 876 | 52.5% |
| Self-Employed (Incorporated) | 124 | 7.4% |
| Self-Employed (Not Incorporated) | 187 | 11.2% |
| Not-for-profit Organizations | 150 | 9.0% |
| Local Government Employees | 274 | 16.4% |
| State Government Employees | 32 | 1.9% |
| Federal Government Employees | 24 | 1.4% |
| Unpaid Family Workers | 0 | 0.0% |
| Total | 1,667 | 100.0% |
Employment Status by Age in Barnegat
According to the labor force statistics for Barnegat, out of the total population over 16 years of age (2,593), 69.1% or 1,792 individuals are in the labor force, with 4.8% or 86 of them unemployed. The age group with the highest labor force participation rate is 20 to 24 years, with 100.0% or 157 individuals in the labor force. Within the labor force, the 25 to 29 years age range has the highest percentage of unemployed individuals, with 28.8% or 19 of them being unemployed.
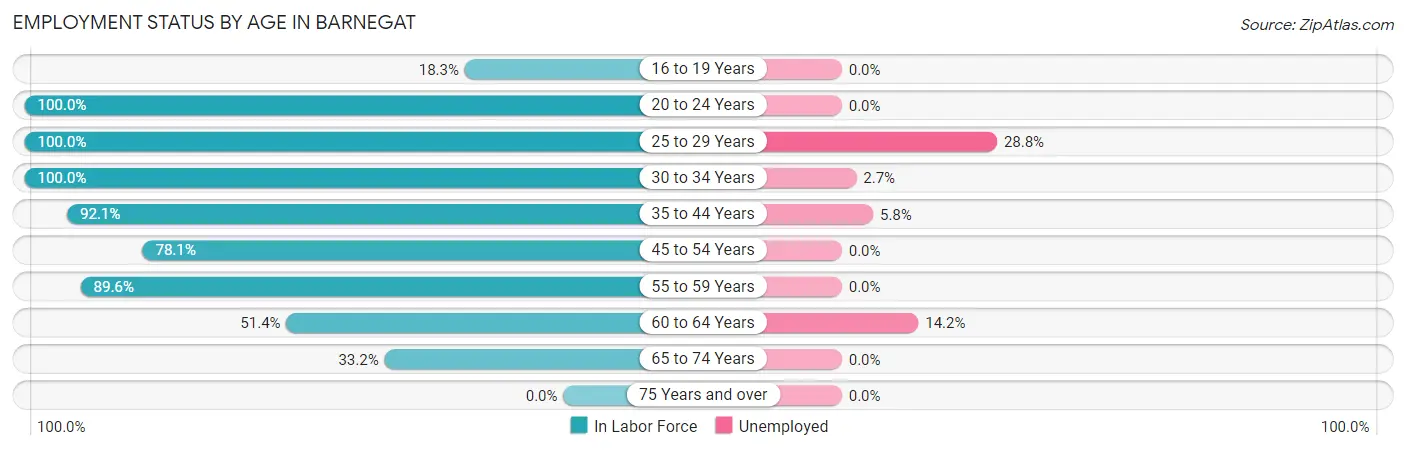
| Age Bracket | In Labor Force | Unemployed |
| 16 to 19 Years | 21 (18.3%) | 0 (0.0%) |
| 20 to 24 Years | 157 (100.0%) | 0 (0.0%) |
| 25 to 29 Years | 66 (100.0%) | 19 (28.8%) |
| 30 to 34 Years | 299 (100.0%) | 8 (2.7%) |
| 35 to 44 Years | 395 (92.1%) | 23 (5.8%) |
| 45 to 54 Years | 304 (78.1%) | 0 (0.0%) |
| 55 to 59 Years | 190 (89.6%) | 0 (0.0%) |
| 60 to 64 Years | 253 (51.4%) | 36 (14.2%) |
| 65 to 74 Years | 107 (33.2%) | 0 (0.0%) |
| 75 Years and over | 0 (0.0%) | 0 (0.0%) |
| Total | 1,792 (69.1%) | 86 (4.8%) |
Employment Status by Educational Attainment in Barnegat
According to labor force statistics for Barnegat, 79.9% of individuals (1,508) out of the total population between 25 and 64 years of age (1,887) are in the labor force, with 5.7% or 86 of them being unemployed. The group with the highest labor force participation rate are those with the educational attainment of bachelor's degree or higher, with 88.9% or 769 individuals in the labor force. Within the labor force, individuals with high school diploma education have the highest percentage of unemployment, with 17.0% or 66 of them being unemployed.
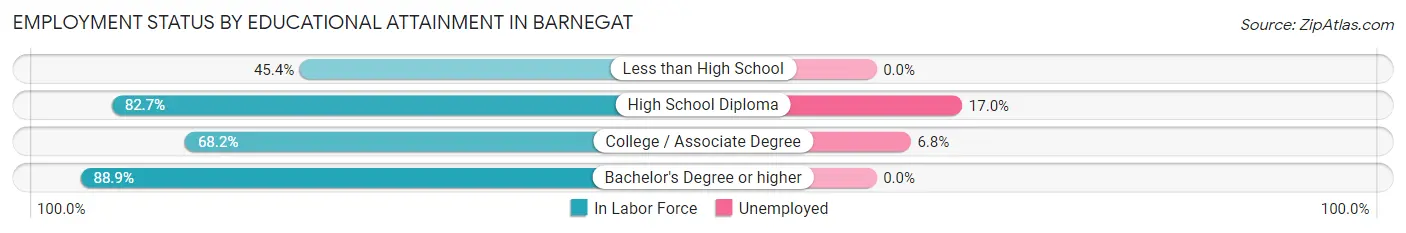
| Educational Attainment | In Labor Force | Unemployed |
| Less than High School | 54 (45.4%) | 0 (0.0%) |
| High School Diploma | 388 (82.7%) | 80 (17.0%) |
| College / Associate Degree | 296 (68.2%) | 30 (6.8%) |
| Bachelor's Degree or higher | 769 (88.9%) | 0 (0.0%) |
| Total | 1,508 (79.9%) | 108 (5.7%) |
Employment Occupations by Sex in Barnegat
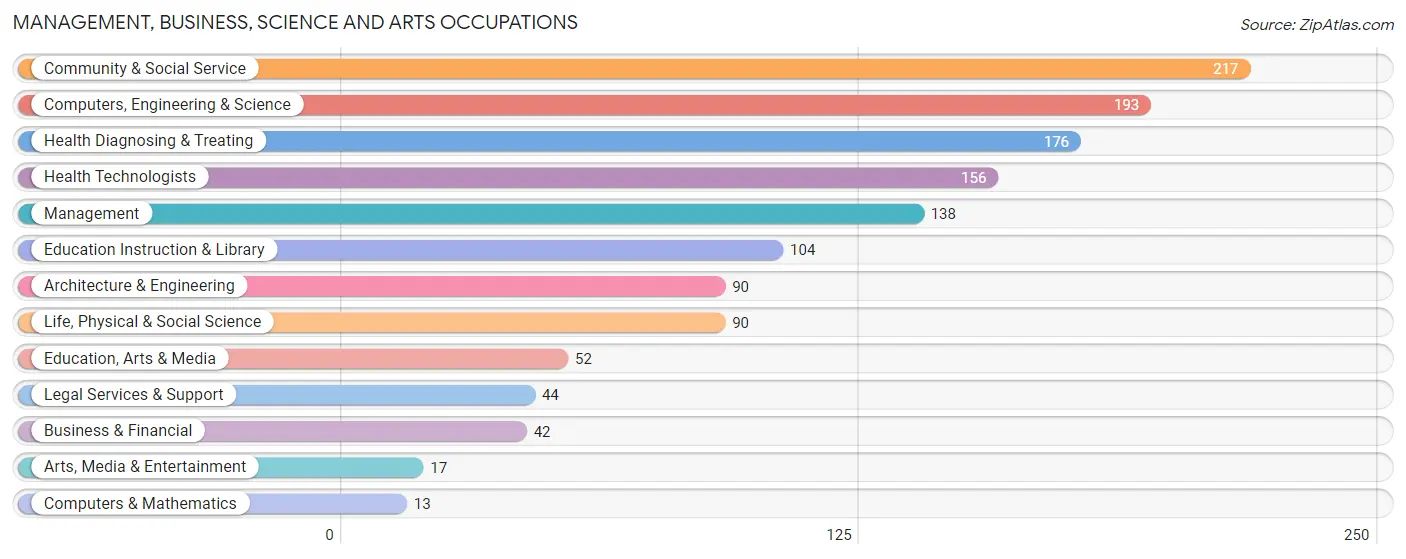
Management, Business, Science and Arts Occupations
The most common Management, Business, Science and Arts occupations in Barnegat are Community & Social Service (217 | 12.7%), Computers, Engineering & Science (193 | 11.3%), Health Diagnosing & Treating (176 | 10.3%), Health Technologists (156 | 9.1%), and Management (138 | 8.1%).
Management, Business, Science and Arts Occupations by Sex
Within the Management, Business, Science and Arts occupations in Barnegat, the most male-oriented occupations are Management (100.0%), Architecture & Engineering (100.0%), and Computers, Engineering & Science (76.7%), while the most female-oriented occupations are Computers & Mathematics (100.0%), Legal Services & Support (100.0%), and Arts, Media & Entertainment (100.0%).
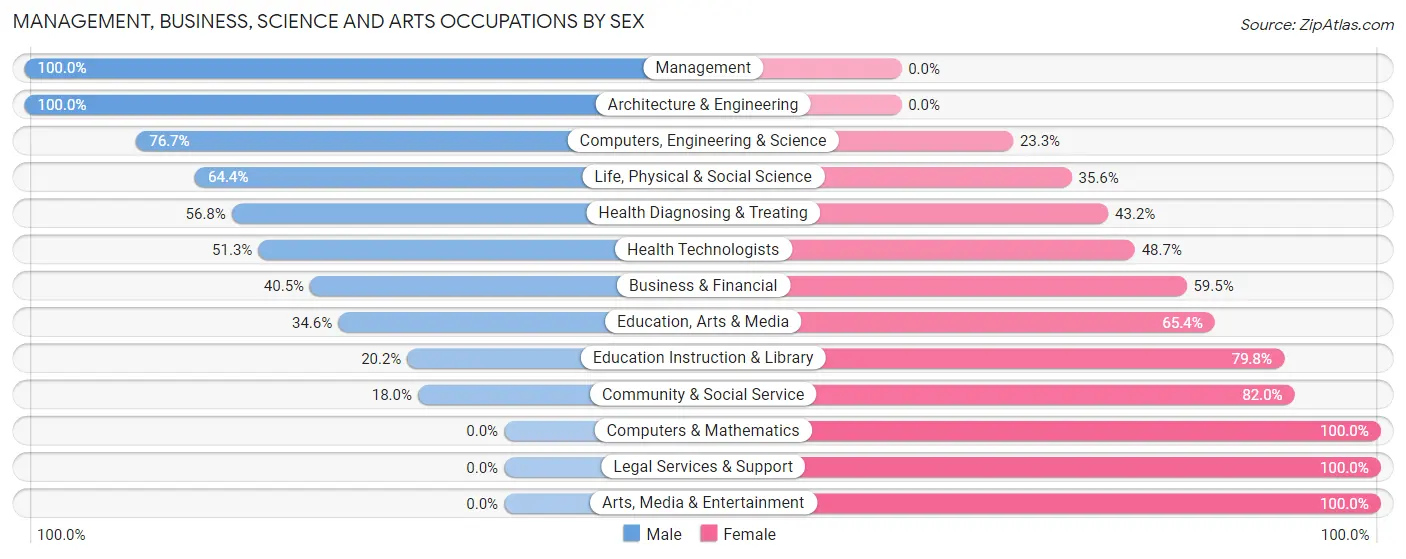
| Occupation | Male | Female |
| Management | 138 (100.0%) | 0 (0.0%) |
| Business & Financial | 17 (40.5%) | 25 (59.5%) |
| Computers, Engineering & Science | 148 (76.7%) | 45 (23.3%) |
| Computers & Mathematics | 0 (0.0%) | 13 (100.0%) |
| Architecture & Engineering | 90 (100.0%) | 0 (0.0%) |
| Life, Physical & Social Science | 58 (64.4%) | 32 (35.6%) |
| Community & Social Service | 39 (18.0%) | 178 (82.0%) |
| Education, Arts & Media | 18 (34.6%) | 34 (65.4%) |
| Legal Services & Support | 0 (0.0%) | 44 (100.0%) |
| Education Instruction & Library | 21 (20.2%) | 83 (79.8%) |
| Arts, Media & Entertainment | 0 (0.0%) | 17 (100.0%) |
| Health Diagnosing & Treating | 100 (56.8%) | 76 (43.2%) |
| Health Technologists | 80 (51.3%) | 76 (48.7%) |
| Total (Category) | 442 (57.7%) | 324 (42.3%) |
| Total (Overall) | 957 (56.1%) | 749 (43.9%) |
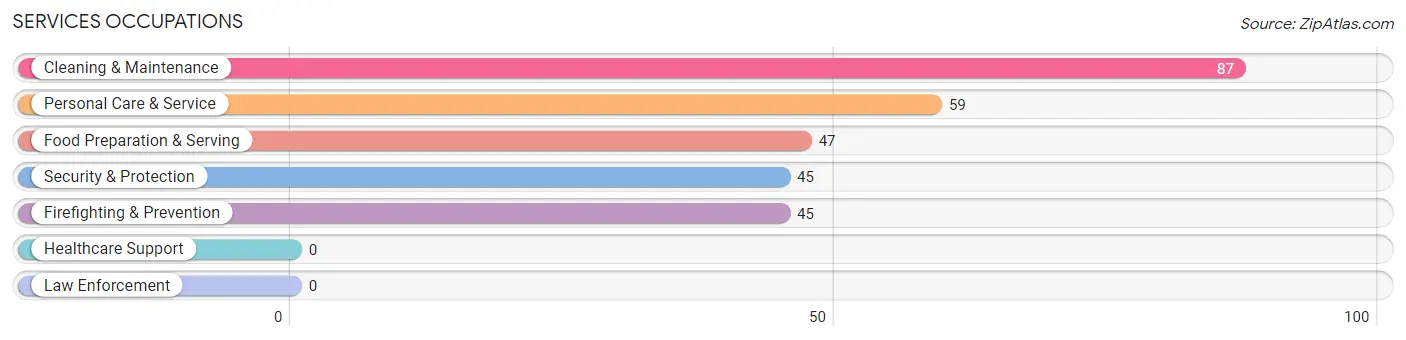
Services Occupations
The most common Services occupations in Barnegat are Cleaning & Maintenance (87 | 5.1%), Personal Care & Service (59 | 3.5%), Food Preparation & Serving (47 | 2.8%), Security & Protection (45 | 2.6%), and Firefighting & Prevention (45 | 2.6%).
Services Occupations by Sex
Within the Services occupations in Barnegat, the most male-oriented occupations are Security & Protection (100.0%), Firefighting & Prevention (100.0%), and Food Preparation & Serving (48.9%), while the most female-oriented occupations are Personal Care & Service (100.0%), Cleaning & Maintenance (63.2%), and Food Preparation & Serving (51.1%).
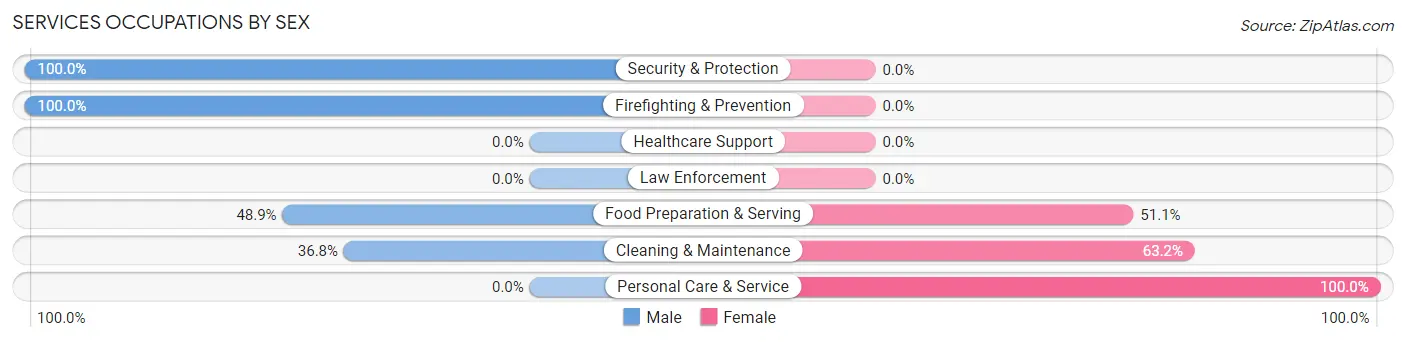
| Occupation | Male | Female |
| Healthcare Support | 0 (0.0%) | 0 (0.0%) |
| Security & Protection | 45 (100.0%) | 0 (0.0%) |
| Firefighting & Prevention | 45 (100.0%) | 0 (0.0%) |
| Law Enforcement | 0 (0.0%) | 0 (0.0%) |
| Food Preparation & Serving | 23 (48.9%) | 24 (51.1%) |
| Cleaning & Maintenance | 32 (36.8%) | 55 (63.2%) |
| Personal Care & Service | 0 (0.0%) | 59 (100.0%) |
| Total (Category) | 100 (42.0%) | 138 (58.0%) |
| Total (Overall) | 957 (56.1%) | 749 (43.9%) |
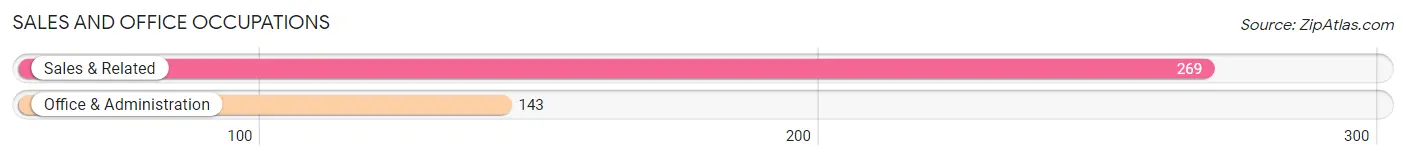
Sales and Office Occupations
The most common Sales and Office occupations in Barnegat are Sales & Related (269 | 15.8%), and Office & Administration (143 | 8.4%).
Sales and Office Occupations by Sex
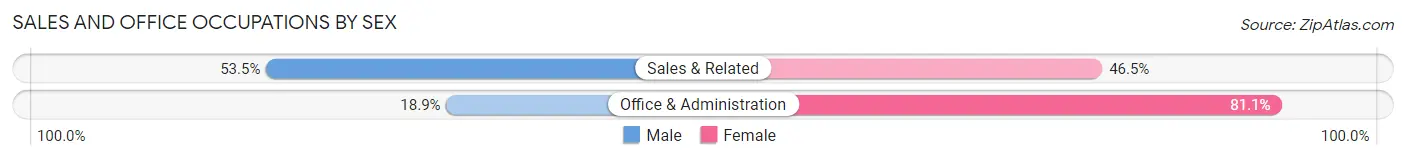
| Occupation | Male | Female |
| Sales & Related | 144 (53.5%) | 125 (46.5%) |
| Office & Administration | 27 (18.9%) | 116 (81.1%) |
| Total (Category) | 171 (41.5%) | 241 (58.5%) |
| Total (Overall) | 957 (56.1%) | 749 (43.9%) |
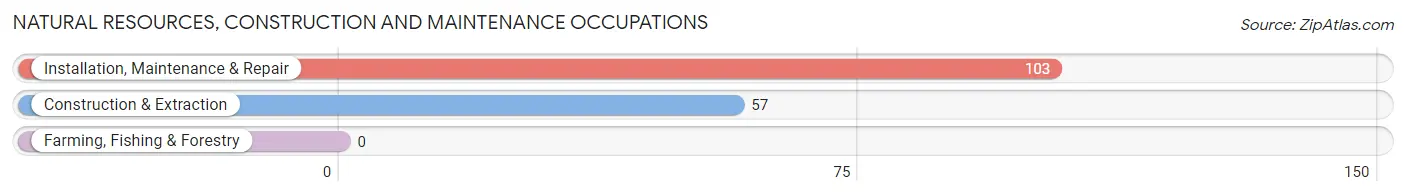
Natural Resources, Construction and Maintenance Occupations
The most common Natural Resources, Construction and Maintenance occupations in Barnegat are Installation, Maintenance & Repair (103 | 6.0%), and Construction & Extraction (57 | 3.3%).
Natural Resources, Construction and Maintenance Occupations by Sex
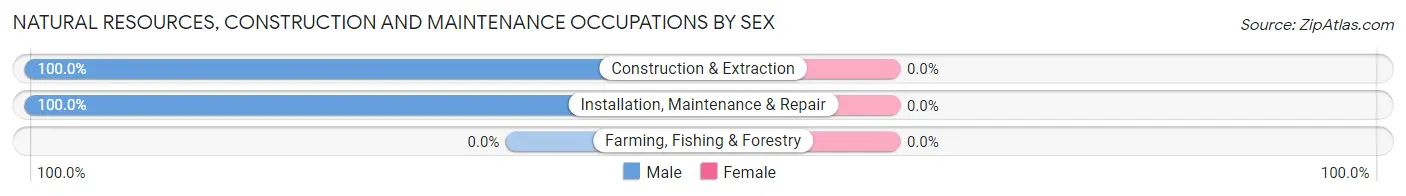
| Occupation | Male | Female |
| Farming, Fishing & Forestry | 0 (0.0%) | 0 (0.0%) |
| Construction & Extraction | 57 (100.0%) | 0 (0.0%) |
| Installation, Maintenance & Repair | 103 (100.0%) | 0 (0.0%) |
| Total (Category) | 160 (100.0%) | 0 (0.0%) |
| Total (Overall) | 957 (56.1%) | 749 (43.9%) |
Production, Transportation and Moving Occupations
The most common Production, Transportation and Moving occupations in Barnegat are Material Moving (82 | 4.8%), and Transportation (48 | 2.8%).
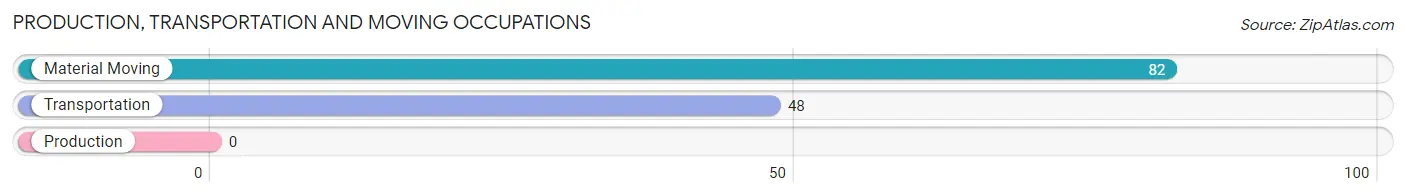
Production, Transportation and Moving Occupations by Sex
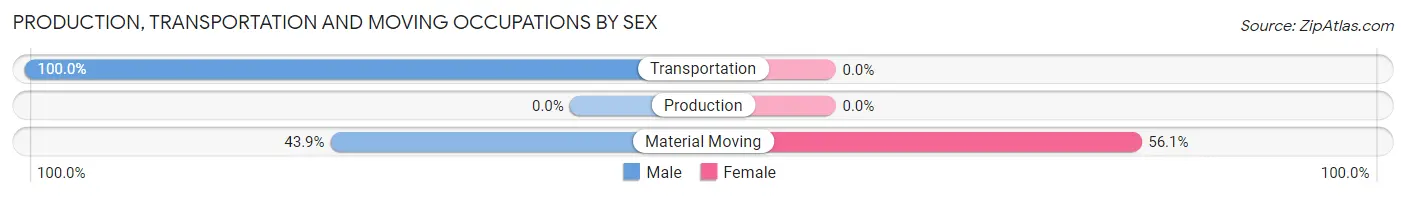
| Occupation | Male | Female |
| Production | 0 (0.0%) | 0 (0.0%) |
| Transportation | 48 (100.0%) | 0 (0.0%) |
| Material Moving | 36 (43.9%) | 46 (56.1%) |
| Total (Category) | 84 (64.6%) | 46 (35.4%) |
| Total (Overall) | 957 (56.1%) | 749 (43.9%) |
Employment Industries by Sex in Barnegat
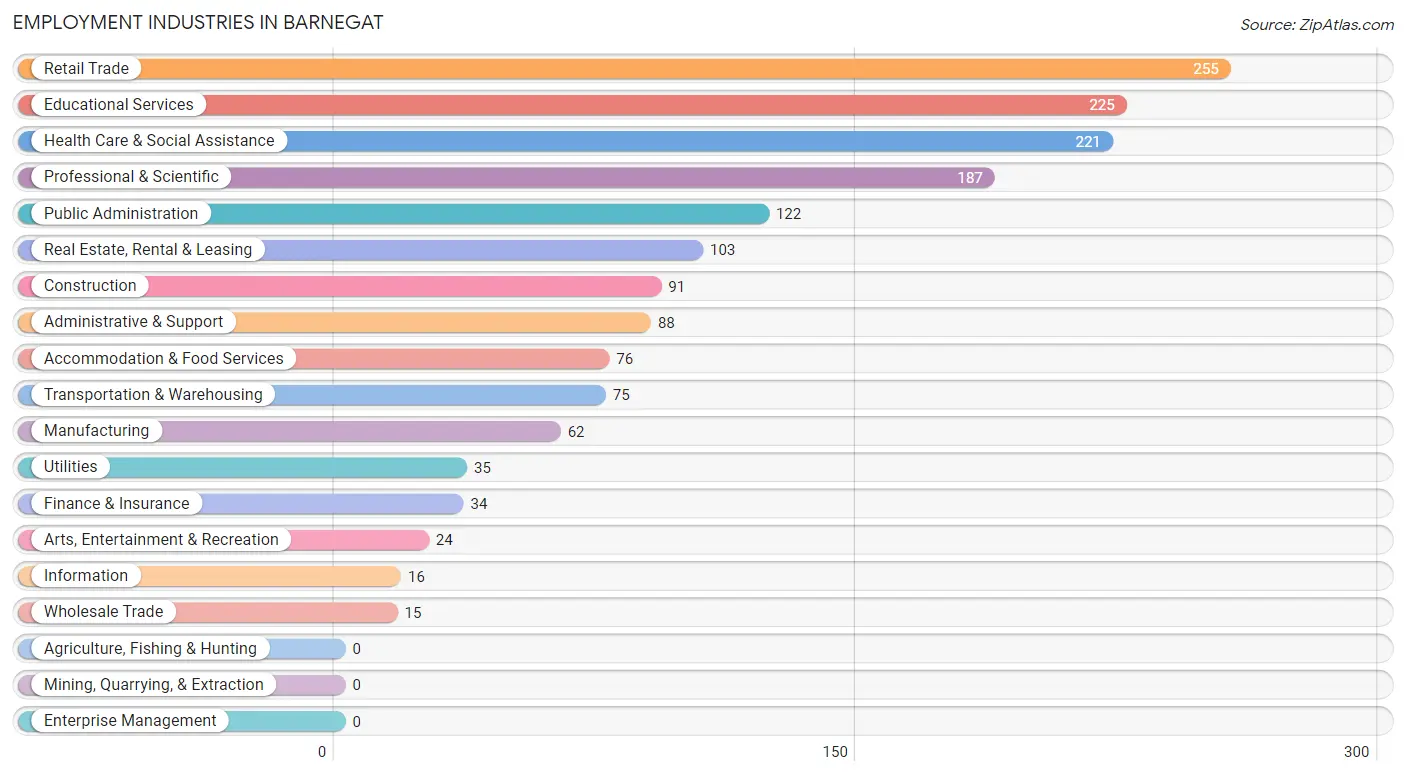
Employment Industries in Barnegat
The major employment industries in Barnegat include Retail Trade (255 | 14.9%), Educational Services (225 | 13.2%), Health Care & Social Assistance (221 | 13.0%), Professional & Scientific (187 | 11.0%), and Public Administration (122 | 7.1%).
Employment Industries by Sex in Barnegat
The Barnegat industries that see more men than women are Manufacturing (100.0%), Wholesale Trade (100.0%), and Transportation & Warehousing (100.0%), whereas the industries that tend to have a higher number of women are Information (100.0%), Health Care & Social Assistance (82.8%), and Educational Services (72.4%).
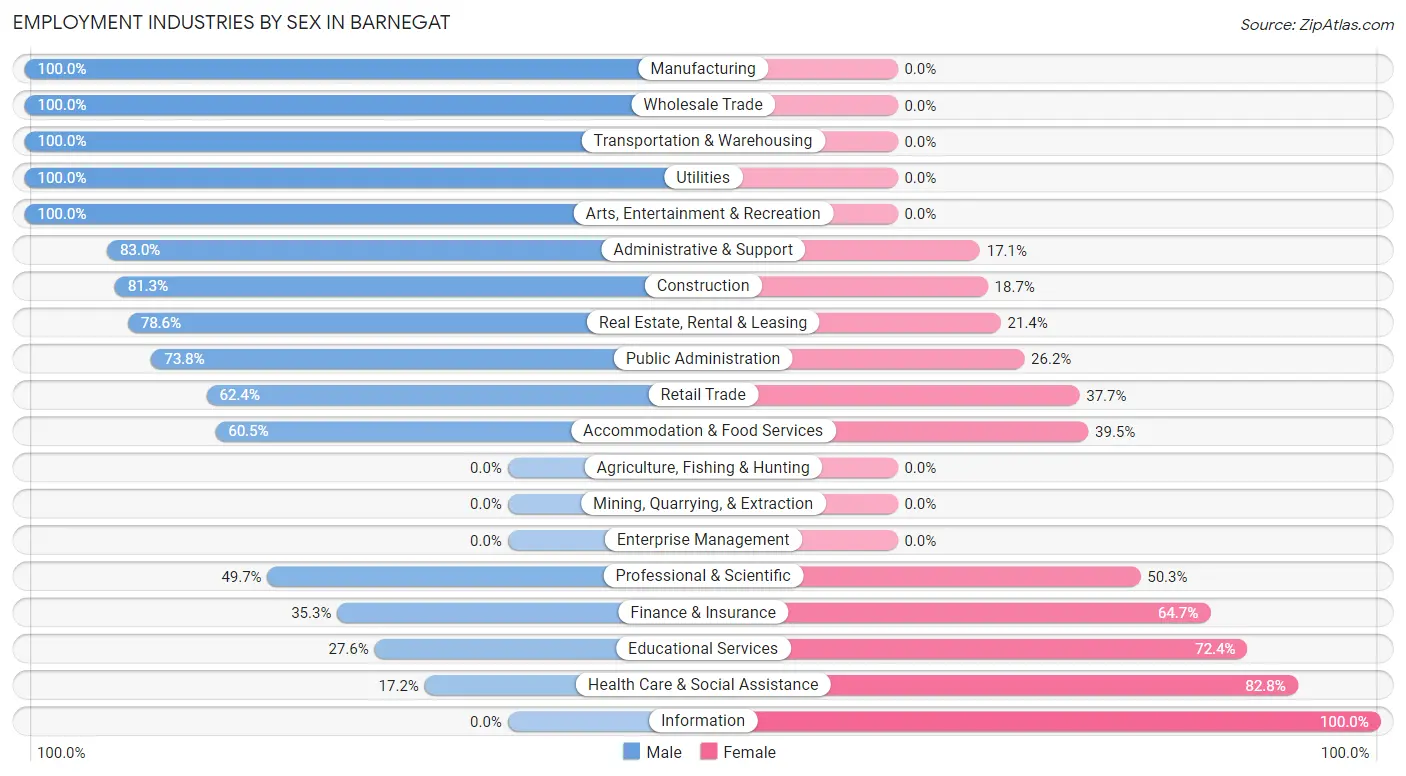
| Industry | Male | Female |
| Agriculture, Fishing & Hunting | 0 (0.0%) | 0 (0.0%) |
| Mining, Quarrying, & Extraction | 0 (0.0%) | 0 (0.0%) |
| Construction | 74 (81.3%) | 17 (18.7%) |
| Manufacturing | 62 (100.0%) | 0 (0.0%) |
| Wholesale Trade | 15 (100.0%) | 0 (0.0%) |
| Retail Trade | 159 (62.4%) | 96 (37.7%) |
| Transportation & Warehousing | 75 (100.0%) | 0 (0.0%) |
| Utilities | 35 (100.0%) | 0 (0.0%) |
| Information | 0 (0.0%) | 16 (100.0%) |
| Finance & Insurance | 12 (35.3%) | 22 (64.7%) |
| Real Estate, Rental & Leasing | 81 (78.6%) | 22 (21.4%) |
| Professional & Scientific | 93 (49.7%) | 94 (50.3%) |
| Enterprise Management | 0 (0.0%) | 0 (0.0%) |
| Administrative & Support | 73 (83.0%) | 15 (17.1%) |
| Educational Services | 62 (27.6%) | 163 (72.4%) |
| Health Care & Social Assistance | 38 (17.2%) | 183 (82.8%) |
| Arts, Entertainment & Recreation | 24 (100.0%) | 0 (0.0%) |
| Accommodation & Food Services | 46 (60.5%) | 30 (39.5%) |
| Public Administration | 90 (73.8%) | 32 (26.2%) |
| Total | 957 (56.1%) | 749 (43.9%) |
Education in Barnegat
School Enrollment in Barnegat
The most common levels of schooling among the 685 students in Barnegat are elementary school (244 | 35.6%), nursery / preschool (111 | 16.2%), and college / undergraduate (94 | 13.7%).
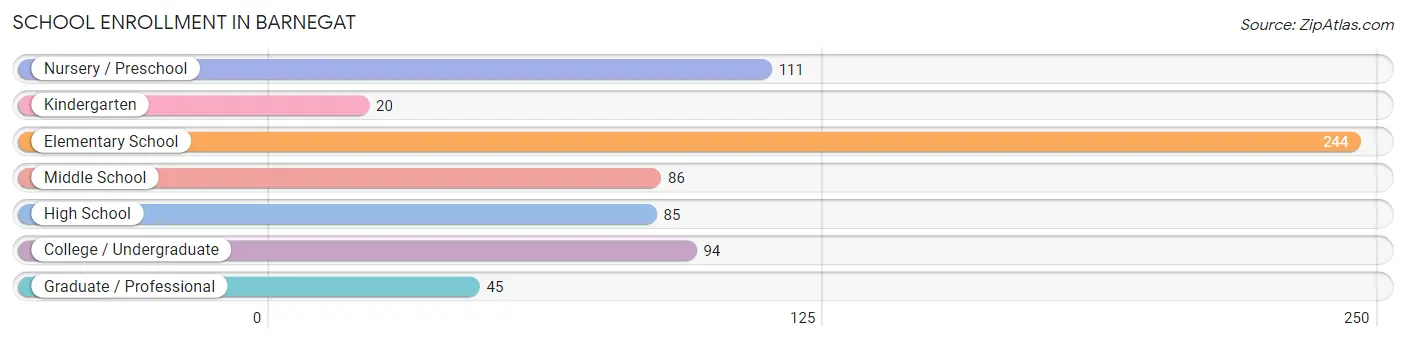
| School Level | # Students | % Students |
| Nursery / Preschool | 111 | 16.2% |
| Kindergarten | 20 | 2.9% |
| Elementary School | 244 | 35.6% |
| Middle School | 86 | 12.6% |
| High School | 85 | 12.4% |
| College / Undergraduate | 94 | 13.7% |
| Graduate / Professional | 45 | 6.6% |
| Total | 685 | 100.0% |
School Enrollment by Age by Funding Source in Barnegat
Out of a total of 685 students who are enrolled in schools in Barnegat, 71 (10.4%) attend a private institution, while the remaining 614 (89.6%) are enrolled in public schools. The age group of 35 years and over has the highest likelihood of being enrolled in private schools, with 41 (100.0% in the age bracket) enrolled. Conversely, the age group of 3 to 4 year olds has the lowest likelihood of being enrolled in a private school, with 90 (100.0% in the age bracket) attending a public institution.
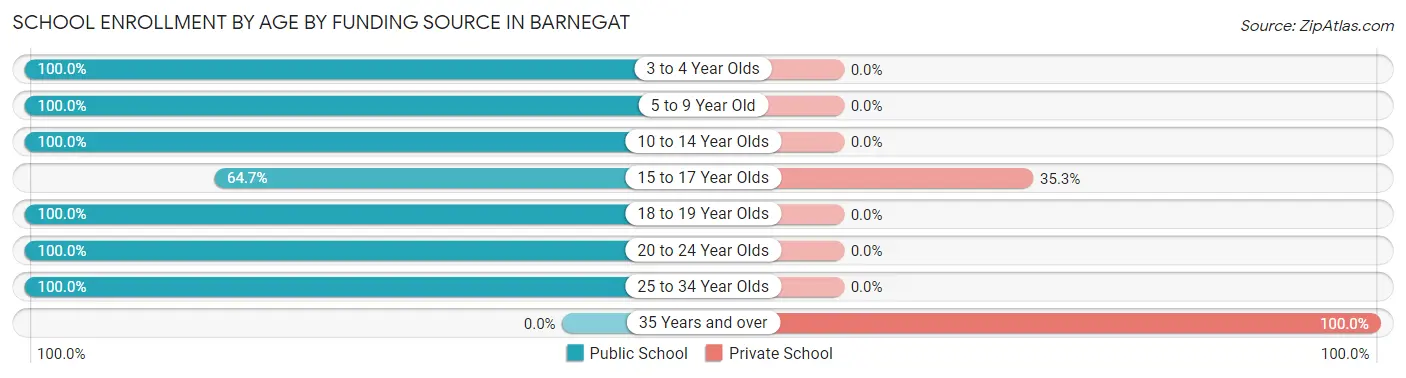
| Age Bracket | Public School | Private School |
| 3 to 4 Year Olds | 90 (100.0%) | 0 (0.0%) |
| 5 to 9 Year Old | 274 (100.0%) | 0 (0.0%) |
| 10 to 14 Year Olds | 67 (100.0%) | 0 (0.0%) |
| 15 to 17 Year Olds | 55 (64.7%) | 30 (35.3%) |
| 18 to 19 Year Olds | 30 (100.0%) | 0 (0.0%) |
| 20 to 24 Year Olds | 65 (100.0%) | 0 (0.0%) |
| 25 to 34 Year Olds | 33 (100.0%) | 0 (0.0%) |
| 35 Years and over | 0 (0.0%) | 41 (100.0%) |
| Total | 614 (89.6%) | 71 (10.4%) |
Educational Attainment by Field of Study in Barnegat
Science & technology (186 | 17.3%), business (157 | 14.6%), education (139 | 13.0%), engineering (90 | 8.4%), and psychology (87 | 8.1%) are the most common fields of study among 1,073 individuals in Barnegat who have obtained a bachelor's degree or higher.
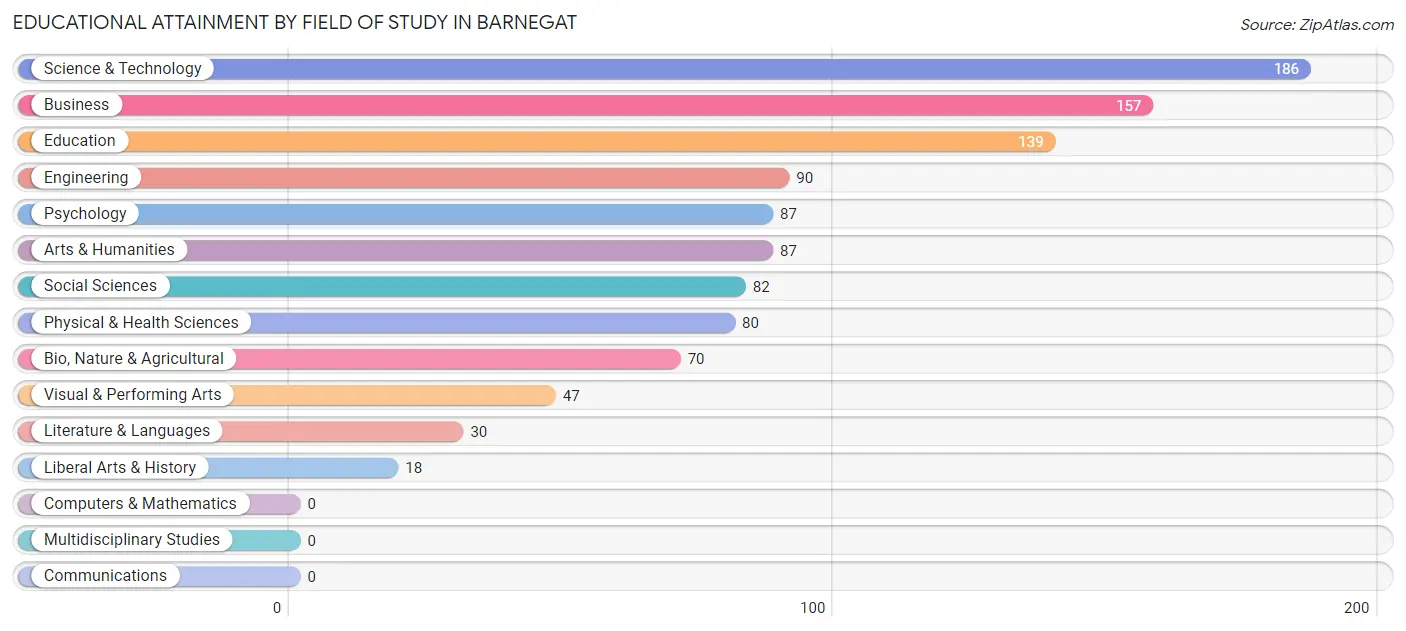
| Field of Study | # Graduates | % Graduates |
| Computers & Mathematics | 0 | 0.0% |
| Bio, Nature & Agricultural | 70 | 6.5% |
| Physical & Health Sciences | 80 | 7.5% |
| Psychology | 87 | 8.1% |
| Social Sciences | 82 | 7.6% |
| Engineering | 90 | 8.4% |
| Multidisciplinary Studies | 0 | 0.0% |
| Science & Technology | 186 | 17.3% |
| Business | 157 | 14.6% |
| Education | 139 | 13.0% |
| Literature & Languages | 30 | 2.8% |
| Liberal Arts & History | 18 | 1.7% |
| Visual & Performing Arts | 47 | 4.4% |
| Communications | 0 | 0.0% |
| Arts & Humanities | 87 | 8.1% |
| Total | 1,073 | 100.0% |
Transportation & Commute in Barnegat
Vehicle Availability by Sex in Barnegat
The most prevalent vehicle ownership categories in Barnegat are males with 2 vehicles (401, accounting for 43.7%) and females with 2 vehicles (411, making up 53.5%).
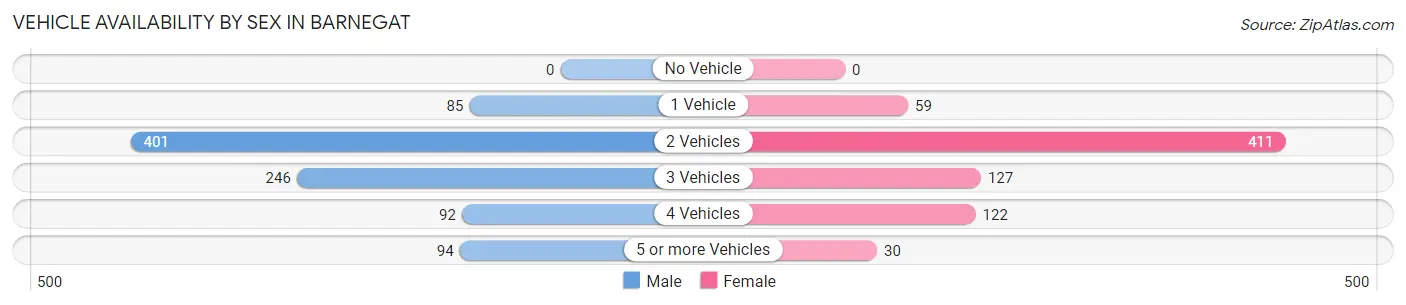
| Vehicles Available | Male | Female |
| No Vehicle | 0 (0.0%) | 0 (0.0%) |
| 1 Vehicle | 85 (9.3%) | 59 (7.9%) |
| 2 Vehicles | 401 (43.7%) | 411 (54.9%) |
| 3 Vehicles | 246 (26.8%) | 127 (17.0%) |
| 4 Vehicles | 92 (10.0%) | 122 (16.3%) |
| 5 or more Vehicles | 94 (10.2%) | 30 (4.0%) |
| Total | 918 (100.0%) | 749 (100.0%) |
Commute Time in Barnegat
The most frequently occuring commute durations in Barnegat are 5 to 9 minutes (289 commuters, 17.9%), 10 to 14 minutes (270 commuters, 16.7%), and 30 to 34 minutes (236 commuters, 14.6%).
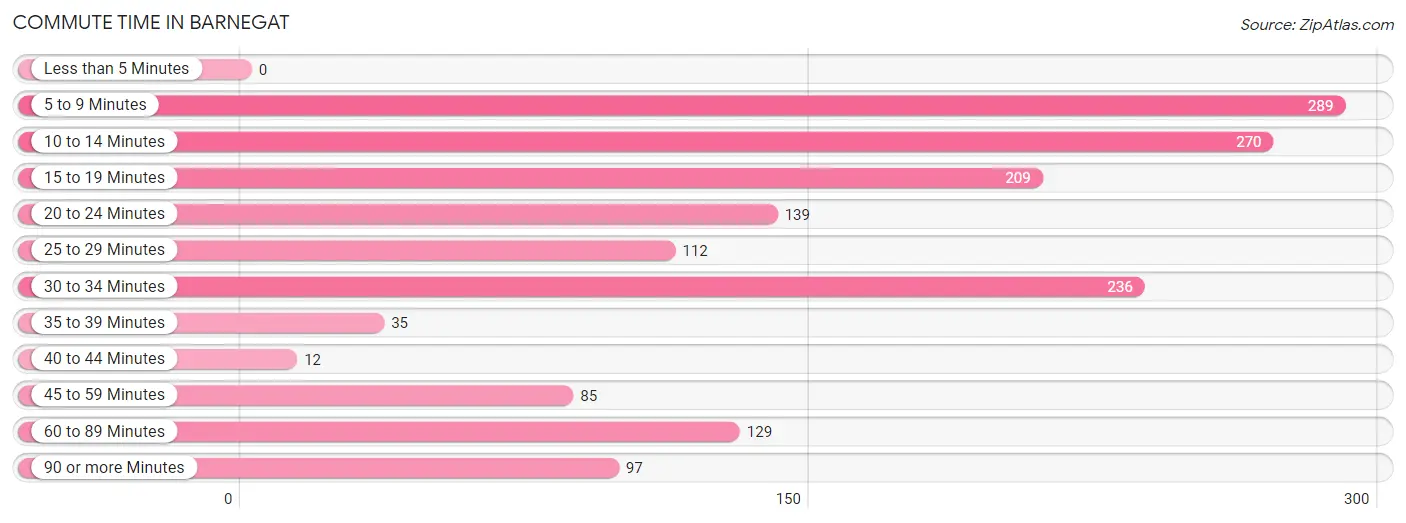
| Commute Time | # Commuters | % Commuters |
| Less than 5 Minutes | 0 | 0.0% |
| 5 to 9 Minutes | 289 | 17.9% |
| 10 to 14 Minutes | 270 | 16.7% |
| 15 to 19 Minutes | 209 | 13.0% |
| 20 to 24 Minutes | 139 | 8.6% |
| 25 to 29 Minutes | 112 | 6.9% |
| 30 to 34 Minutes | 236 | 14.6% |
| 35 to 39 Minutes | 35 | 2.2% |
| 40 to 44 Minutes | 12 | 0.7% |
| 45 to 59 Minutes | 85 | 5.3% |
| 60 to 89 Minutes | 129 | 8.0% |
| 90 or more Minutes | 97 | 6.0% |
Commute Time by Sex in Barnegat
The most common commute times in Barnegat are 5 to 9 minutes (163 commuters, 18.1%) for males and 10 to 14 minutes (170 commuters, 23.8%) for females.
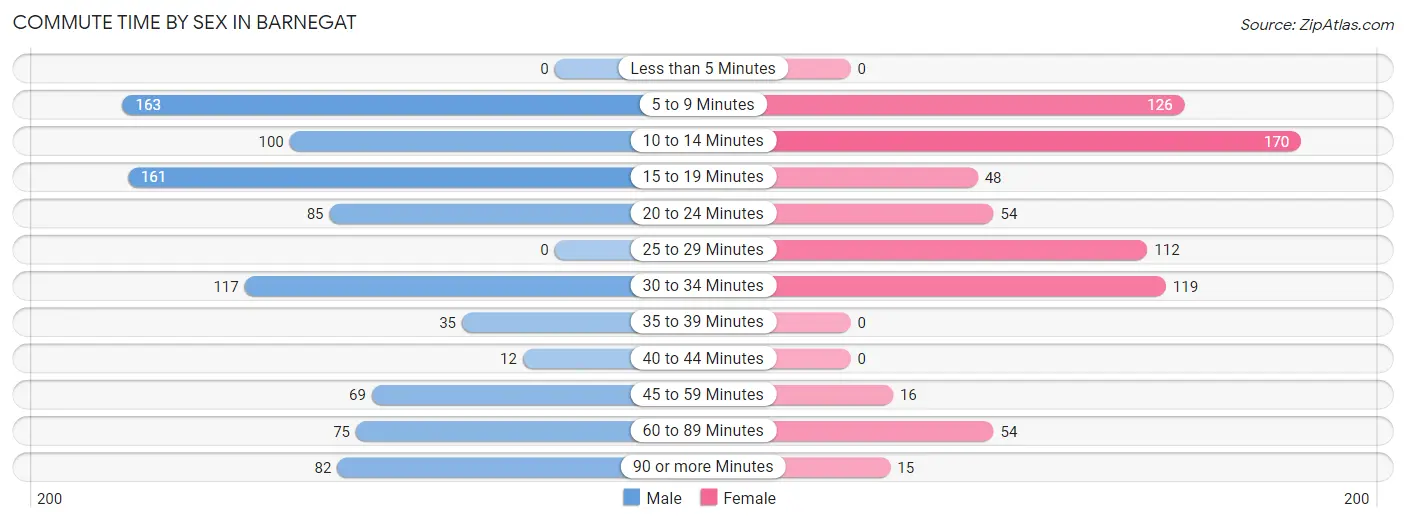
| Commute Time | Male | Female |
| Less than 5 Minutes | 0 (0.0%) | 0 (0.0%) |
| 5 to 9 Minutes | 163 (18.1%) | 126 (17.6%) |
| 10 to 14 Minutes | 100 (11.1%) | 170 (23.8%) |
| 15 to 19 Minutes | 161 (17.9%) | 48 (6.7%) |
| 20 to 24 Minutes | 85 (9.5%) | 54 (7.6%) |
| 25 to 29 Minutes | 0 (0.0%) | 112 (15.7%) |
| 30 to 34 Minutes | 117 (13.0%) | 119 (16.7%) |
| 35 to 39 Minutes | 35 (3.9%) | 0 (0.0%) |
| 40 to 44 Minutes | 12 (1.3%) | 0 (0.0%) |
| 45 to 59 Minutes | 69 (7.7%) | 16 (2.2%) |
| 60 to 89 Minutes | 75 (8.3%) | 54 (7.6%) |
| 90 or more Minutes | 82 (9.1%) | 15 (2.1%) |
Time of Departure to Work by Sex in Barnegat
The most frequent times of departure to work in Barnegat are 6:30 AM to 6:59 AM (158, 17.6%) for males and 7:30 AM to 7:59 AM (192, 26.9%) for females.
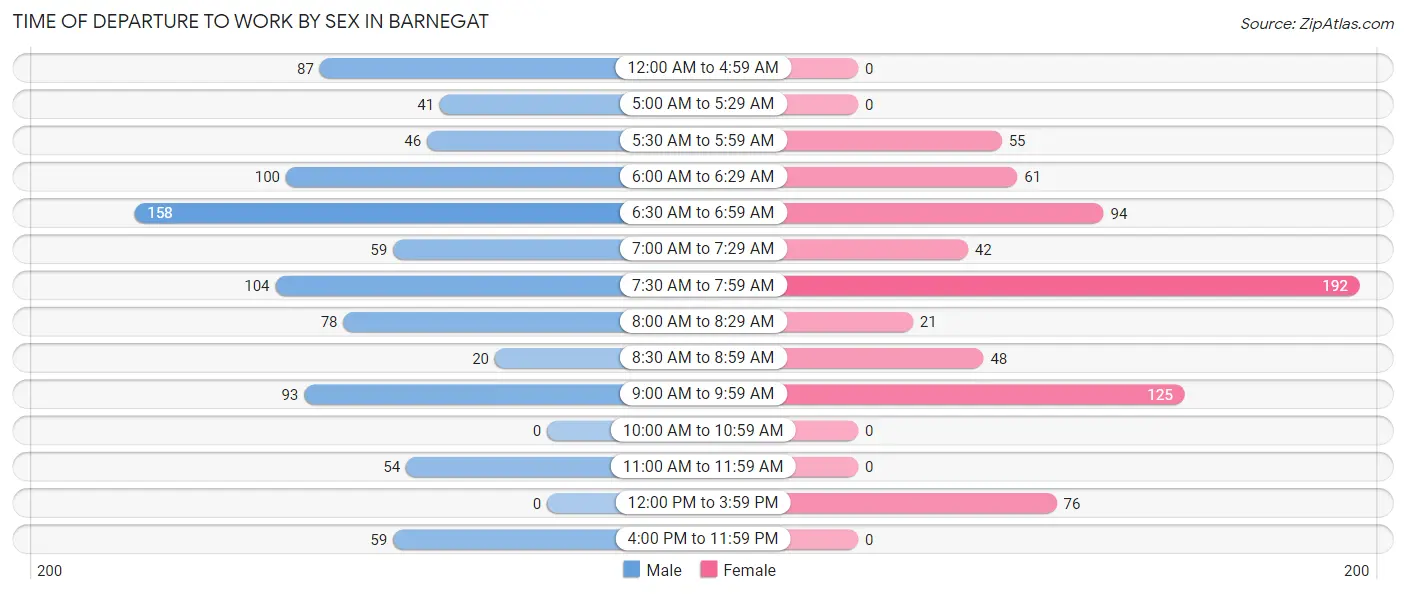
| Time of Departure | Male | Female |
| 12:00 AM to 4:59 AM | 87 (9.7%) | 0 (0.0%) |
| 5:00 AM to 5:29 AM | 41 (4.6%) | 0 (0.0%) |
| 5:30 AM to 5:59 AM | 46 (5.1%) | 55 (7.7%) |
| 6:00 AM to 6:29 AM | 100 (11.1%) | 61 (8.5%) |
| 6:30 AM to 6:59 AM | 158 (17.6%) | 94 (13.2%) |
| 7:00 AM to 7:29 AM | 59 (6.6%) | 42 (5.9%) |
| 7:30 AM to 7:59 AM | 104 (11.6%) | 192 (26.9%) |
| 8:00 AM to 8:29 AM | 78 (8.7%) | 21 (2.9%) |
| 8:30 AM to 8:59 AM | 20 (2.2%) | 48 (6.7%) |
| 9:00 AM to 9:59 AM | 93 (10.3%) | 125 (17.5%) |
| 10:00 AM to 10:59 AM | 0 (0.0%) | 0 (0.0%) |
| 11:00 AM to 11:59 AM | 54 (6.0%) | 0 (0.0%) |
| 12:00 PM to 3:59 PM | 0 (0.0%) | 76 (10.6%) |
| 4:00 PM to 11:59 PM | 59 (6.6%) | 0 (0.0%) |
| Total | 899 (100.0%) | 714 (100.0%) |
Housing Occupancy in Barnegat
Occupancy by Ownership in Barnegat
Of the total 1,204 dwellings in Barnegat, owner-occupied units account for 1,023 (85.0%), while renter-occupied units make up 181 (15.0%).
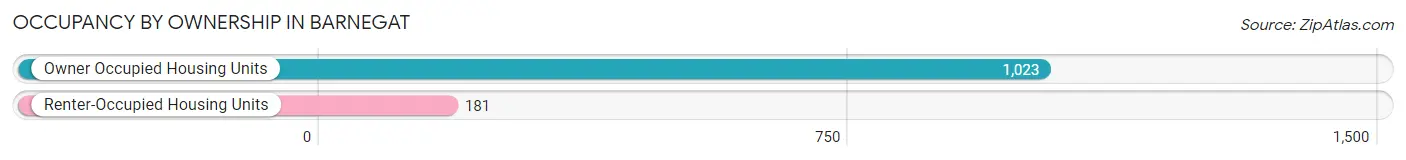
| Occupancy | # Housing Units | % Housing Units |
| Owner Occupied Housing Units | 1,023 | 85.0% |
| Renter-Occupied Housing Units | 181 | 15.0% |
| Total Occupied Housing Units | 1,204 | 100.0% |
Occupancy by Household Size in Barnegat
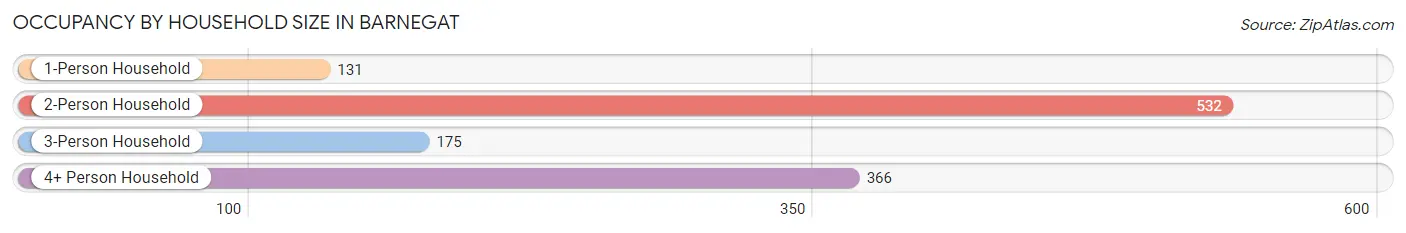
| Household Size | # Housing Units | % Housing Units |
| 1-Person Household | 131 | 10.9% |
| 2-Person Household | 532 | 44.2% |
| 3-Person Household | 175 | 14.5% |
| 4+ Person Household | 366 | 30.4% |
| Total Housing Units | 1,204 | 100.0% |
Occupancy by Ownership by Household Size in Barnegat
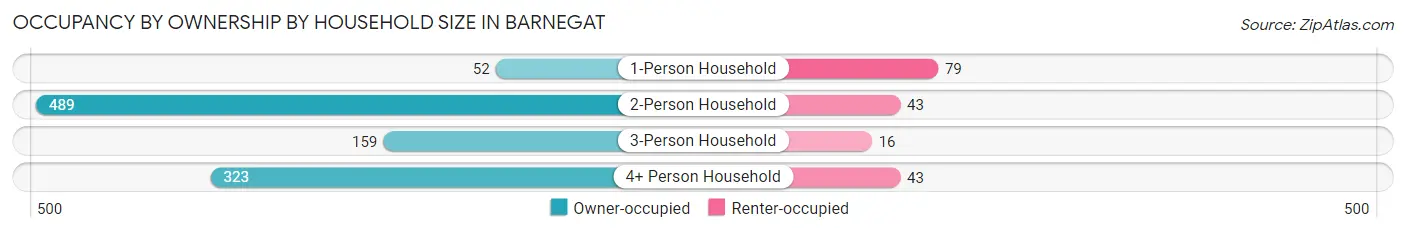
| Household Size | Owner-occupied | Renter-occupied |
| 1-Person Household | 52 (39.7%) | 79 (60.3%) |
| 2-Person Household | 489 (91.9%) | 43 (8.1%) |
| 3-Person Household | 159 (90.9%) | 16 (9.1%) |
| 4+ Person Household | 323 (88.2%) | 43 (11.7%) |
| Total Housing Units | 1,023 (85.0%) | 181 (15.0%) |
Occupancy by Educational Attainment in Barnegat
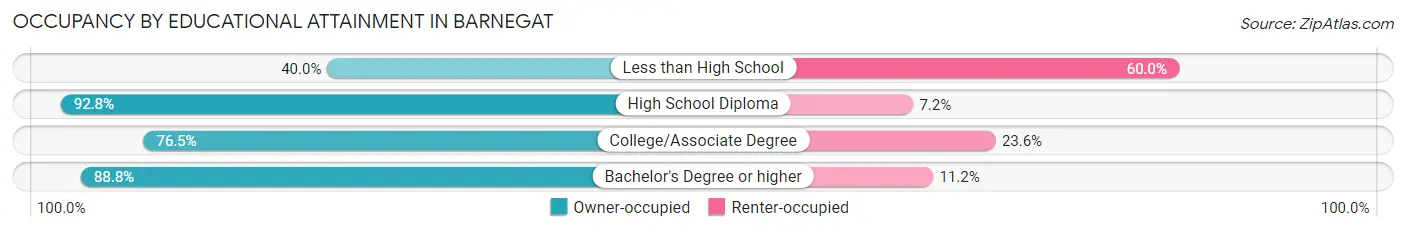
| Household Size | Owner-occupied | Renter-occupied |
| Less than High School | 24 (40.0%) | 36 (60.0%) |
| High School Diploma | 297 (92.8%) | 23 (7.2%) |
| College/Associate Degree | 185 (76.4%) | 57 (23.5%) |
| Bachelor's Degree or higher | 517 (88.8%) | 65 (11.2%) |
Occupancy by Age of Householder in Barnegat
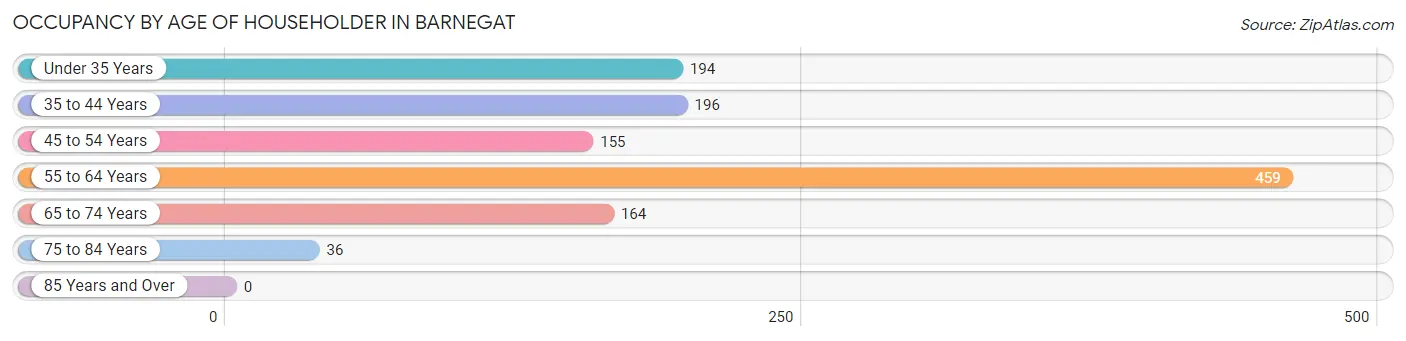
| Age Bracket | # Households | % Households |
| Under 35 Years | 194 | 16.1% |
| 35 to 44 Years | 196 | 16.3% |
| 45 to 54 Years | 155 | 12.9% |
| 55 to 64 Years | 459 | 38.1% |
| 65 to 74 Years | 164 | 13.6% |
| 75 to 84 Years | 36 | 3.0% |
| 85 Years and Over | 0 | 0.0% |
| Total | 1,204 | 100.0% |
Housing Finances in Barnegat
Median Income by Occupancy in Barnegat
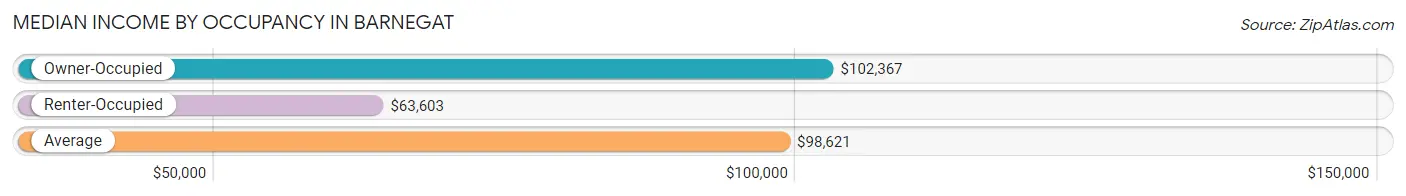
| Occupancy Type | # Households | Median Income |
| Owner-Occupied | 1,023 (85.0%) | $102,367 |
| Renter-Occupied | 181 (15.0%) | $63,603 |
| Average | 1,204 (100.0%) | $98,621 |
Occupancy by Householder Income Bracket in Barnegat
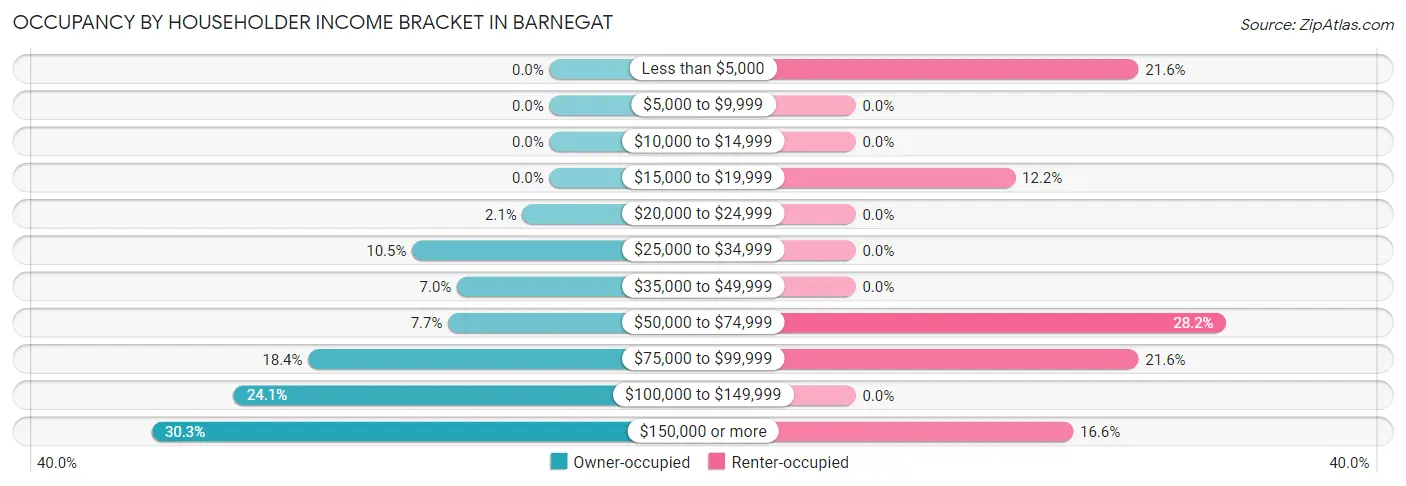
| Income Bracket | Owner-occupied | Renter-occupied |
| Less than $5,000 | 0 (0.0%) | 39 (21.5%) |
| $5,000 to $9,999 | 0 (0.0%) | 0 (0.0%) |
| $10,000 to $14,999 | 0 (0.0%) | 0 (0.0%) |
| $15,000 to $19,999 | 0 (0.0%) | 22 (12.1%) |
| $20,000 to $24,999 | 21 (2.1%) | 0 (0.0%) |
| $25,000 to $34,999 | 107 (10.5%) | 0 (0.0%) |
| $35,000 to $49,999 | 72 (7.0%) | 0 (0.0%) |
| $50,000 to $74,999 | 79 (7.7%) | 51 (28.2%) |
| $75,000 to $99,999 | 188 (18.4%) | 39 (21.5%) |
| $100,000 to $149,999 | 246 (24.0%) | 0 (0.0%) |
| $150,000 or more | 310 (30.3%) | 30 (16.6%) |
| Total | 1,023 (100.0%) | 181 (100.0%) |
Monthly Housing Cost Tiers in Barnegat
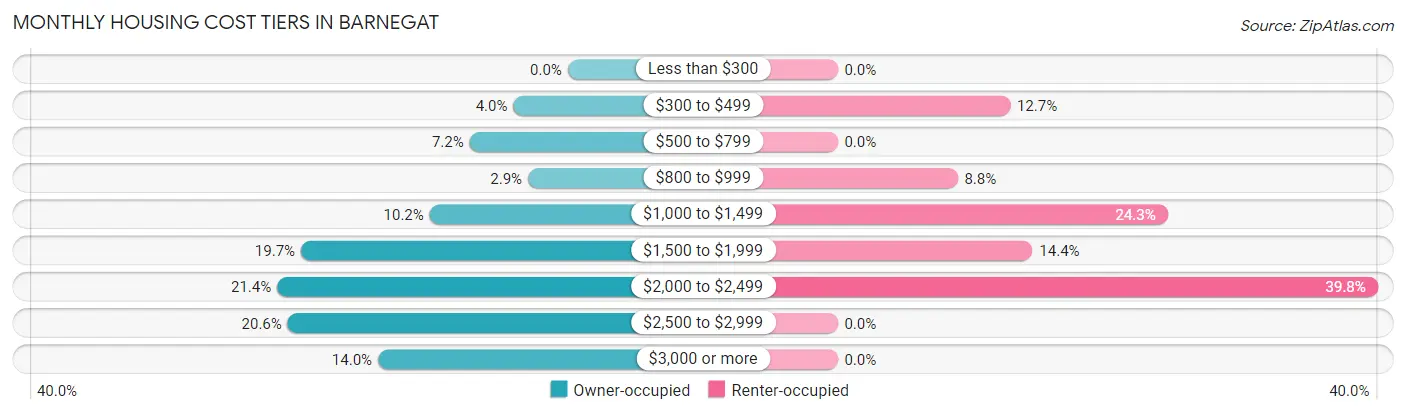
| Monthly Cost | Owner-occupied | Renter-occupied |
| Less than $300 | 0 (0.0%) | 0 (0.0%) |
| $300 to $499 | 41 (4.0%) | 23 (12.7%) |
| $500 to $799 | 74 (7.2%) | 0 (0.0%) |
| $800 to $999 | 30 (2.9%) | 16 (8.8%) |
| $1,000 to $1,499 | 104 (10.2%) | 44 (24.3%) |
| $1,500 to $1,999 | 201 (19.7%) | 26 (14.4%) |
| $2,000 to $2,499 | 219 (21.4%) | 72 (39.8%) |
| $2,500 to $2,999 | 211 (20.6%) | 0 (0.0%) |
| $3,000 or more | 143 (14.0%) | 0 (0.0%) |
| Total | 1,023 (100.0%) | 181 (100.0%) |
Physical Housing Characteristics in Barnegat
Housing Structures in Barnegat
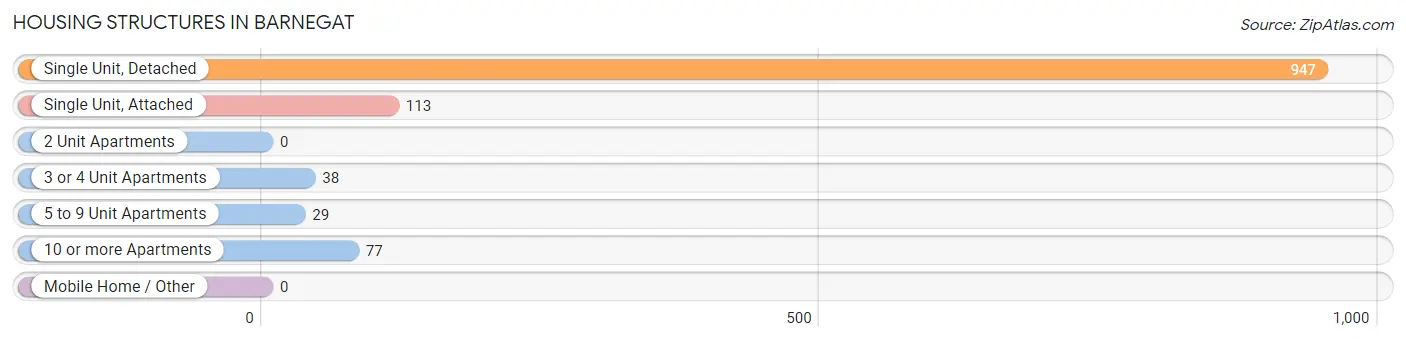
| Structure Type | # Housing Units | % Housing Units |
| Single Unit, Detached | 947 | 78.6% |
| Single Unit, Attached | 113 | 9.4% |
| 2 Unit Apartments | 0 | 0.0% |
| 3 or 4 Unit Apartments | 38 | 3.2% |
| 5 to 9 Unit Apartments | 29 | 2.4% |
| 10 or more Apartments | 77 | 6.4% |
| Mobile Home / Other | 0 | 0.0% |
| Total | 1,204 | 100.0% |
Housing Structures by Occupancy in Barnegat
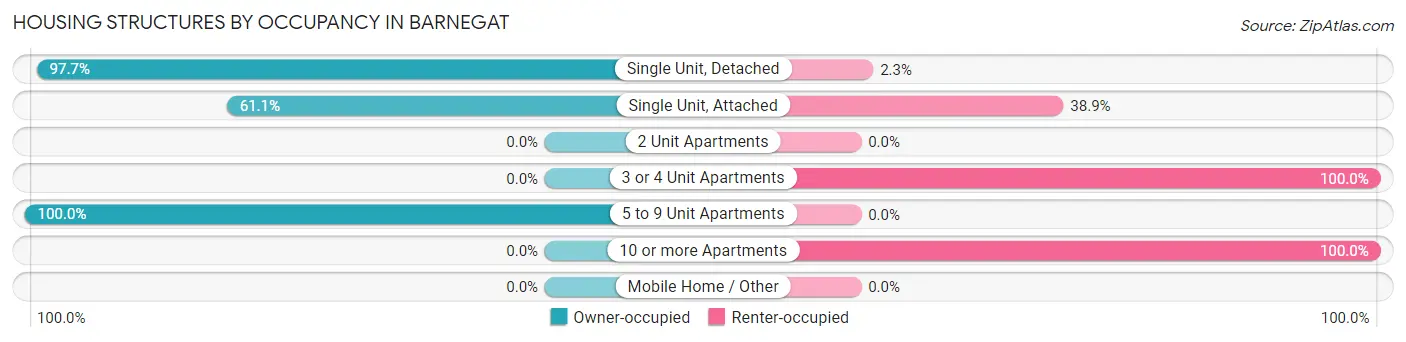
| Structure Type | Owner-occupied | Renter-occupied |
| Single Unit, Detached | 925 (97.7%) | 22 (2.3%) |
| Single Unit, Attached | 69 (61.1%) | 44 (38.9%) |
| 2 Unit Apartments | 0 (0.0%) | 0 (0.0%) |
| 3 or 4 Unit Apartments | 0 (0.0%) | 38 (100.0%) |
| 5 to 9 Unit Apartments | 29 (100.0%) | 0 (0.0%) |
| 10 or more Apartments | 0 (0.0%) | 77 (100.0%) |
| Mobile Home / Other | 0 (0.0%) | 0 (0.0%) |
| Total | 1,023 (85.0%) | 181 (15.0%) |
Housing Structures by Number of Rooms in Barnegat
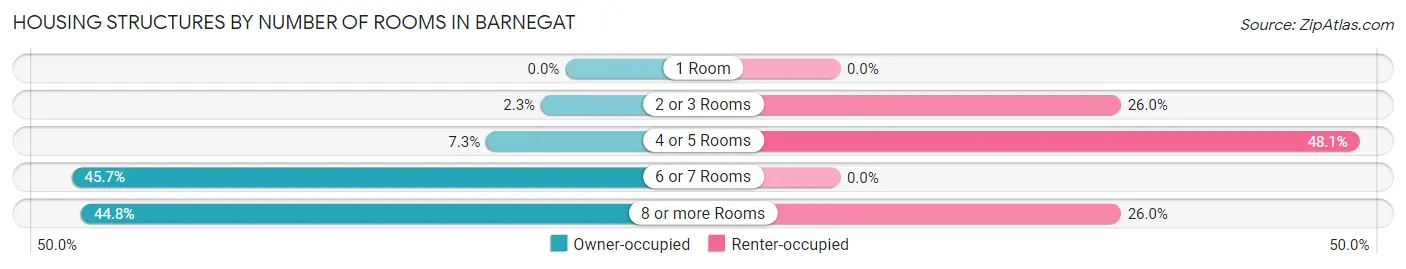
| Number of Rooms | Owner-occupied | Renter-occupied |
| 1 Room | 0 (0.0%) | 0 (0.0%) |
| 2 or 3 Rooms | 23 (2.2%) | 47 (26.0%) |
| 4 or 5 Rooms | 75 (7.3%) | 87 (48.1%) |
| 6 or 7 Rooms | 467 (45.7%) | 0 (0.0%) |
| 8 or more Rooms | 458 (44.8%) | 47 (26.0%) |
| Total | 1,023 (100.0%) | 181 (100.0%) |
Housing Structure by Heating Type in Barnegat
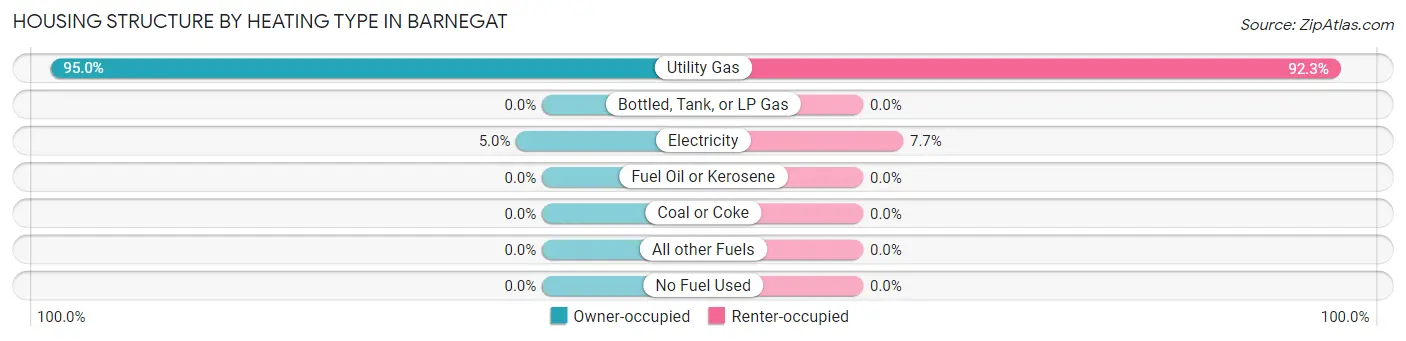
| Heating Type | Owner-occupied | Renter-occupied |
| Utility Gas | 972 (95.0%) | 167 (92.3%) |
| Bottled, Tank, or LP Gas | 0 (0.0%) | 0 (0.0%) |
| Electricity | 51 (5.0%) | 14 (7.7%) |
| Fuel Oil or Kerosene | 0 (0.0%) | 0 (0.0%) |
| Coal or Coke | 0 (0.0%) | 0 (0.0%) |
| All other Fuels | 0 (0.0%) | 0 (0.0%) |
| No Fuel Used | 0 (0.0%) | 0 (0.0%) |
| Total | 1,023 (100.0%) | 181 (100.0%) |
Household Vehicle Usage in Barnegat
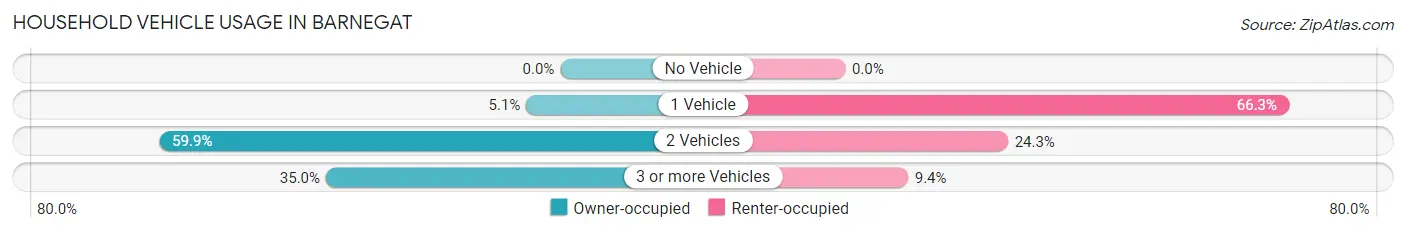
| Vehicles per Household | Owner-occupied | Renter-occupied |
| No Vehicle | 0 (0.0%) | 0 (0.0%) |
| 1 Vehicle | 52 (5.1%) | 120 (66.3%) |
| 2 Vehicles | 613 (59.9%) | 44 (24.3%) |
| 3 or more Vehicles | 358 (35.0%) | 17 (9.4%) |
| Total | 1,023 (100.0%) | 181 (100.0%) |
Real Estate & Mortgages in Barnegat
Real Estate and Mortgage Overview in Barnegat
| Characteristic | Without Mortgage | With Mortgage |
| Housing Units | 169 | 854 |
| Median Property Value | $284,100 | $353,000 |
| Median Household Income | $89,867 | $291 |
| Monthly Housing Costs | $783 | $143 |
| Real Estate Taxes | $6,157 | $0 |
Property Value by Mortgage Status in Barnegat
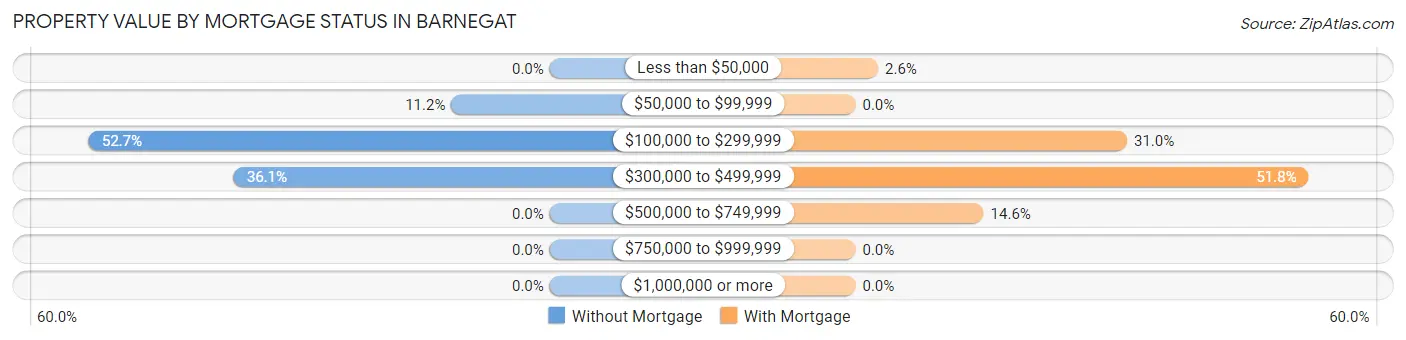
| Property Value | Without Mortgage | With Mortgage |
| Less than $50,000 | 0 (0.0%) | 22 (2.6%) |
| $50,000 to $99,999 | 19 (11.2%) | 0 (0.0%) |
| $100,000 to $299,999 | 89 (52.7%) | 265 (31.0%) |
| $300,000 to $499,999 | 61 (36.1%) | 442 (51.8%) |
| $500,000 to $749,999 | 0 (0.0%) | 125 (14.6%) |
| $750,000 to $999,999 | 0 (0.0%) | 0 (0.0%) |
| $1,000,000 or more | 0 (0.0%) | 0 (0.0%) |
| Total | 169 (100.0%) | 854 (100.0%) |
Household Income by Mortgage Status in Barnegat
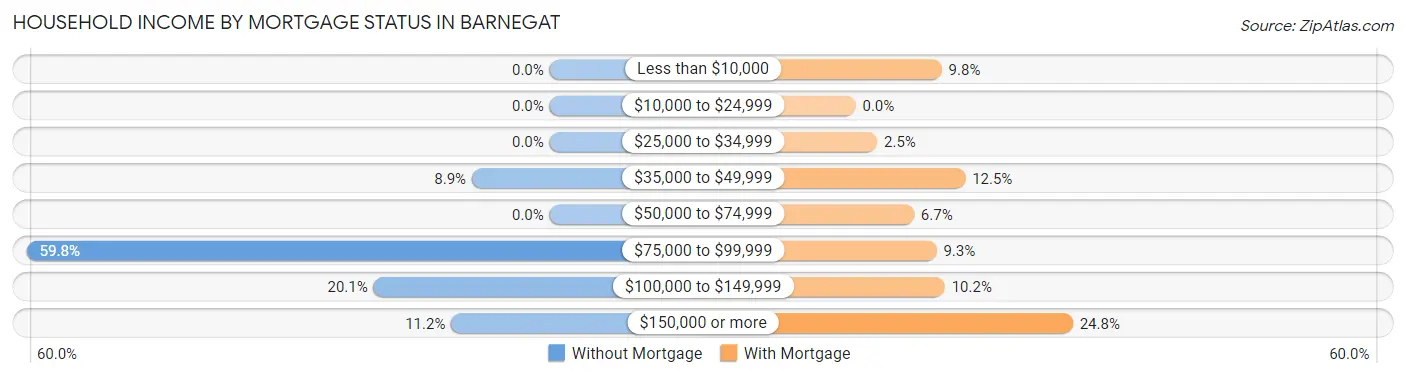
| Household Income | Without Mortgage | With Mortgage |
| Less than $10,000 | 0 (0.0%) | 84 (9.8%) |
| $10,000 to $24,999 | 0 (0.0%) | 0 (0.0%) |
| $25,000 to $34,999 | 0 (0.0%) | 21 (2.5%) |
| $35,000 to $49,999 | 15 (8.9%) | 107 (12.5%) |
| $50,000 to $74,999 | 0 (0.0%) | 57 (6.7%) |
| $75,000 to $99,999 | 101 (59.8%) | 79 (9.2%) |
| $100,000 to $149,999 | 34 (20.1%) | 87 (10.2%) |
| $150,000 or more | 19 (11.2%) | 212 (24.8%) |
| Total | 169 (100.0%) | 854 (100.0%) |
Property Value to Household Income Ratio in Barnegat
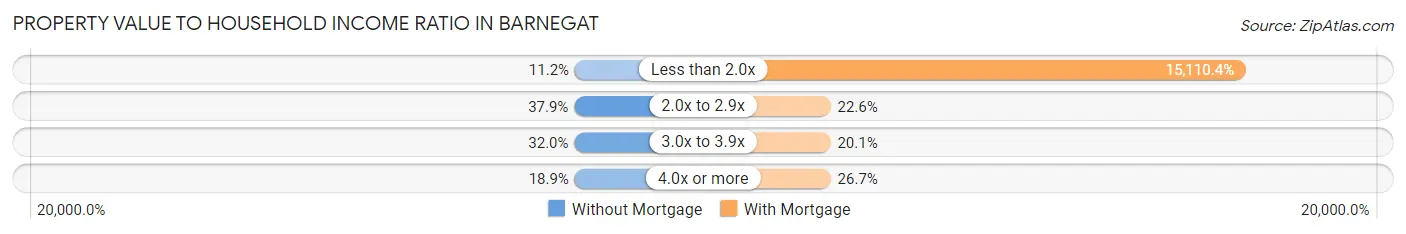
| Value-to-Income Ratio | Without Mortgage | With Mortgage |
| Less than 2.0x | 19 (11.2%) | 129,043 (15,110.4%) |
| 2.0x to 2.9x | 64 (37.9%) | 193 (22.6%) |
| 3.0x to 3.9x | 54 (32.0%) | 172 (20.1%) |
| 4.0x or more | 32 (18.9%) | 228 (26.7%) |
| Total | 169 (100.0%) | 854 (100.0%) |
Real Estate Taxes by Mortgage Status in Barnegat
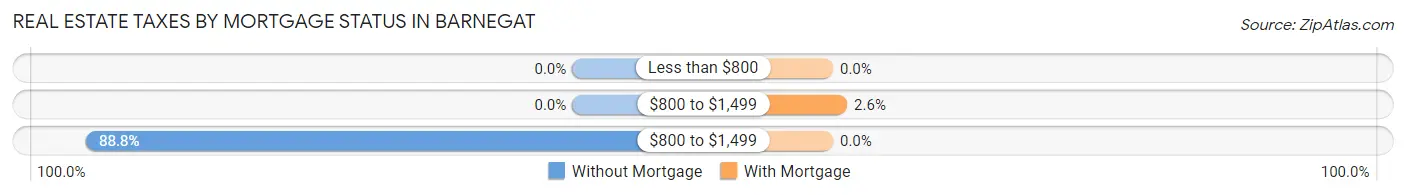
| Property Taxes | Without Mortgage | With Mortgage |
| Less than $800 | 0 (0.0%) | 0 (0.0%) |
| $800 to $1,499 | 0 (0.0%) | 22 (2.6%) |
| $800 to $1,499 | 150 (88.8%) | 0 (0.0%) |
| Total | 169 (100.0%) | 854 (100.0%) |
Health & Disability in Barnegat
Health Insurance Coverage by Age in Barnegat
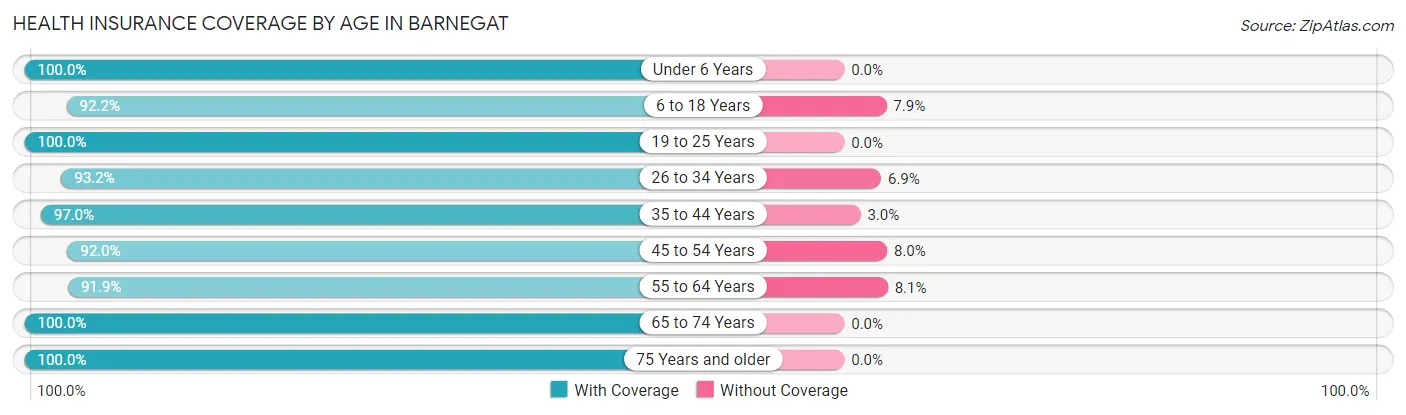
| Age Bracket | With Coverage | Without Coverage |
| Under 6 Years | 352 (100.0%) | 0 (0.0%) |
| 6 to 18 Years | 399 (92.1%) | 34 (7.9%) |
| 19 to 25 Years | 178 (100.0%) | 0 (0.0%) |
| 26 to 34 Years | 340 (93.1%) | 25 (6.9%) |
| 35 to 44 Years | 416 (97.0%) | 13 (3.0%) |
| 45 to 54 Years | 358 (92.0%) | 31 (8.0%) |
| 55 to 64 Years | 647 (91.9%) | 57 (8.1%) |
| 65 to 74 Years | 322 (100.0%) | 0 (0.0%) |
| 75 Years and older | 112 (100.0%) | 0 (0.0%) |
| Total | 3,124 (95.1%) | 160 (4.9%) |
Health Insurance Coverage by Citizenship Status in Barnegat
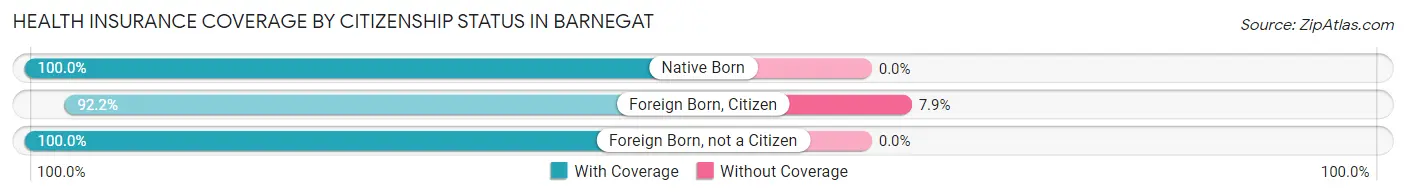
| Citizenship Status | With Coverage | Without Coverage |
| Native Born | 352 (100.0%) | 0 (0.0%) |
| Foreign Born, Citizen | 399 (92.1%) | 34 (7.9%) |
| Foreign Born, not a Citizen | 178 (100.0%) | 0 (0.0%) |
Health Insurance Coverage by Household Income in Barnegat
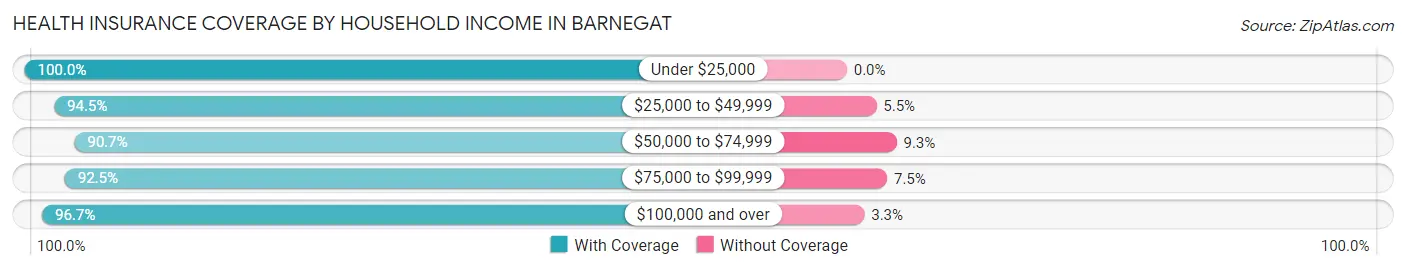
| Household Income | With Coverage | Without Coverage |
| Under $25,000 | 131 (100.0%) | 0 (0.0%) |
| $25,000 to $49,999 | 478 (94.5%) | 28 (5.5%) |
| $50,000 to $74,999 | 331 (90.7%) | 34 (9.3%) |
| $75,000 to $99,999 | 503 (92.5%) | 41 (7.5%) |
| $100,000 and over | 1,681 (96.7%) | 57 (3.3%) |
Public vs Private Health Insurance Coverage by Age in Barnegat
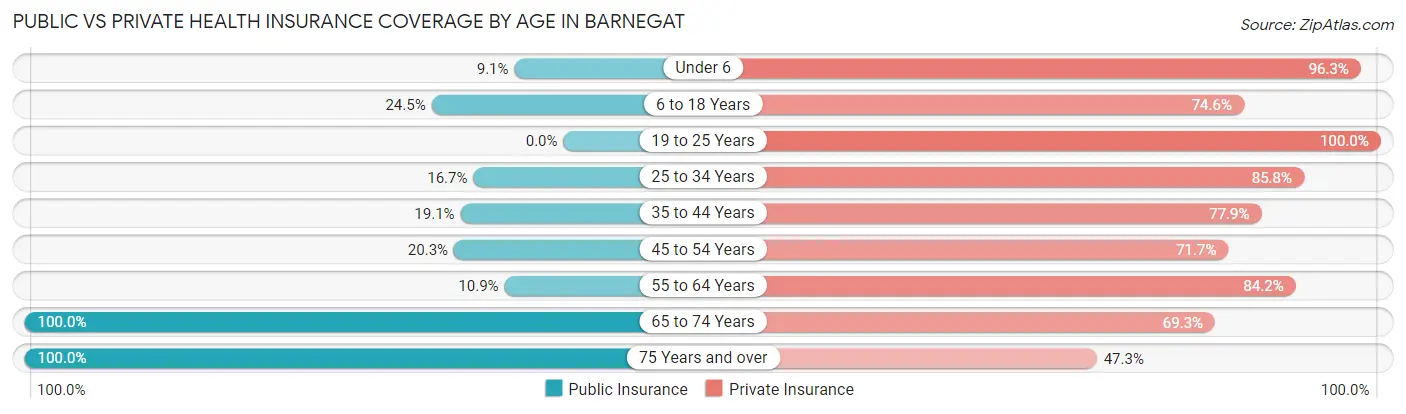
| Age Bracket | Public Insurance | Private Insurance |
| Under 6 | 32 (9.1%) | 339 (96.3%) |
| 6 to 18 Years | 106 (24.5%) | 323 (74.6%) |
| 19 to 25 Years | 0 (0.0%) | 178 (100.0%) |
| 25 to 34 Years | 61 (16.7%) | 313 (85.8%) |
| 35 to 44 Years | 82 (19.1%) | 334 (77.9%) |
| 45 to 54 Years | 79 (20.3%) | 279 (71.7%) |
| 55 to 64 Years | 77 (10.9%) | 593 (84.2%) |
| 65 to 74 Years | 322 (100.0%) | 223 (69.3%) |
| 75 Years and over | 112 (100.0%) | 53 (47.3%) |
| Total | 871 (26.5%) | 2,635 (80.2%) |
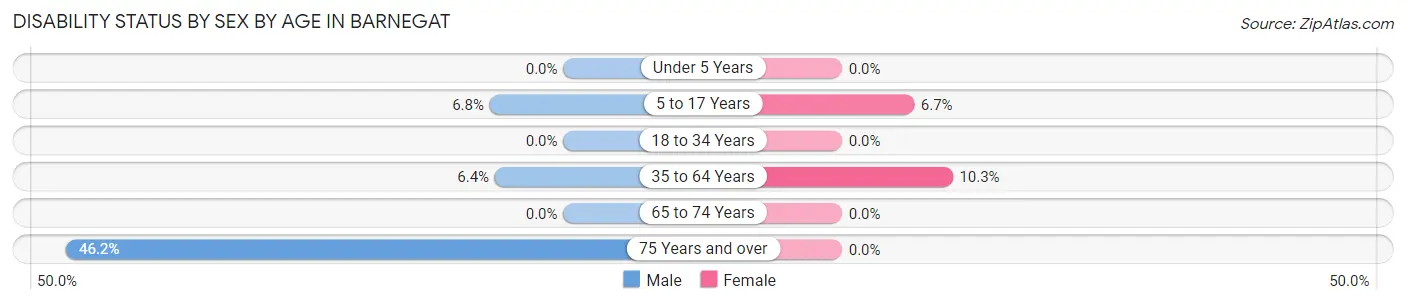
Disability Status by Sex by Age in Barnegat
| Age Bracket | Male | Female |
| Under 5 Years | 0 (0.0%) | 0 (0.0%) |
| 5 to 17 Years | 14 (6.8%) | 16 (6.7%) |
| 18 to 34 Years | 0 (0.0%) | 0 (0.0%) |
| 35 to 64 Years | 41 (6.4%) | 90 (10.3%) |
| 65 to 74 Years | 0 (0.0%) | 0 (0.0%) |
| 75 Years and over | 42 (46.2%) | 0 (0.0%) |
Disability Class by Sex by Age in Barnegat
Disability Class: Hearing Difficulty
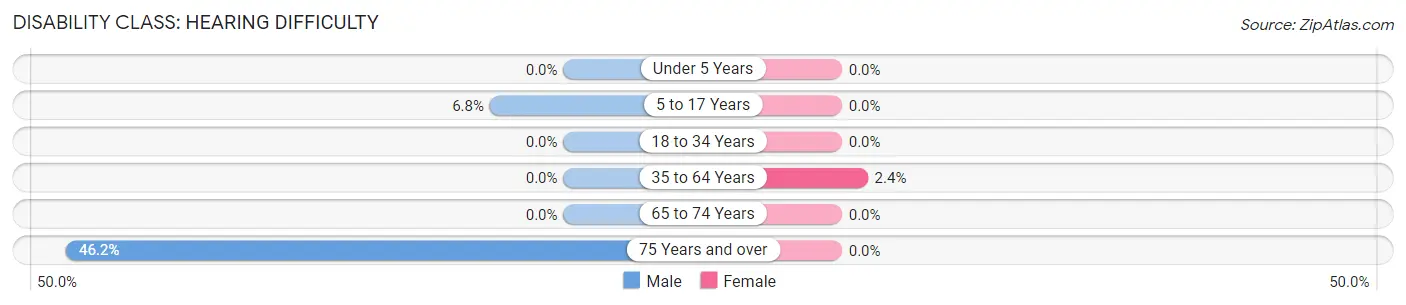
| Age Bracket | Male | Female |
| Under 5 Years | 0 (0.0%) | 0 (0.0%) |
| 5 to 17 Years | 14 (6.8%) | 0 (0.0%) |
| 18 to 34 Years | 0 (0.0%) | 0 (0.0%) |
| 35 to 64 Years | 0 (0.0%) | 21 (2.4%) |
| 65 to 74 Years | 0 (0.0%) | 0 (0.0%) |
| 75 Years and over | 42 (46.2%) | 0 (0.0%) |
Disability Class: Vision Difficulty
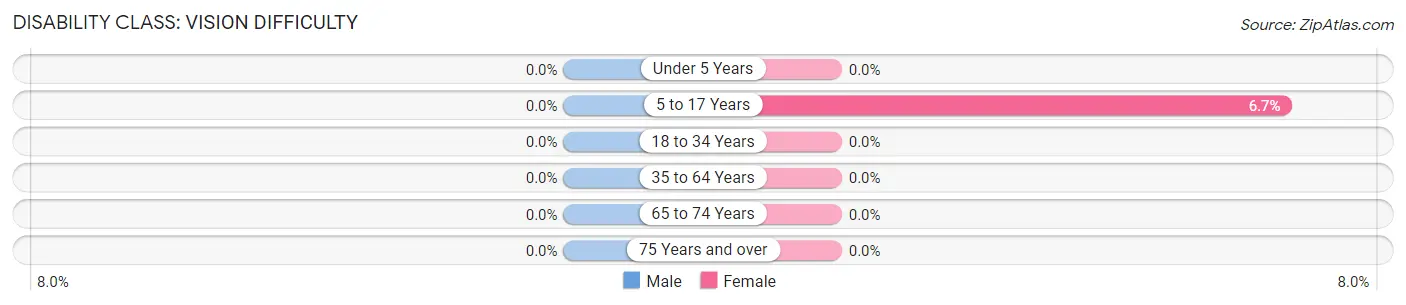
| Age Bracket | Male | Female |
| Under 5 Years | 0 (0.0%) | 0 (0.0%) |
| 5 to 17 Years | 0 (0.0%) | 16 (6.7%) |
| 18 to 34 Years | 0 (0.0%) | 0 (0.0%) |
| 35 to 64 Years | 0 (0.0%) | 0 (0.0%) |
| 65 to 74 Years | 0 (0.0%) | 0 (0.0%) |
| 75 Years and over | 0 (0.0%) | 0 (0.0%) |
Disability Class: Cognitive Difficulty
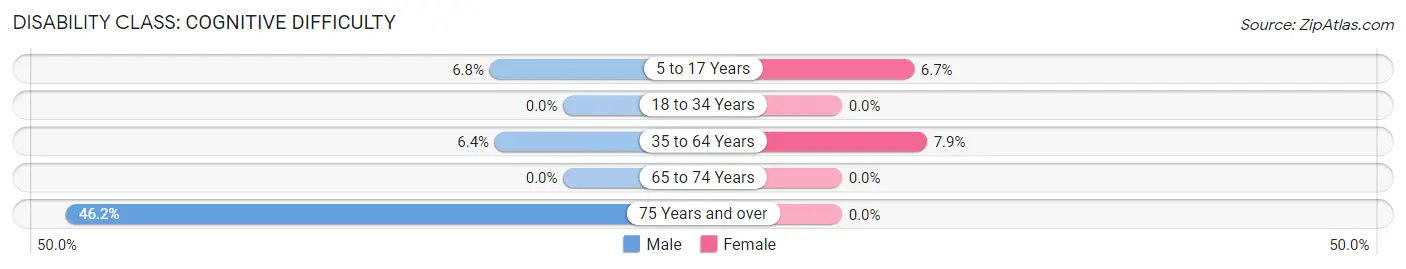
| Age Bracket | Male | Female |
| 5 to 17 Years | 14 (6.8%) | 16 (6.7%) |
| 18 to 34 Years | 0 (0.0%) | 0 (0.0%) |
| 35 to 64 Years | 41 (6.4%) | 69 (7.9%) |
| 65 to 74 Years | 0 (0.0%) | 0 (0.0%) |
| 75 Years and over | 42 (46.2%) | 0 (0.0%) |
Disability Class: Ambulatory Difficulty
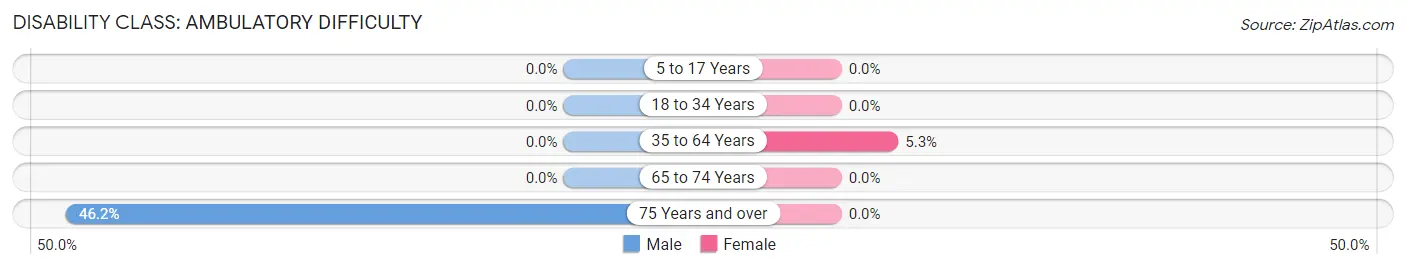
| Age Bracket | Male | Female |
| 5 to 17 Years | 0 (0.0%) | 0 (0.0%) |
| 18 to 34 Years | 0 (0.0%) | 0 (0.0%) |
| 35 to 64 Years | 0 (0.0%) | 46 (5.2%) |
| 65 to 74 Years | 0 (0.0%) | 0 (0.0%) |
| 75 Years and over | 42 (46.2%) | 0 (0.0%) |
Disability Class: Self-Care Difficulty
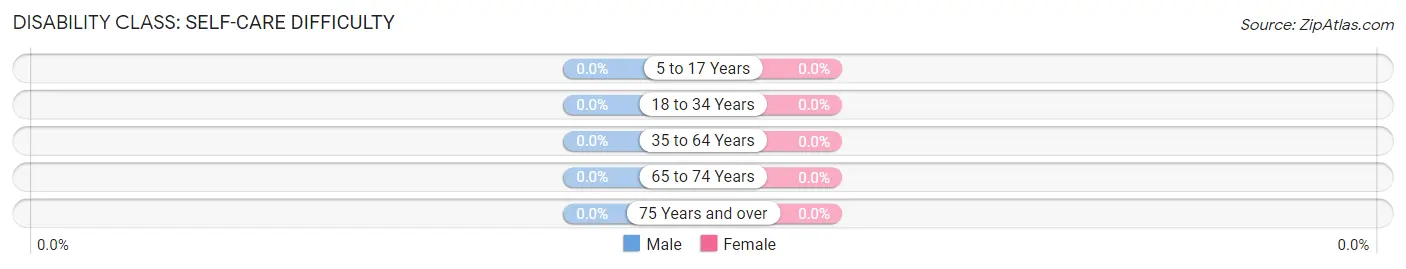
| Age Bracket | Male | Female |
| 5 to 17 Years | 0 (0.0%) | 0 (0.0%) |
| 18 to 34 Years | 0 (0.0%) | 0 (0.0%) |
| 35 to 64 Years | 0 (0.0%) | 0 (0.0%) |
| 65 to 74 Years | 0 (0.0%) | 0 (0.0%) |
| 75 Years and over | 0 (0.0%) | 0 (0.0%) |
Technology Access in Barnegat
Computing Device Access in Barnegat
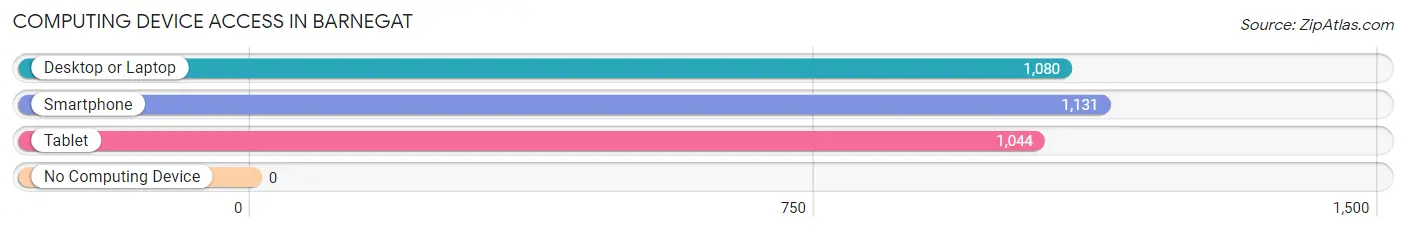
| Device Type | # Households | % Households |
| Desktop or Laptop | 1,080 | 89.7% |
| Smartphone | 1,131 | 93.9% |
| Tablet | 1,044 | 86.7% |
| No Computing Device | 0 | 0.0% |
| Total | 1,204 | 100.0% |
Internet Access in Barnegat
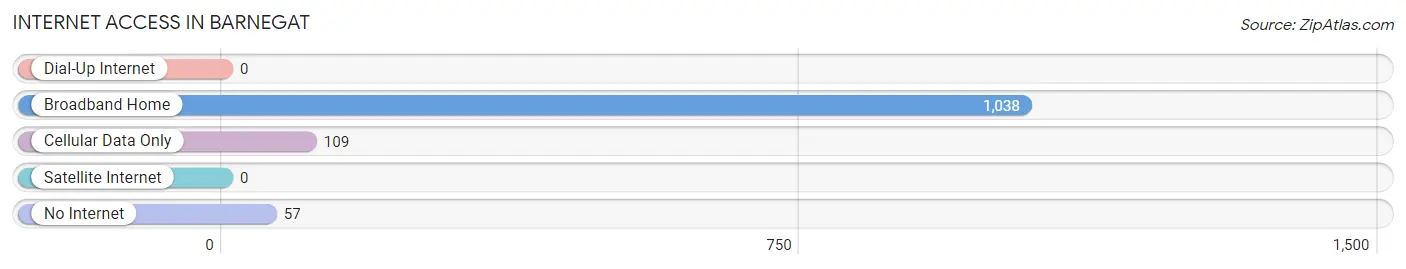
| Internet Type | # Households | % Households |
| Dial-Up Internet | 0 | 0.0% |
| Broadband Home | 1,038 | 86.2% |
| Cellular Data Only | 109 | 9.0% |
| Satellite Internet | 0 | 0.0% |
| No Internet | 57 | 4.7% |
| Total | 1,204 | 100.0% |
Barnegat Summary
Barnegat, NJ is a small town located in Ocean County, New Jersey. It is situated on the Barnegat Bay, which is part of the Atlantic Ocean. The town has a population of about 10,000 people and is a popular tourist destination due to its proximity to the Jersey Shore.
History
Barnegat was first settled in 1614 by Dutch settlers. The town was originally known as Barnegat Township and was part of Burlington County. In 1846, Barnegat Township was split into two townships, Barnegat and Ocean. In 1891, Barnegat was incorporated as a borough.
The town was named after the Barnegat Bay, which was named by Dutch explorer Cornelius Jacobsen Mey in 1614. The name is derived from the Dutch word “baren gat”, which means “bear hole”.
Geography
Barnegat is located in Ocean County, New Jersey. It is situated on the Barnegat Bay, which is part of the Atlantic Ocean. The town is bordered by the townships of Lacey, Stafford, and Ocean.
The town has a total area of 4.2 square miles, of which 3.9 square miles is land and 0.3 square miles is water. The town is located in the Pine Barrens, a large area of pine forests and wetlands.
Economy
Barnegat’s economy is largely based on tourism. The town is a popular destination for beachgoers, boaters, and fishermen. The town also has a number of restaurants, shops, and other businesses that cater to tourists.
The town is also home to a number of manufacturing and industrial businesses. These businesses include a plastics factory, a boat manufacturing plant, and a seafood processing plant.
Demographics
As of the 2010 census, Barnegat had a population of 10,347 people. The racial makeup of the town was 94.3% White, 2.2% African American, 0.7% Asian, 0.3% Native American, and 2.5% from other races.
The median household income in Barnegat was $60,945 in 2010. The median age of the town’s population was 44.7 years.
Barnegat is a small town with a rich history and a vibrant economy. The town is a popular tourist destination and is home to a number of businesses that cater to tourists and locals alike. The town has a diverse population and a median household income that is higher than the national average.
Common Questions
What is Per Capita Income in Barnegat?
Per Capita income in Barnegat is $43,222.
What is the Median Family Income in Barnegat?
Median Family Income in Barnegat is $101,144.
What is the Median Household income in Barnegat?
Median Household Income in Barnegat is $98,621.
What is Income or Wage Gap in Barnegat?
Income or Wage Gap in Barnegat is 11.0%.
Women in Barnegat earn 89.0 cents for every dollar earned by a man.
What is Inequality or Gini Index in Barnegat?
Inequality or Gini Index in Barnegat is 0.40.
What is the Total Population of Barnegat?
Total Population of Barnegat is 3,284.
What is the Total Male Population of Barnegat?
Total Male Population of Barnegat is 1,707.
What is the Total Female Population of Barnegat?
Total Female Population of Barnegat is 1,577.
What is the Ratio of Males per 100 Females in Barnegat?
There are 108.24 Males per 100 Females in Barnegat.
What is the Ratio of Females per 100 Males in Barnegat?
There are 92.38 Females per 100 Males in Barnegat.
What is the Median Population Age in Barnegat?
Median Population Age in Barnegat is 41.1 Years.
What is the Average Family Size in Barnegat
Average Family Size in Barnegat is 2.9 People.
What is the Average Household Size in Barnegat
Average Household Size in Barnegat is 2.7 People.
How Large is the Labor Force in Barnegat?
There are 1,792 People in the Labor Forcein in Barnegat.
What is the Percentage of People in the Labor Force in Barnegat?
69.1% of People are in the Labor Force in Barnegat.
What is the Unemployment Rate in Barnegat?
Unemployment Rate in Barnegat is 4.8%.