Zip Codes with the Highest Percentage of Population Employed in Food Preparation & Serving in Concord, NH
RELATED REPORTS & OPTIONS
Food Preparation & Serving
Concord
Compare Zip Codes
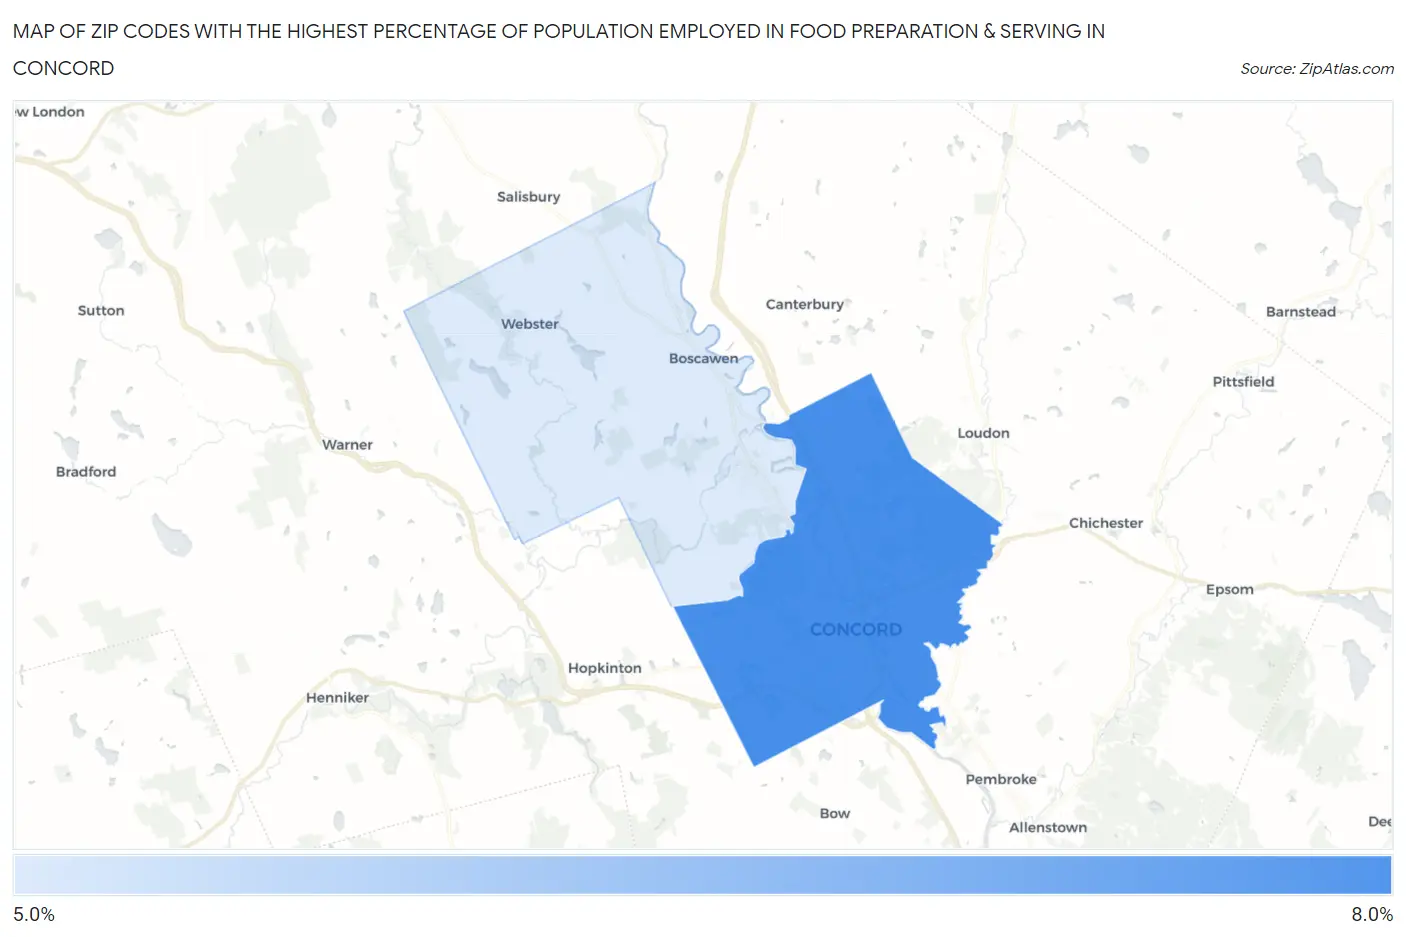
Map of Zip Codes with the Highest Percentage of Population Employed in Food Preparation & Serving in Concord
5.2%
7.0%
Zip Codes with the Highest Percentage of Population Employed in Food Preparation & Serving in Concord, NH
| Zip Code | % Employed | vs State | vs National | |
| 1. | 03301 | 7.0% | 5.2%(+1.78)#63 | 5.3%(+1.68)#6,642 |
| 2. | 03303 | 5.2% | 5.2%(-0.025)#93 | 5.3%(-0.118)#12,287 |
1
Common Questions
What are the Top Zip Codes with the Highest Percentage of Population Employed in Food Preparation & Serving in Concord, NH?
Top Zip Codes with the Highest Percentage of Population Employed in Food Preparation & Serving in Concord, NH are:
What zip code has the Highest Percentage of Population Employed in Food Preparation & Serving in Concord, NH?
03301 has the Highest Percentage of Population Employed in Food Preparation & Serving in Concord, NH with 7.0%.
What is the Percentage of Population Employed in Food Preparation & Serving in Concord, NH?
Percentage of Population Employed in Food Preparation & Serving in Concord is 6.4%.
What is the Percentage of Population Employed in Food Preparation & Serving in New Hampshire?
Percentage of Population Employed in Food Preparation & Serving in New Hampshire is 5.2%.
What is the Percentage of Population Employed in Food Preparation & Serving in the United States?
Percentage of Population Employed in Food Preparation & Serving in the United States is 5.3%.