Zip Codes with the Lowest Poverty Level Among Children Under the Age of 5 in Lincoln, NE
RELATED REPORTS & OPTIONS
Lowest Poverty | Child 0-5
Lincoln
Compare Zip Codes
Map of Zip Codes with the Lowest Poverty Level Among Children Under the Age of 5 in Lincoln
42.4%
5.9%
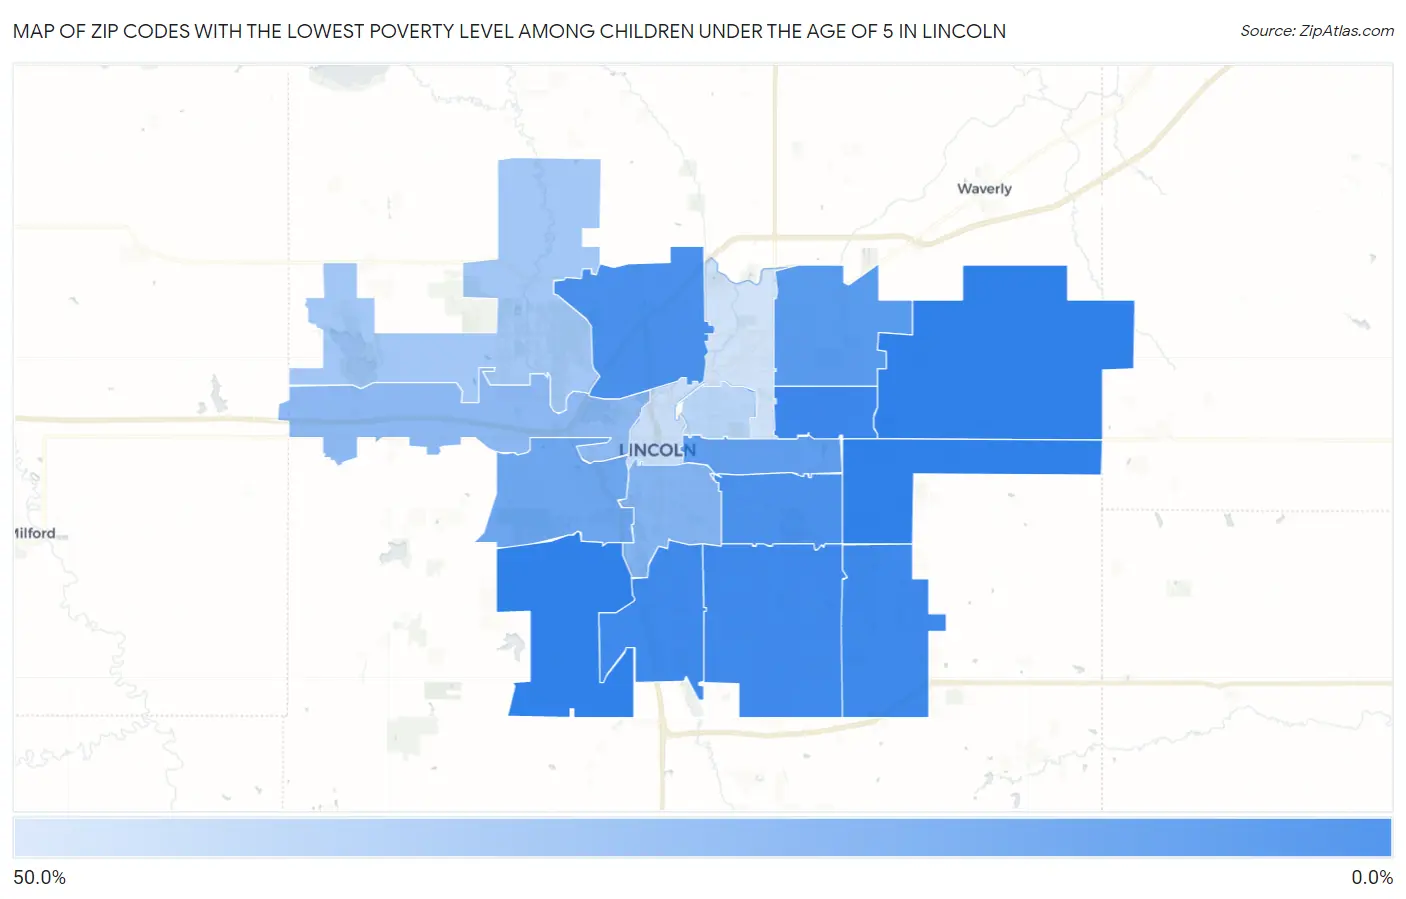
Zip Codes with the Lowest Poverty Level Among Children Under the Age of 5 in Lincoln, NE
| Zip Code | Child Poverty | vs State | vs National | |
| 1. | 68505 | 5.9% | 13.8%(-7.88)#67 | 18.1%(-12.2)#3,527 |
| 2. | 68526 | 6.2% | 13.8%(-7.60)#71 | 18.1%(-11.9)#3,714 |
| 3. | 68512 | 6.9% | 13.8%(-6.92)#84 | 18.1%(-11.2)#4,185 |
| 4. | 68516 | 7.1% | 13.8%(-6.70)#86 | 18.1%(-11.0)#4,332 |
| 5. | 68521 | 8.7% | 13.8%(-5.08)#97 | 18.1%(-9.37)#5,392 |
| 6. | 68506 | 9.2% | 13.8%(-4.62)#105 | 18.1%(-8.91)#5,724 |
| 7. | 68507 | 12.2% | 13.8%(-1.59)#137 | 18.1%(-5.88)#7,561 |
| 8. | 68510 | 13.8% | 13.8%(+0.015)#155 | 18.1%(-4.28)#8,495 |
| 9. | 68522 | 17.2% | 13.8%(+3.46)#186 | 18.1%(-0.834)#10,352 |
| 10. | 68502 | 22.2% | 13.8%(+8.41)#214 | 18.1%(+4.11)#12,551 |
| 11. | 68528 | 24.3% | 13.8%(+10.5)#224 | 18.1%(+6.22)#13,419 |
| 12. | 68524 | 30.2% | 13.8%(+16.5)#261 | 18.1%(+12.2)#15,390 |
| 13. | 68503 | 36.2% | 13.8%(+22.5)#281 | 18.1%(+18.2)#16,901 |
| 14. | 68508 | 39.6% | 13.8%(+25.8)#290 | 18.1%(+21.5)#17,563 |
| 15. | 68504 | 42.4% | 13.8%(+28.6)#297 | 18.1%(+24.3)#18,078 |
1
Common Questions
What are the Top 10 Zip Codes with the Lowest Poverty Level Among Children Under the Age of 5 in Lincoln, NE?
Top 10 Zip Codes with the Lowest Poverty Level Among Children Under the Age of 5 in Lincoln, NE are:
What zip code has the Lowest Poverty Level Among Children Under the Age of 5 in Lincoln, NE?
68505 has the Lowest Poverty Level Among Children Under the Age of 5 in Lincoln, NE with 5.9%.
What is the Poverty Level Among Children Under the Age of 5 in Lincoln, NE?
Poverty Level Among Children Under the Age of 5 in Lincoln is 14.8%.
What is the Poverty Level Among Children Under the Age of 5 in Nebraska?
Poverty Level Among Children Under the Age of 5 in Nebraska is 13.8%.
What is the Poverty Level Among Children Under the Age of 5 in the United States?
Poverty Level Among Children Under the Age of 5 in the United States is 18.1%.