Dickey, ND Map & Demographics
Dickey Map
Dickey Overview
$46,040
PER CAPITA INCOME
$106,250
AVG FAMILY INCOME
$106,786
AVG HOUSEHOLD INCOME
0.3%
WAGE / INCOME GAP [ % ]
99.7¢/ $1
WAGE / INCOME GAP [ $ ]
0.18
INEQUALITY / GINI INDEX
89
TOTAL POPULATION
47
MALE POPULATION
42
FEMALE POPULATION
111.90
MALES / 100 FEMALES
89.36
FEMALES / 100 MALES
64.8
MEDIAN AGE
2.2
AVG FAMILY SIZE
2.2
AVG HOUSEHOLD SIZE
27
LABOR FORCE [ PEOPLE ]
32.1%
PERCENT IN LABOR FORCE
Dickey Zip Codes
Dickey Area Codes
Income in Dickey
Income Overview in Dickey
Per Capita Income in Dickey is $46,040, while median incomes of families and households are $106,250 and $106,786 respectively.
| Characteristic | Number | Measure |
| Per Capita Income | 89 | $46,040 |
| Median Family Income | 38 | $106,250 |
| Mean Family Income | 38 | $94,466 |
| Median Household Income | 40 | $106,786 |
| Mean Household Income | 40 | $99,643 |
| Income Deficit | 38 | $0 |
| Wage / Income Gap (%) | 89 | 0.29% |
| Wage / Income Gap ($) | 89 | 99.71¢ per $1 |
| Gini / Inequality Index | 89 | 0.18 |
Earnings by Sex in Dickey
Average Earnings in Dickey are $60,764, $60,625 for men and $60,804 for women, a difference of 0.3%.
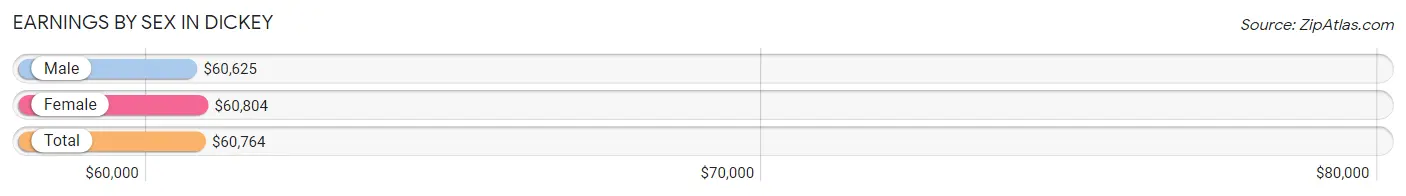
| Sex | Number | Average Earnings |
| Male | 8 (27.6%) | $60,625 |
| Female | 21 (72.4%) | $60,804 |
| Total | 29 (100.0%) | $60,764 |
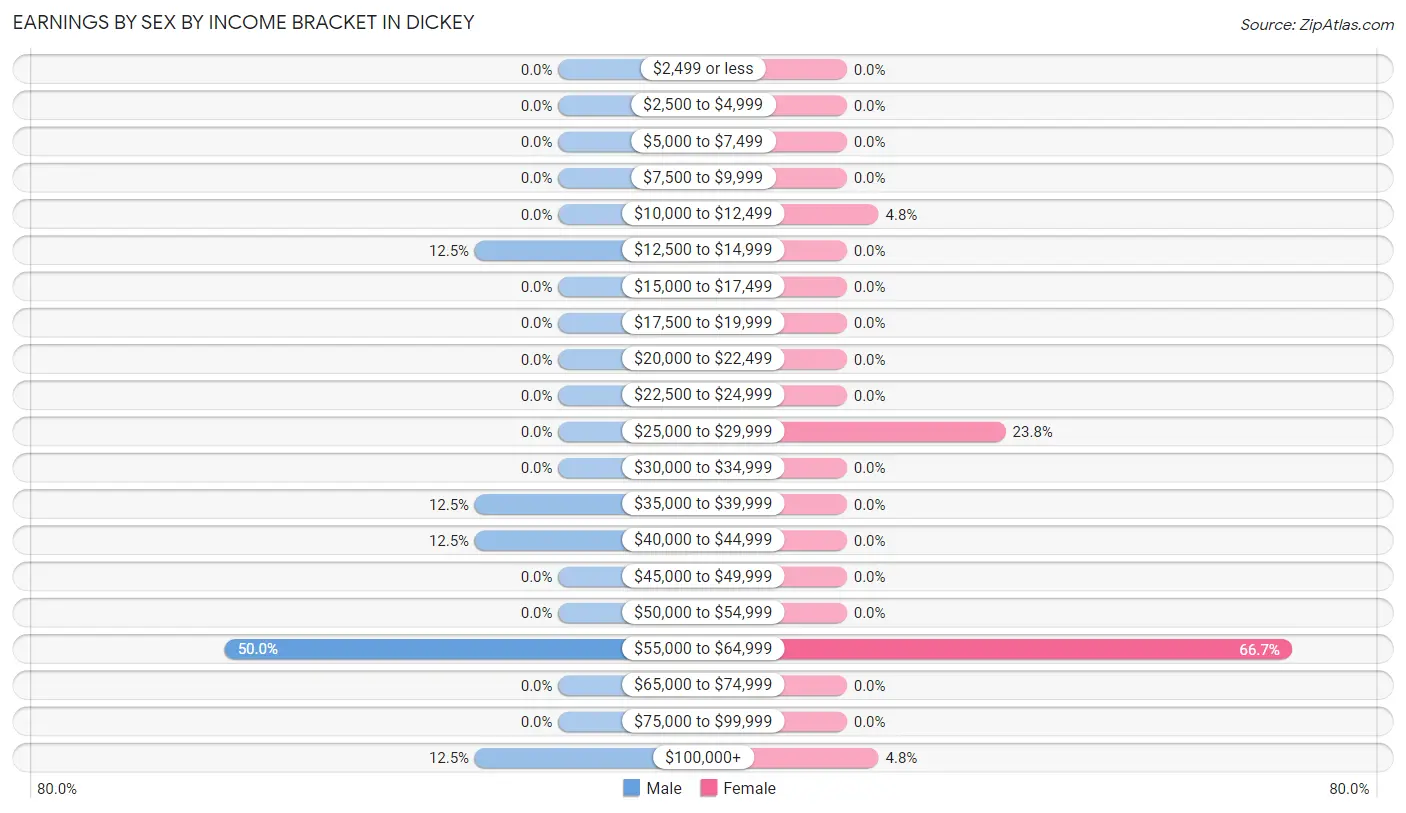
Earnings by Sex by Income Bracket in Dickey
The most common earnings brackets in Dickey are $55,000 to $64,999 for men (4 | 50.0%) and $55,000 to $64,999 for women (14 | 66.7%).
| Income | Male | Female |
| $2,499 or less | 0 (0.0%) | 0 (0.0%) |
| $2,500 to $4,999 | 0 (0.0%) | 0 (0.0%) |
| $5,000 to $7,499 | 0 (0.0%) | 0 (0.0%) |
| $7,500 to $9,999 | 0 (0.0%) | 0 (0.0%) |
| $10,000 to $12,499 | 0 (0.0%) | 1 (4.8%) |
| $12,500 to $14,999 | 1 (12.5%) | 0 (0.0%) |
| $15,000 to $17,499 | 0 (0.0%) | 0 (0.0%) |
| $17,500 to $19,999 | 0 (0.0%) | 0 (0.0%) |
| $20,000 to $22,499 | 0 (0.0%) | 0 (0.0%) |
| $22,500 to $24,999 | 0 (0.0%) | 0 (0.0%) |
| $25,000 to $29,999 | 0 (0.0%) | 5 (23.8%) |
| $30,000 to $34,999 | 0 (0.0%) | 0 (0.0%) |
| $35,000 to $39,999 | 1 (12.5%) | 0 (0.0%) |
| $40,000 to $44,999 | 1 (12.5%) | 0 (0.0%) |
| $45,000 to $49,999 | 0 (0.0%) | 0 (0.0%) |
| $50,000 to $54,999 | 0 (0.0%) | 0 (0.0%) |
| $55,000 to $64,999 | 4 (50.0%) | 14 (66.7%) |
| $65,000 to $74,999 | 0 (0.0%) | 0 (0.0%) |
| $75,000 to $99,999 | 0 (0.0%) | 0 (0.0%) |
| $100,000+ | 1 (12.5%) | 1 (4.8%) |
| Total | 8 (100.0%) | 21 (100.0%) |
Earnings by Sex by Educational Attainment in Dickey
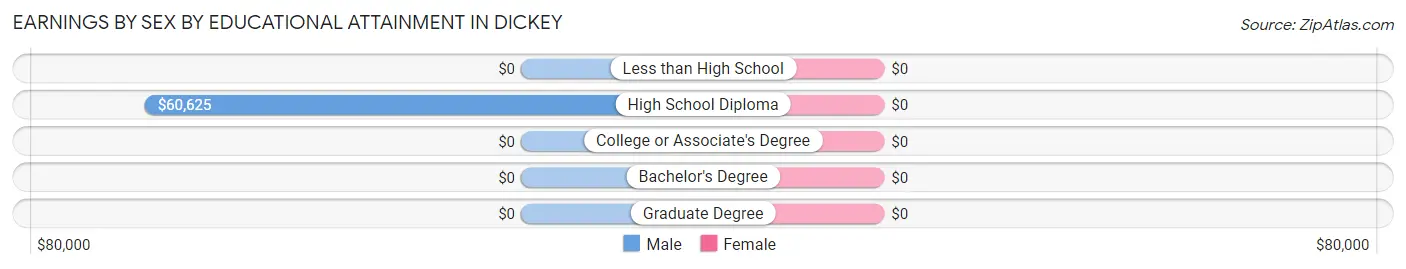
| Educational Attainment | Male Income | Female Income |
| Less than High School | - | - |
| High School Diploma | $60,625 | $0 |
| College or Associate's Degree | - | - |
| Bachelor's Degree | - | - |
| Graduate Degree | - | - |
| Total | $60,938 | $60,893 |
Family Income in Dickey
Family Income Brackets in Dickey
According to the Dickey family income data, there are 25 families falling into the $100,000 to $149,999 income range, which is the most common income bracket and makes up 65.8% of all families.
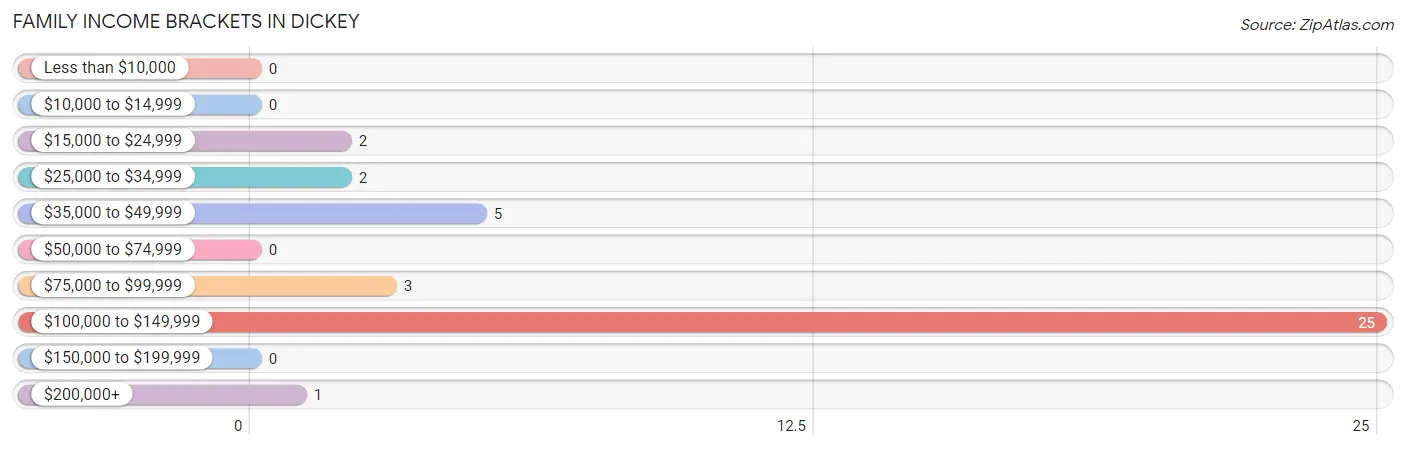
| Income Bracket | # Families | % Families |
| Less than $10,000 | 0 | 0.0% |
| $10,000 to $14,999 | 0 | 0.0% |
| $15,000 to $24,999 | 2 | 5.3% |
| $25,000 to $34,999 | 2 | 5.3% |
| $35,000 to $49,999 | 5 | 13.2% |
| $50,000 to $74,999 | 0 | 0.0% |
| $75,000 to $99,999 | 3 | 7.9% |
| $100,000 to $149,999 | 25 | 65.8% |
| $150,000 to $199,999 | 0 | 0.0% |
| $200,000+ | 1 | 2.6% |
Family Income by Famaliy Size in Dickey
2-person families (33 | 86.8%) account for the highest median family income in Dickey with $106,518 per family, while 2-person families (33 | 86.8%) have the highest median income of $53,259 per family member.
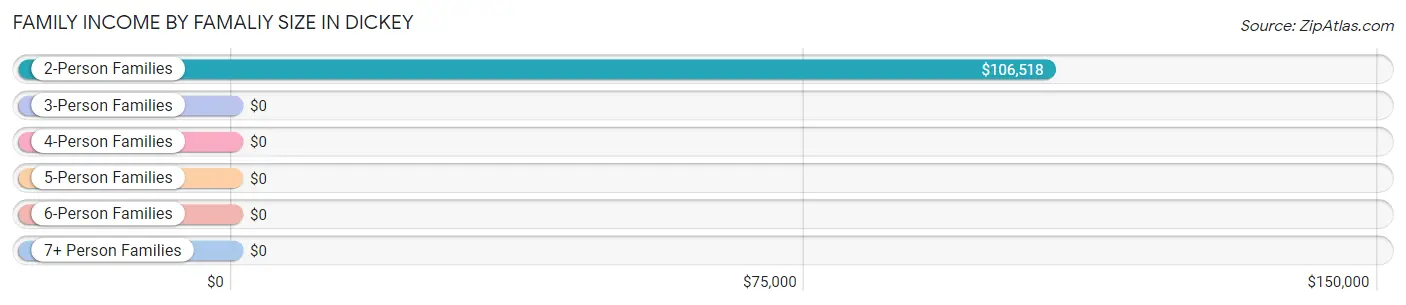
| Income Bracket | # Families | Median Income |
| 2-Person Families | 33 (86.8%) | $106,518 |
| 3-Person Families | 4 (10.5%) | $0 |
| 4-Person Families | 1 (2.6%) | $0 |
| 5-Person Families | 0 (0.0%) | $0 |
| 6-Person Families | 0 (0.0%) | $0 |
| 7+ Person Families | 0 (0.0%) | $0 |
| Total | 38 (100.0%) | $106,250 |
Family Income by Number of Earners in Dickey
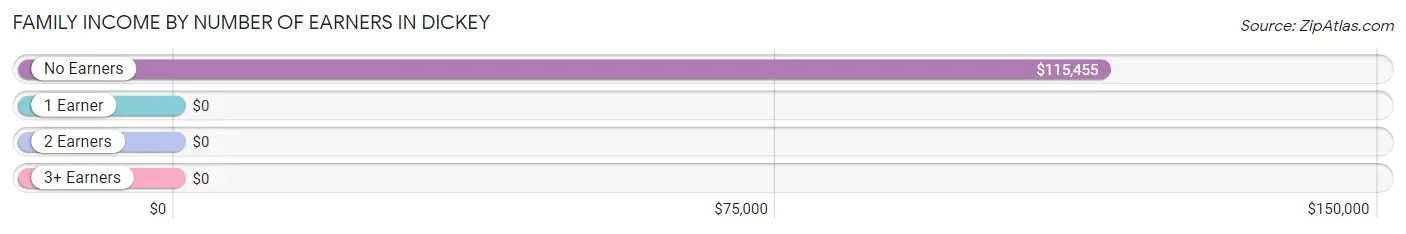
| Number of Earners | # Families | Median Income |
| No Earners | 18 (47.4%) | $115,455 |
| 1 Earner | 18 (47.4%) | $0 |
| 2 Earners | 2 (5.3%) | $0 |
| 3+ Earners | 0 (0.0%) | $0 |
| Total | 38 (100.0%) | $106,250 |
Household Income in Dickey
Household Income Brackets in Dickey
With 29 households falling in the category, the $100,000 to $149,999 income range is the most frequent in Dickey, accounting for 72.5% of all households.
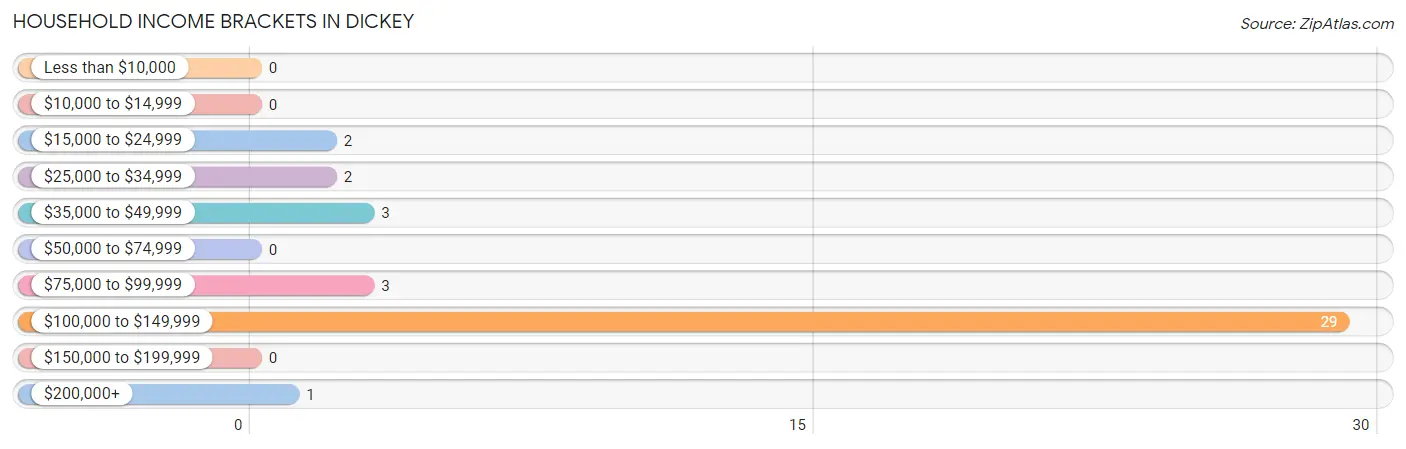
| Income Bracket | # Households | % Households |
| Less than $10,000 | 0 | 0.0% |
| $10,000 to $14,999 | 0 | 0.0% |
| $15,000 to $24,999 | 2 | 5.0% |
| $25,000 to $34,999 | 2 | 5.0% |
| $35,000 to $49,999 | 3 | 7.5% |
| $50,000 to $74,999 | 0 | 0.0% |
| $75,000 to $99,999 | 3 | 7.5% |
| $100,000 to $149,999 | 29 | 72.5% |
| $150,000 to $199,999 | 0 | 0.0% |
| $200,000+ | 1 | 2.5% |
Household Income by Householder Age in Dickey
The median household income in Dickey is $106,786, with the highest median household income of $115,341 found in the 65+ years age bracket for the primary householder. A total of 19 households (47.5%) fall into this category. Meanwhile, the 15 to 24 years age bracket for the primary householder has the lowest median household income of $0, with 1 households (2.5%) in this group.
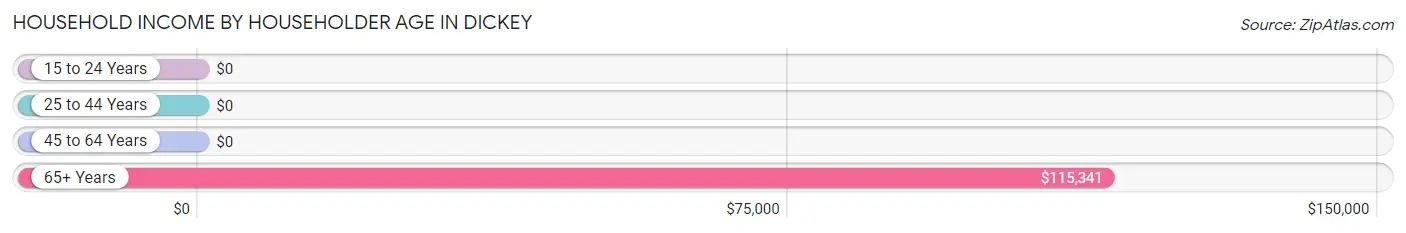
| Income Bracket | # Households | Median Income |
| 15 to 24 Years | 1 (2.5%) | $0 |
| 25 to 44 Years | 5 (12.5%) | $0 |
| 45 to 64 Years | 15 (37.5%) | $0 |
| 65+ Years | 19 (47.5%) | $115,341 |
| Total | 40 (100.0%) | $106,786 |
Poverty in Dickey
Income Below Poverty by Sex and Age in Dickey
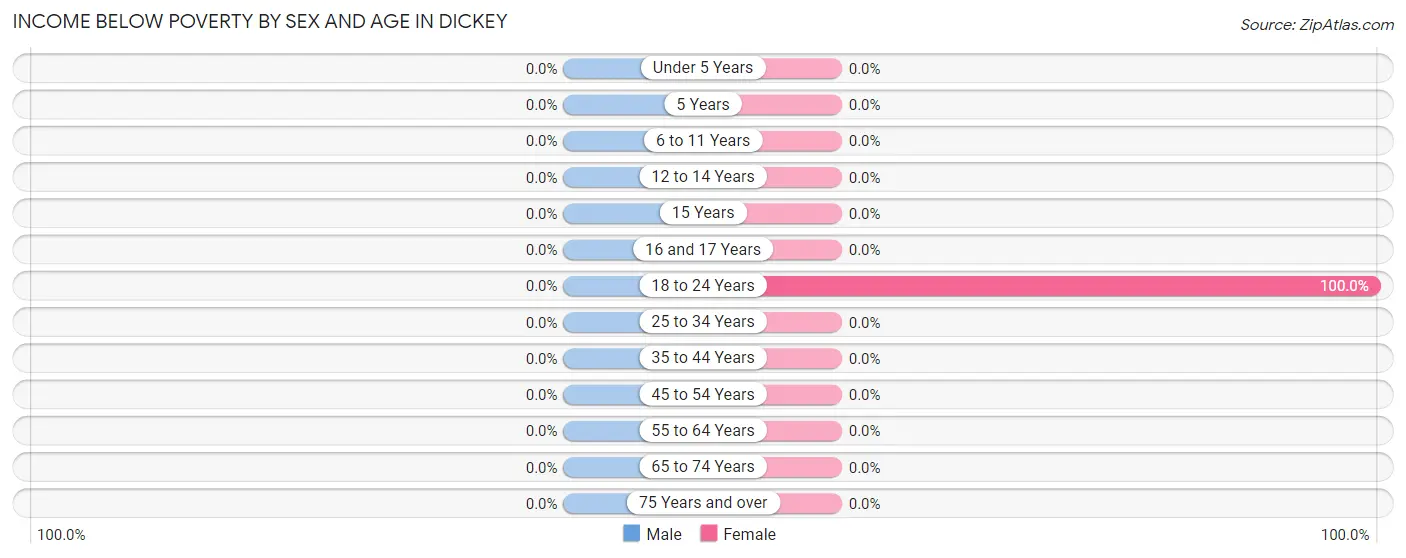
| Age Bracket | Male | Female |
| Under 5 Years | 0 (0.0%) | 0 (0.0%) |
| 5 Years | 0 (0.0%) | 0 (0.0%) |
| 6 to 11 Years | 0 (0.0%) | 0 (0.0%) |
| 12 to 14 Years | 0 (0.0%) | 0 (0.0%) |
| 15 Years | 0 (0.0%) | 0 (0.0%) |
| 16 and 17 Years | 0 (0.0%) | 0 (0.0%) |
| 18 to 24 Years | 0 (0.0%) | 1 (100.0%) |
| 25 to 34 Years | 0 (0.0%) | 0 (0.0%) |
| 35 to 44 Years | 0 (0.0%) | 0 (0.0%) |
| 45 to 54 Years | 0 (0.0%) | 0 (0.0%) |
| 55 to 64 Years | 0 (0.0%) | 0 (0.0%) |
| 65 to 74 Years | 0 (0.0%) | 0 (0.0%) |
| 75 Years and over | 0 (0.0%) | 0 (0.0%) |
| Total | 0 (0.0%) | 1 (2.4%) |
Income Above Poverty by Sex and Age in Dickey
According to the poverty statistics in Dickey, males aged 6 to 11 years and females aged 6 to 11 years are the age groups that are most secure financially, with 100.0% of males and 100.0% of females in these age groups living above the poverty line.
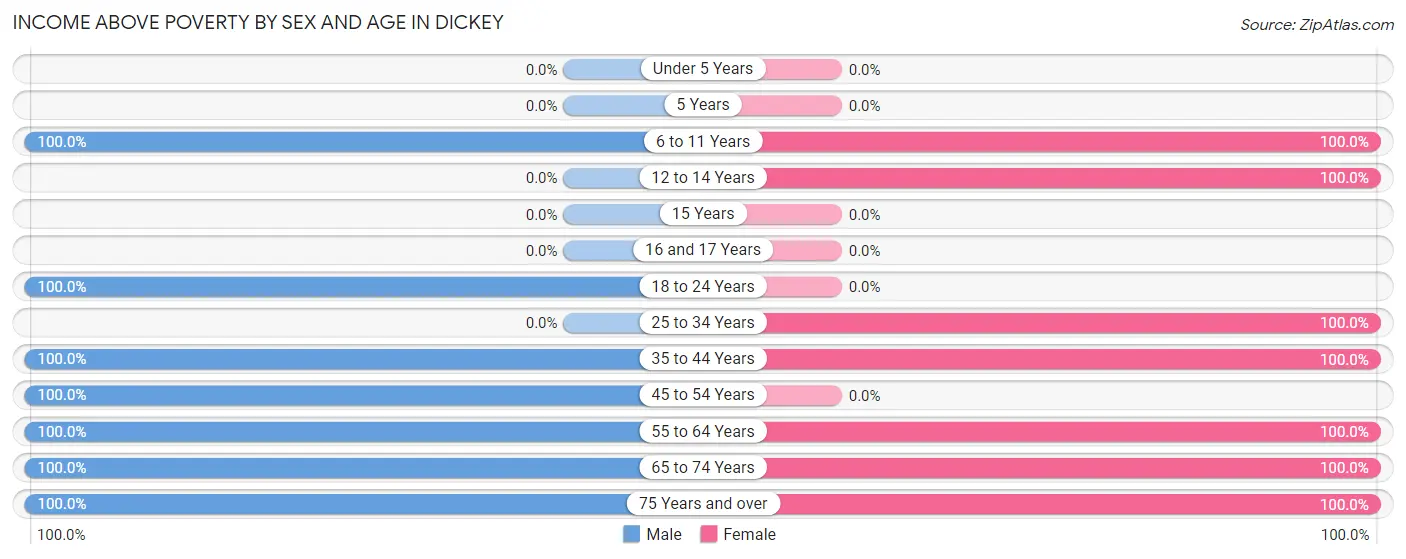
| Age Bracket | Male | Female |
| Under 5 Years | 0 (0.0%) | 0 (0.0%) |
| 5 Years | 0 (0.0%) | 0 (0.0%) |
| 6 to 11 Years | 1 (100.0%) | 1 (100.0%) |
| 12 to 14 Years | 0 (0.0%) | 3 (100.0%) |
| 15 Years | 0 (0.0%) | 0 (0.0%) |
| 16 and 17 Years | 0 (0.0%) | 0 (0.0%) |
| 18 to 24 Years | 4 (100.0%) | 0 (0.0%) |
| 25 to 34 Years | 0 (0.0%) | 1 (100.0%) |
| 35 to 44 Years | 1 (100.0%) | 4 (100.0%) |
| 45 to 54 Years | 4 (100.0%) | 0 (0.0%) |
| 55 to 64 Years | 1 (100.0%) | 26 (100.0%) |
| 65 to 74 Years | 29 (100.0%) | 3 (100.0%) |
| 75 Years and over | 7 (100.0%) | 3 (100.0%) |
| Total | 47 (100.0%) | 41 (97.6%) |
Income Below Poverty Among Married-Couple Families in Dickey
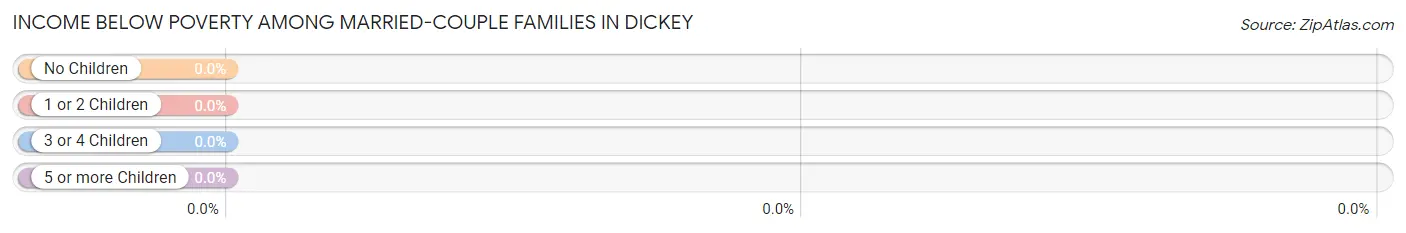
| Children | Above Poverty | Below Poverty |
| No Children | 33 (100.0%) | 0 (0.0%) |
| 1 or 2 Children | 1 (100.0%) | 0 (0.0%) |
| 3 or 4 Children | 0 (0.0%) | 0 (0.0%) |
| 5 or more Children | 0 (0.0%) | 0 (0.0%) |
| Total | 34 (100.0%) | 0 (0.0%) |
Income Below Poverty Among Single-Parent Households in Dickey
| Children | Single Father | Single Mother |
| No Children | 0 (0.0%) | 0 (0.0%) |
| 1 or 2 Children | 0 (0.0%) | 0 (0.0%) |
| 3 or 4 Children | 0 (0.0%) | 0 (0.0%) |
| 5 or more Children | 0 (0.0%) | 0 (0.0%) |
| Total | 0 (0.0%) | 0 (0.0%) |
Income Below Poverty Among Married-Couple vs Single-Parent Households in Dickey
| Children | Married-Couple Families | Single-Parent Households |
| No Children | 0 (0.0%) | 0 (0.0%) |
| 1 or 2 Children | 0 (0.0%) | 0 (0.0%) |
| 3 or 4 Children | 0 (0.0%) | 0 (0.0%) |
| 5 or more Children | 0 (0.0%) | 0 (0.0%) |
| Total | 0 (0.0%) | 0 (0.0%) |
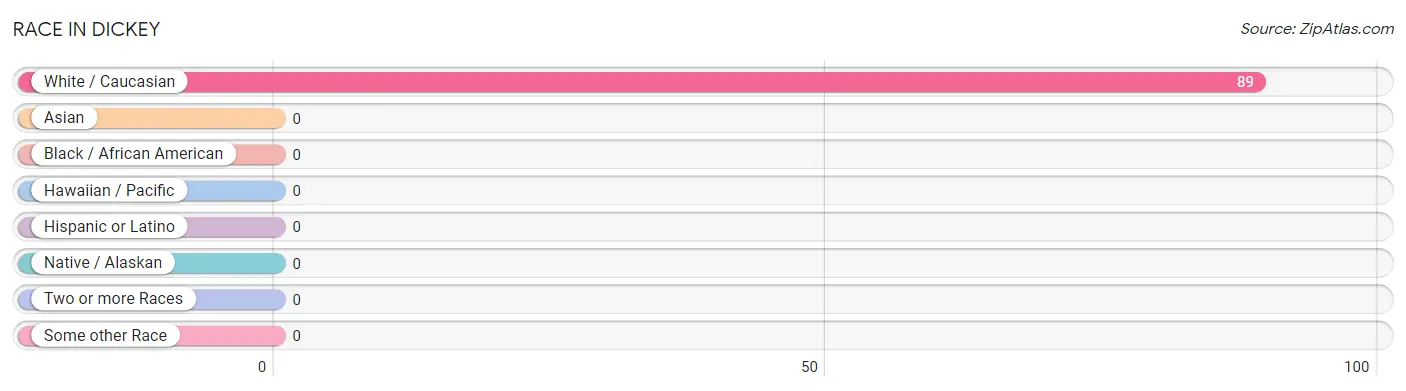
Race in Dickey
The most populous races in Dickey are , and White / Caucasian (89 | 100.0%).
| Race | # Population | % Population |
| Asian | 0 | 0.0% |
| Black / African American | 0 | 0.0% |
| Hawaiian / Pacific | 0 | 0.0% |
| Hispanic or Latino | 0 | 0.0% |
| Native / Alaskan | 0 | 0.0% |
| White / Caucasian | 89 | 100.0% |
| Two or more Races | 0 | 0.0% |
| Some other Race | 0 | 0.0% |
| Total | 89 | 100.0% |
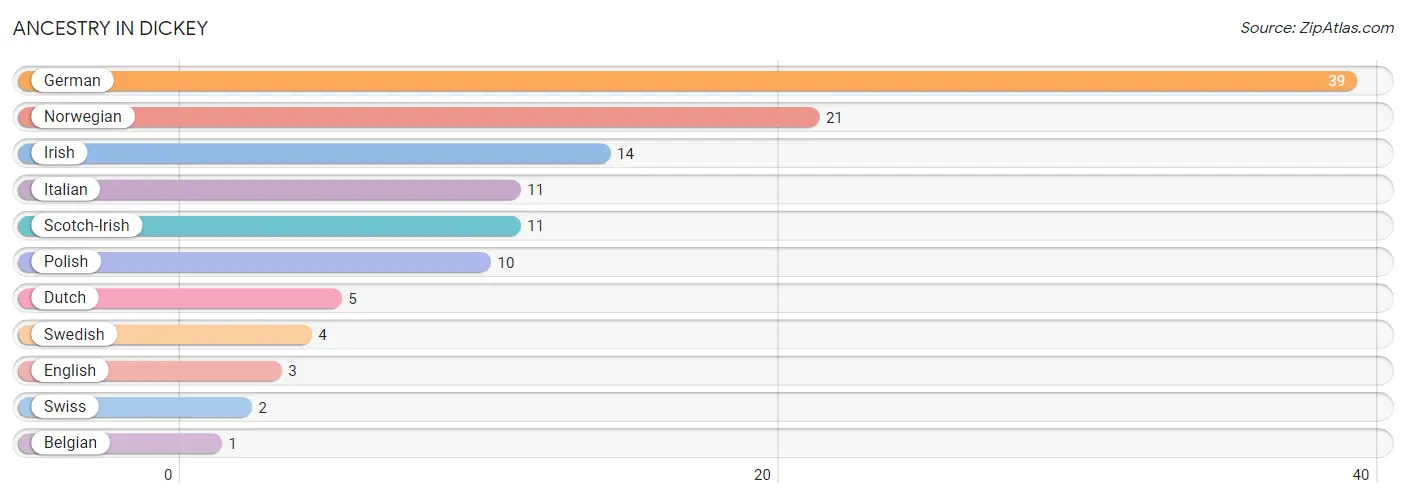
Ancestry in Dickey
The most populous ancestries reported in Dickey are German (39 | 43.8%), Norwegian (21 | 23.6%), Irish (14 | 15.7%), Italian (11 | 12.4%), and Scotch-Irish (11 | 12.4%), together accounting for 107.9% of all Dickey residents.
| Ancestry | # Population | % Population |
| Belgian | 1 | 1.1% |
| Dutch | 5 | 5.6% |
| English | 3 | 3.4% |
| German | 39 | 43.8% |
| Irish | 14 | 15.7% |
| Italian | 11 | 12.4% |
| Norwegian | 21 | 23.6% |
| Polish | 10 | 11.2% |
| Scotch-Irish | 11 | 12.4% |
| Swedish | 4 | 4.5% |
| Swiss | 2 | 2.2% | View All 11 Rows |
Immigrants in Dickey

| Immigration Origin | # Population | % Population | View All 0 Rows |
Sex and Age in Dickey
Sex and Age in Dickey
The most populous age groups in Dickey are 65 to 69 Years (29 | 61.7%) for men and 60 to 64 Years (15 | 35.7%) for women.
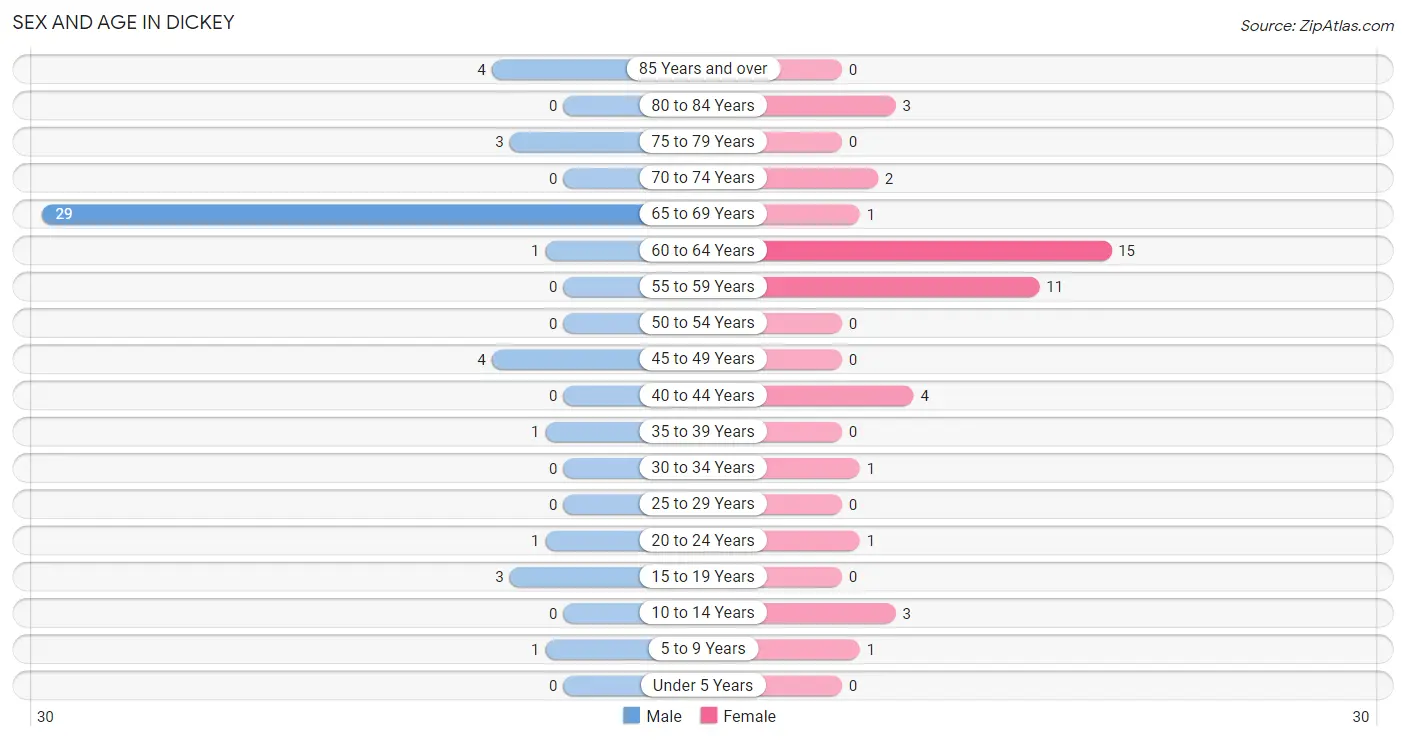
| Age Bracket | Male | Female |
| Under 5 Years | 0 (0.0%) | 0 (0.0%) |
| 5 to 9 Years | 1 (2.1%) | 1 (2.4%) |
| 10 to 14 Years | 0 (0.0%) | 3 (7.1%) |
| 15 to 19 Years | 3 (6.4%) | 0 (0.0%) |
| 20 to 24 Years | 1 (2.1%) | 1 (2.4%) |
| 25 to 29 Years | 0 (0.0%) | 0 (0.0%) |
| 30 to 34 Years | 0 (0.0%) | 1 (2.4%) |
| 35 to 39 Years | 1 (2.1%) | 0 (0.0%) |
| 40 to 44 Years | 0 (0.0%) | 4 (9.5%) |
| 45 to 49 Years | 4 (8.5%) | 0 (0.0%) |
| 50 to 54 Years | 0 (0.0%) | 0 (0.0%) |
| 55 to 59 Years | 0 (0.0%) | 11 (26.2%) |
| 60 to 64 Years | 1 (2.1%) | 15 (35.7%) |
| 65 to 69 Years | 29 (61.7%) | 1 (2.4%) |
| 70 to 74 Years | 0 (0.0%) | 2 (4.8%) |
| 75 to 79 Years | 3 (6.4%) | 0 (0.0%) |
| 80 to 84 Years | 0 (0.0%) | 3 (7.1%) |
| 85 Years and over | 4 (8.5%) | 0 (0.0%) |
| Total | 47 (100.0%) | 42 (100.0%) |
Families and Households in Dickey
Median Family Size in Dickey
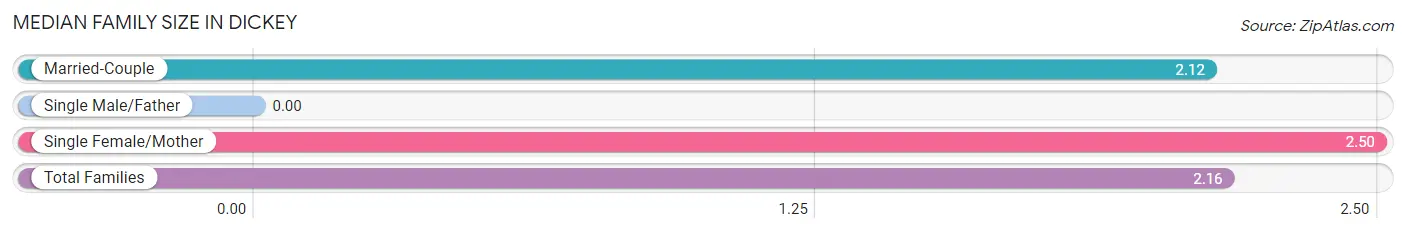
| Family Type | # Families | Family Size |
| Married-Couple | 34 (89.5%) | 2.12 |
| Single Male/Father | 0 (0.0%) | - |
| Single Female/Mother | 4 (10.5%) | 2.50 |
| Total Families | 38 (100.0%) | 2.16 |
Median Household Size in Dickey
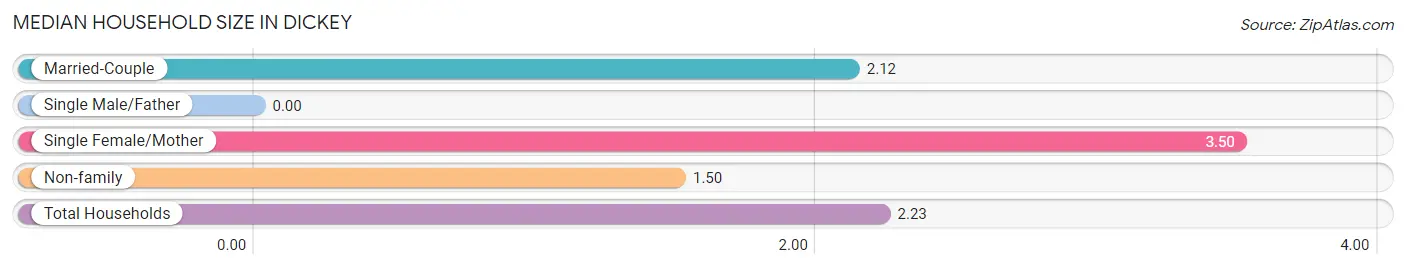
| Household Type | # Households | Household Size |
| Married-Couple | 34 (85.0%) | 2.12 |
| Single Male/Father | 0 (0.0%) | - |
| Single Female/Mother | 4 (10.0%) | 3.50 |
| Non-family | 2 (5.0%) | 1.50 |
| Total Households | 40 (100.0%) | 2.23 |
Household Size by Marriage Status in Dickey
Out of a total of 40 households in Dickey, 38 (95.0%) are family households, while 2 (5.0%) are nonfamily households. The most numerous type of family households are 2-person households, comprising 33, and the most common type of nonfamily households are 1-person households, comprising 1.
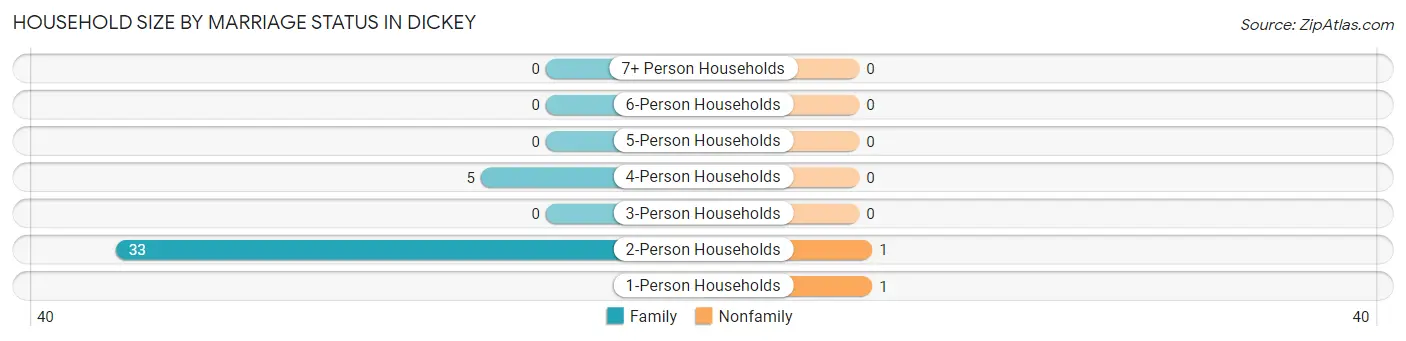
| Household Size | Family Households | Nonfamily Households |
| 1-Person Households | - | 1 (2.5%) |
| 2-Person Households | 33 (82.5%) | 1 (2.5%) |
| 3-Person Households | 0 (0.0%) | 0 (0.0%) |
| 4-Person Households | 5 (12.5%) | 0 (0.0%) |
| 5-Person Households | 0 (0.0%) | 0 (0.0%) |
| 6-Person Households | 0 (0.0%) | 0 (0.0%) |
| 7+ Person Households | 0 (0.0%) | 0 (0.0%) |
| Total | 38 (95.0%) | 2 (5.0%) |
Female Fertility in Dickey
Fertility by Age in Dickey
| Age Bracket | Women with Births | Births / 1,000 Women |
| 15 to 19 years | 0 (0.0%) | 0.0 |
| 20 to 34 years | 0 (0.0%) | 0.0 |
| 35 to 50 years | 0 (0.0%) | 0.0 |
| Total | 0 (0.0%) | 0.0 |
Fertility by Age by Marriage Status in Dickey
| Age Bracket | Married | Unmarried |
| 15 to 19 years | 0 (0.0%) | 0 (0.0%) |
| 20 to 34 years | 0 (0.0%) | 0 (0.0%) |
| 35 to 50 years | 0 (0.0%) | 0 (0.0%) |
| Total | 0 (0.0%) | 0 (0.0%) |
Fertility by Education in Dickey
| Educational Attainment | Women with Births | Births / 1,000 Women |
| Less than High School | 0 (0.0%) | 0.0 |
| High School Diploma | 0 (0.0%) | 0.0 |
| College or Associate's Degree | 0 (0.0%) | 0.0 |
| Bachelor's Degree | 0 (0.0%) | 0.0 |
| Graduate Degree | 0 (0.0%) | 0.0 |
| Total | 0 (0.0%) | 0.0 |
Fertility by Education by Marriage Status in Dickey
| Educational Attainment | Married | Unmarried |
| Less than High School | 0 (0.0%) | 0 (0.0%) |
| High School Diploma | 0 (0.0%) | 0 (0.0%) |
| College or Associate's Degree | 0 (0.0%) | 0 (0.0%) |
| Bachelor's Degree | 0 (0.0%) | 0 (0.0%) |
| Graduate Degree | 0 (0.0%) | 0 (0.0%) |
| Total | 0 (0.0%) | 0 (0.0%) |
Employment Characteristics in Dickey
Employment by Class of Employer in Dickey
Among the 27 employed individuals in Dickey, local government employees (14 | 51.8%), private company employees (7 | 25.9%), and self-employed (not incorporated) (6 | 22.2%) make up the most common classes of employment.
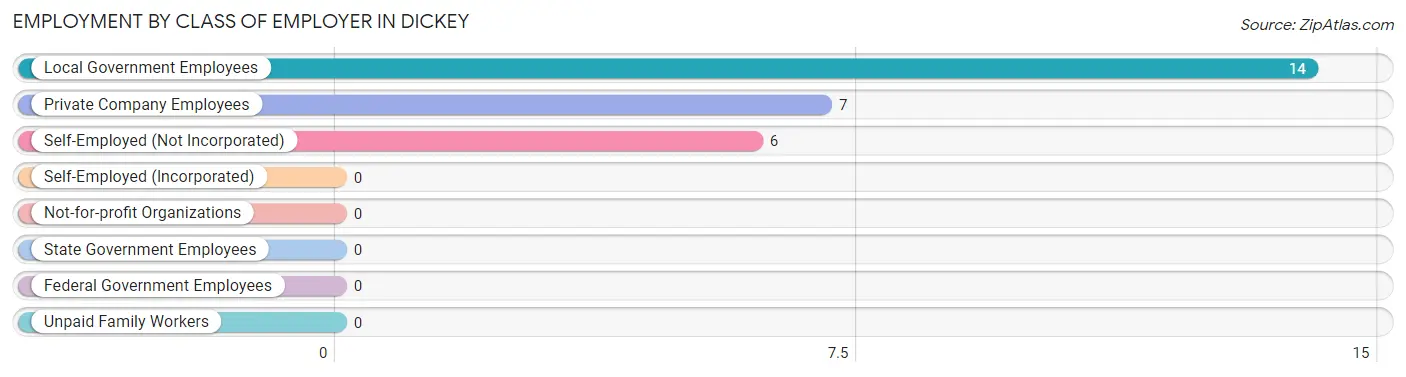
| Employer Class | # Employees | % Employees |
| Private Company Employees | 7 | 25.9% |
| Self-Employed (Incorporated) | 0 | 0.0% |
| Self-Employed (Not Incorporated) | 6 | 22.2% |
| Not-for-profit Organizations | 0 | 0.0% |
| Local Government Employees | 14 | 51.8% |
| State Government Employees | 0 | 0.0% |
| Federal Government Employees | 0 | 0.0% |
| Unpaid Family Workers | 0 | 0.0% |
| Total | 27 | 100.0% |
Employment Status by Age in Dickey
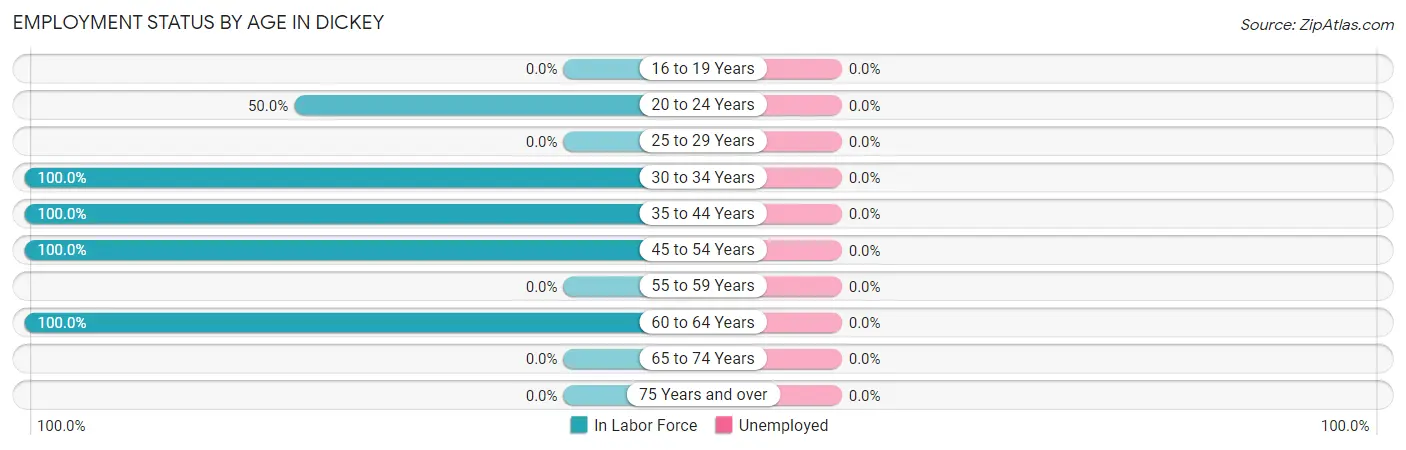
| Age Bracket | In Labor Force | Unemployed |
| 16 to 19 Years | 0 (0.0%) | 0 (0.0%) |
| 20 to 24 Years | 1 (50.0%) | 0 (0.0%) |
| 25 to 29 Years | 0 (0.0%) | 0 (0.0%) |
| 30 to 34 Years | 1 (100.0%) | 0 (0.0%) |
| 35 to 44 Years | 5 (100.0%) | 0 (0.0%) |
| 45 to 54 Years | 4 (100.0%) | 0 (0.0%) |
| 55 to 59 Years | 0 (0.0%) | 0 (0.0%) |
| 60 to 64 Years | 16 (100.0%) | 0 (0.0%) |
| 65 to 74 Years | 0 (0.0%) | 0 (0.0%) |
| 75 Years and over | 0 (0.0%) | 0 (0.0%) |
| Total | 27 (32.1%) | 0 (0.0%) |
Employment Status by Educational Attainment in Dickey
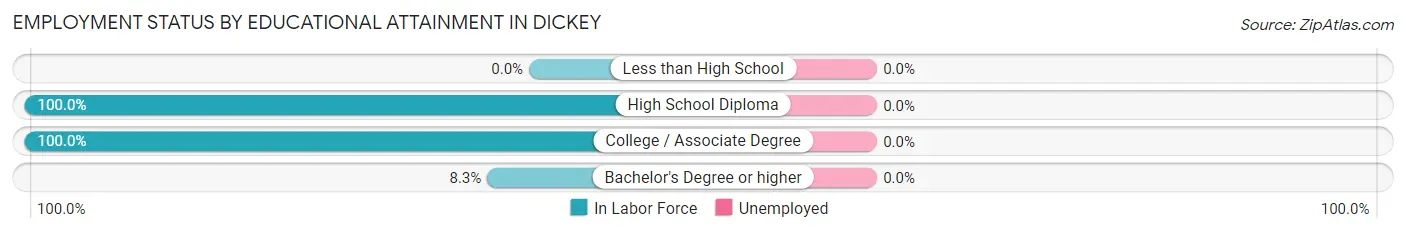
| Educational Attainment | In Labor Force | Unemployed |
| Less than High School | 0 (0.0%) | 0 (0.0%) |
| High School Diploma | 6 (100.0%) | 0 (0.0%) |
| College / Associate Degree | 19 (100.0%) | 0 (0.0%) |
| Bachelor's Degree or higher | 1 (8.3%) | 0 (0.0%) |
| Total | 26 (70.3%) | 0 (0.0%) |
Employment Occupations by Sex in Dickey
Management, Business, Science and Arts Occupations
The most common Management, Business, Science and Arts occupations in Dickey are , and Management (20 | 74.1%).
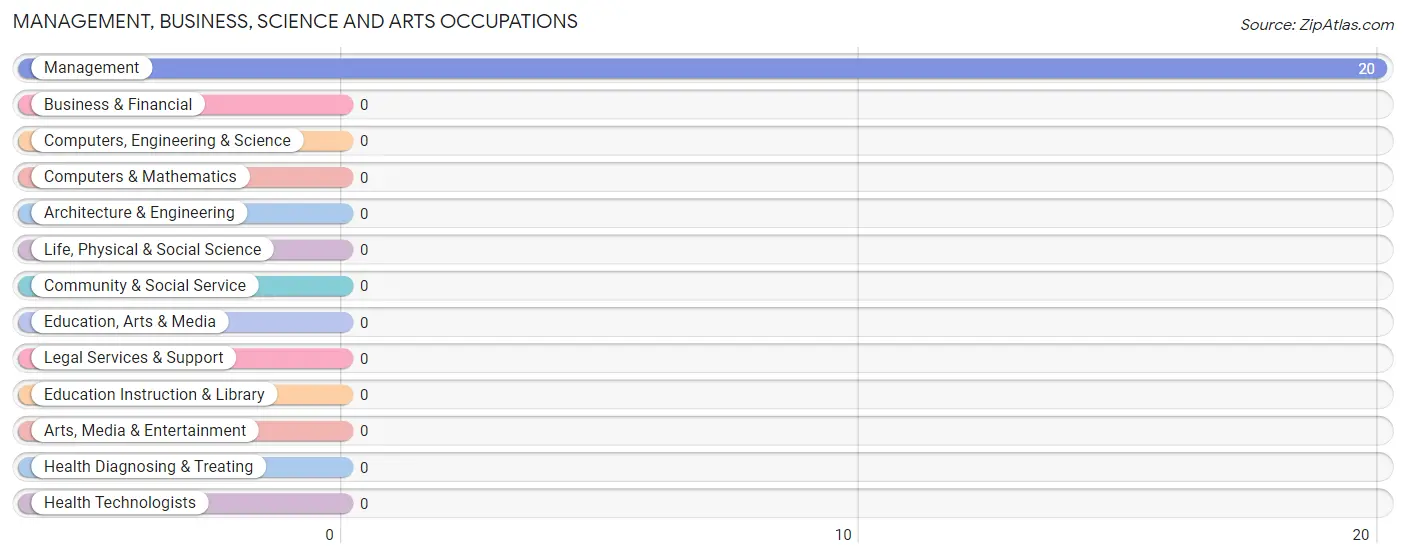
Management, Business, Science and Arts Occupations by Sex
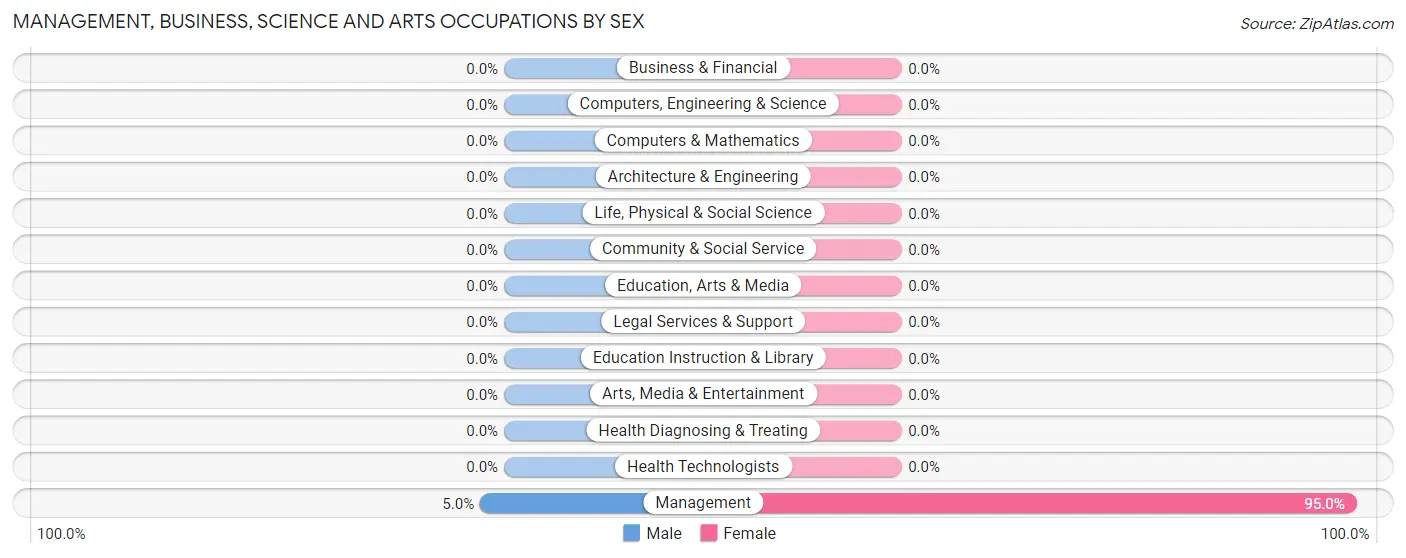
| Occupation | Male | Female |
| Management | 1 (5.0%) | 19 (95.0%) |
| Business & Financial | 0 (0.0%) | 0 (0.0%) |
| Computers, Engineering & Science | 0 (0.0%) | 0 (0.0%) |
| Computers & Mathematics | 0 (0.0%) | 0 (0.0%) |
| Architecture & Engineering | 0 (0.0%) | 0 (0.0%) |
| Life, Physical & Social Science | 0 (0.0%) | 0 (0.0%) |
| Community & Social Service | 0 (0.0%) | 0 (0.0%) |
| Education, Arts & Media | 0 (0.0%) | 0 (0.0%) |
| Legal Services & Support | 0 (0.0%) | 0 (0.0%) |
| Education Instruction & Library | 0 (0.0%) | 0 (0.0%) |
| Arts, Media & Entertainment | 0 (0.0%) | 0 (0.0%) |
| Health Diagnosing & Treating | 0 (0.0%) | 0 (0.0%) |
| Health Technologists | 0 (0.0%) | 0 (0.0%) |
| Total (Category) | 1 (5.0%) | 19 (95.0%) |
| Total (Overall) | 7 (25.9%) | 20 (74.1%) |
Services Occupations
Services Occupations by Sex
| Occupation | Male | Female |
| Healthcare Support | 0 (0.0%) | 0 (0.0%) |
| Security & Protection | 0 (0.0%) | 0 (0.0%) |
| Firefighting & Prevention | 0 (0.0%) | 0 (0.0%) |
| Law Enforcement | 0 (0.0%) | 0 (0.0%) |
| Food Preparation & Serving | 0 (0.0%) | 0 (0.0%) |
| Cleaning & Maintenance | 0 (0.0%) | 0 (0.0%) |
| Personal Care & Service | 0 (0.0%) | 0 (0.0%) |
| Total (Category) | 0 (0.0%) | 0 (0.0%) |
| Total (Overall) | 7 (25.9%) | 20 (74.1%) |
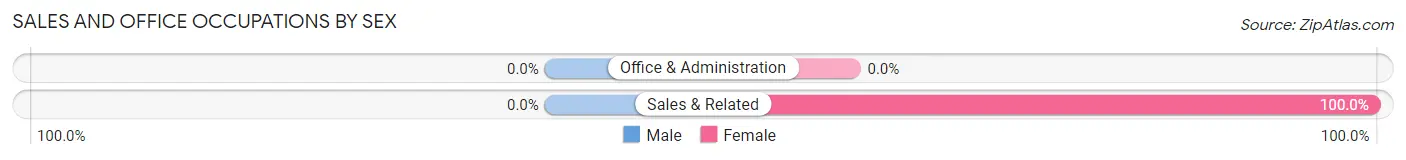
Sales and Office Occupations
The most common Sales and Office occupations in Dickey are , and Sales & Related (1 | 3.7%).
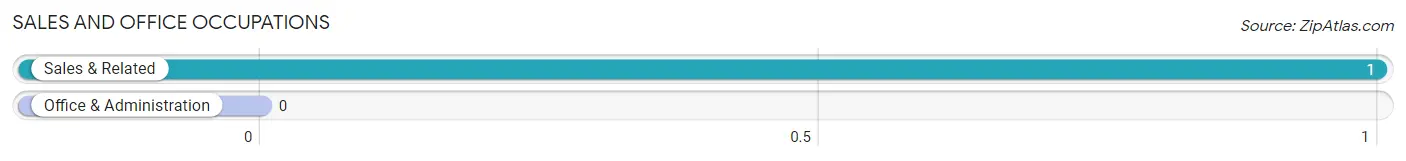
Sales and Office Occupations by Sex
| Occupation | Male | Female |
| Sales & Related | 0 (0.0%) | 1 (100.0%) |
| Office & Administration | 0 (0.0%) | 0 (0.0%) |
| Total (Category) | 0 (0.0%) | 1 (100.0%) |
| Total (Overall) | 7 (25.9%) | 20 (74.1%) |
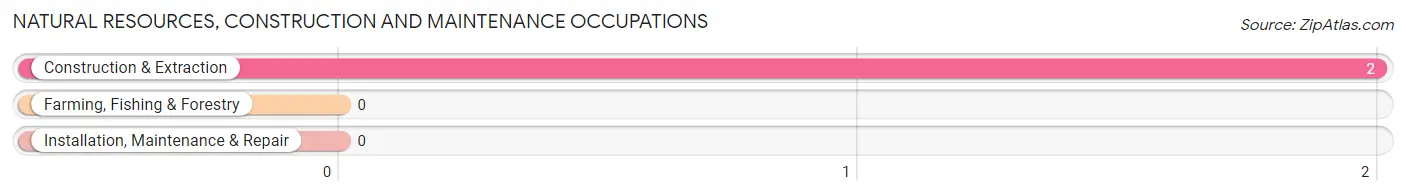
Natural Resources, Construction and Maintenance Occupations
The most common Natural Resources, Construction and Maintenance occupations in Dickey are , and Construction & Extraction (2 | 7.4%).
Natural Resources, Construction and Maintenance Occupations by Sex
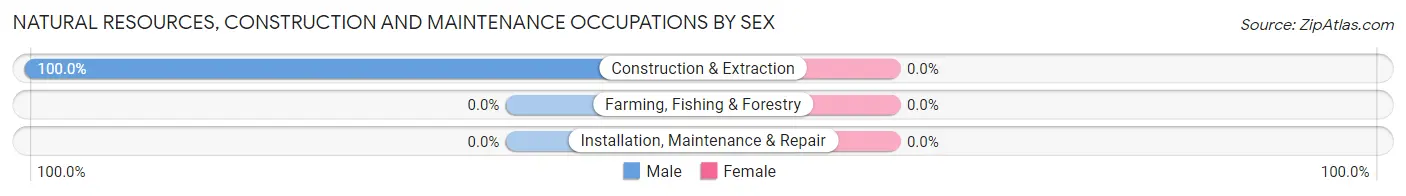
| Occupation | Male | Female |
| Farming, Fishing & Forestry | 0 (0.0%) | 0 (0.0%) |
| Construction & Extraction | 2 (100.0%) | 0 (0.0%) |
| Installation, Maintenance & Repair | 0 (0.0%) | 0 (0.0%) |
| Total (Category) | 2 (100.0%) | 0 (0.0%) |
| Total (Overall) | 7 (25.9%) | 20 (74.1%) |
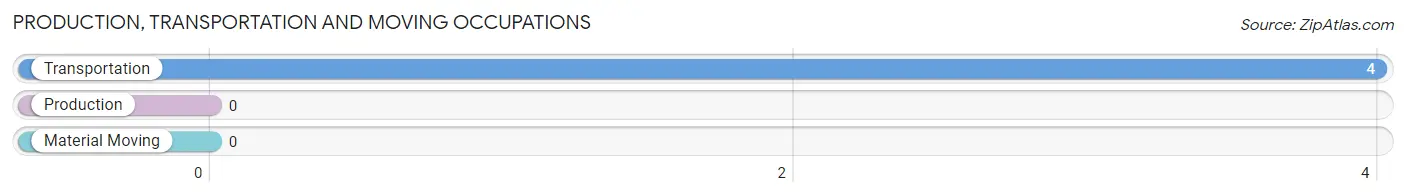
Production, Transportation and Moving Occupations
The most common Production, Transportation and Moving occupations in Dickey are , and Transportation (4 | 14.8%).
Production, Transportation and Moving Occupations by Sex
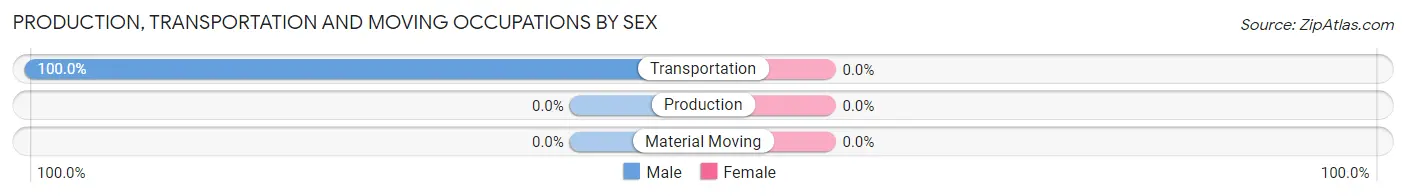
| Occupation | Male | Female |
| Production | 0 (0.0%) | 0 (0.0%) |
| Transportation | 4 (100.0%) | 0 (0.0%) |
| Material Moving | 0 (0.0%) | 0 (0.0%) |
| Total (Category) | 4 (100.0%) | 0 (0.0%) |
| Total (Overall) | 7 (25.9%) | 20 (74.1%) |
Employment Industries by Sex in Dickey
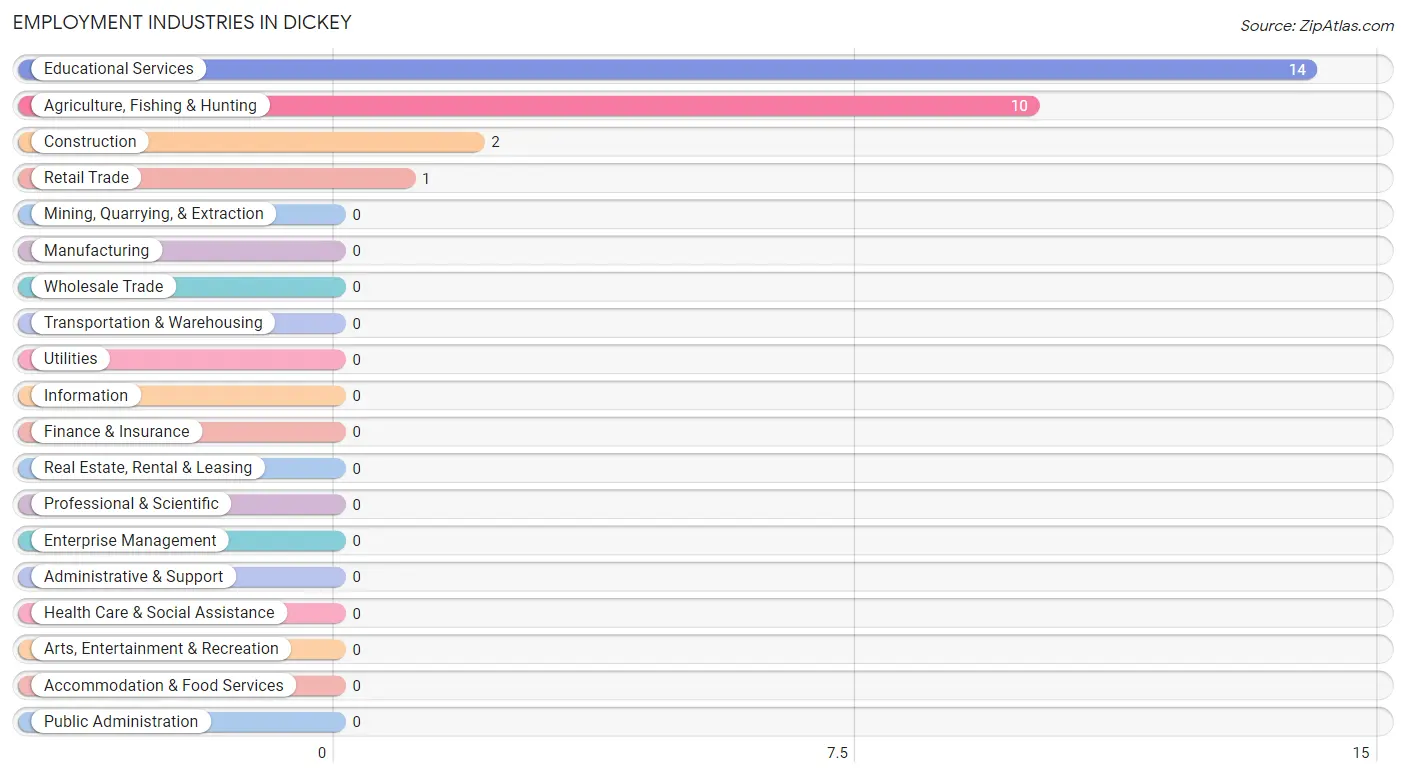
Employment Industries in Dickey
The major employment industries in Dickey include Educational Services (14 | 51.8%), Agriculture, Fishing & Hunting (10 | 37.0%), Construction (2 | 7.4%), and Retail Trade (1 | 3.7%).
Employment Industries by Sex in Dickey
The Dickey industries that see more men than women are Construction (100.0%), and Agriculture, Fishing & Hunting (50.0%), whereas the industries that tend to have a higher number of women are Retail Trade (100.0%), Educational Services (100.0%), and Agriculture, Fishing & Hunting (50.0%).
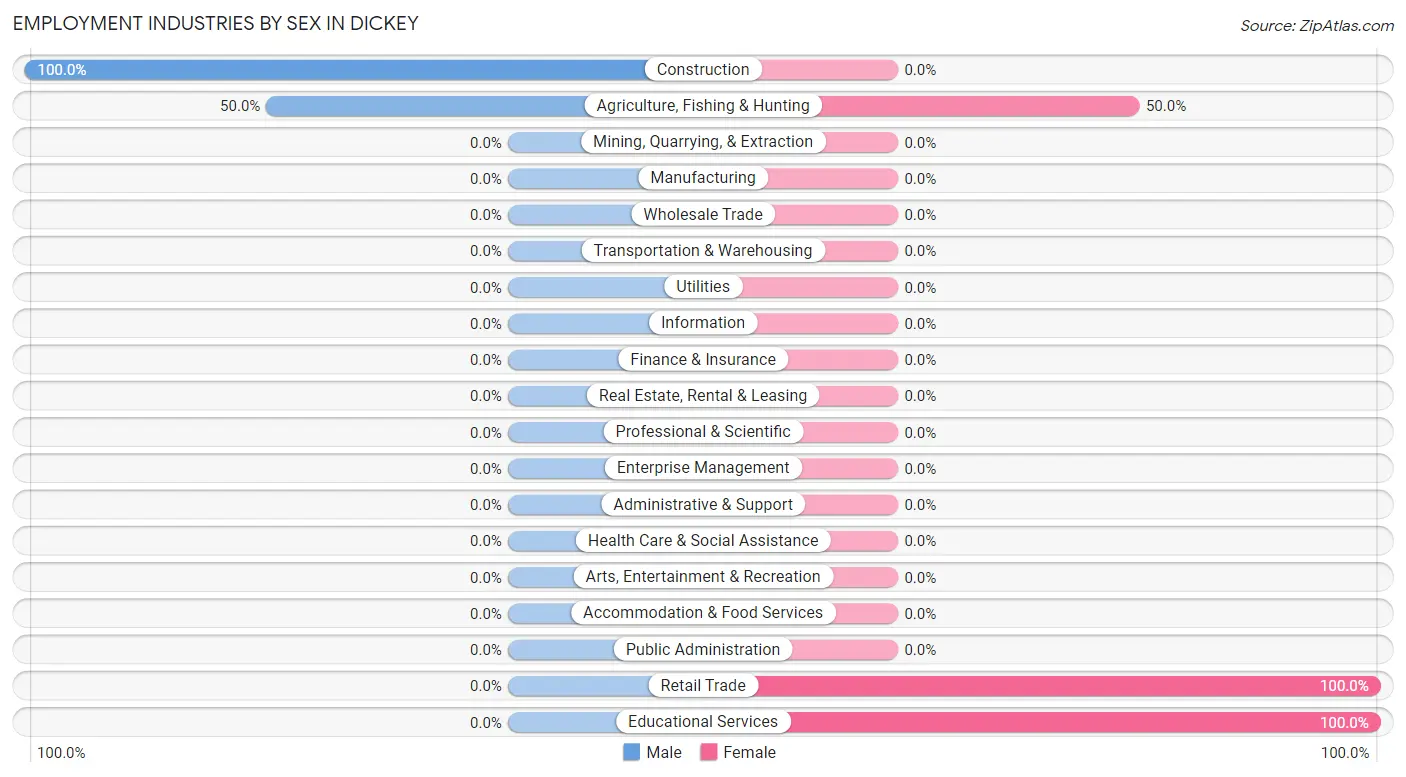
| Industry | Male | Female |
| Agriculture, Fishing & Hunting | 5 (50.0%) | 5 (50.0%) |
| Mining, Quarrying, & Extraction | 0 (0.0%) | 0 (0.0%) |
| Construction | 2 (100.0%) | 0 (0.0%) |
| Manufacturing | 0 (0.0%) | 0 (0.0%) |
| Wholesale Trade | 0 (0.0%) | 0 (0.0%) |
| Retail Trade | 0 (0.0%) | 1 (100.0%) |
| Transportation & Warehousing | 0 (0.0%) | 0 (0.0%) |
| Utilities | 0 (0.0%) | 0 (0.0%) |
| Information | 0 (0.0%) | 0 (0.0%) |
| Finance & Insurance | 0 (0.0%) | 0 (0.0%) |
| Real Estate, Rental & Leasing | 0 (0.0%) | 0 (0.0%) |
| Professional & Scientific | 0 (0.0%) | 0 (0.0%) |
| Enterprise Management | 0 (0.0%) | 0 (0.0%) |
| Administrative & Support | 0 (0.0%) | 0 (0.0%) |
| Educational Services | 0 (0.0%) | 14 (100.0%) |
| Health Care & Social Assistance | 0 (0.0%) | 0 (0.0%) |
| Arts, Entertainment & Recreation | 0 (0.0%) | 0 (0.0%) |
| Accommodation & Food Services | 0 (0.0%) | 0 (0.0%) |
| Public Administration | 0 (0.0%) | 0 (0.0%) |
| Total | 7 (25.9%) | 20 (74.1%) |
Education in Dickey
School Enrollment in Dickey
The most common levels of schooling among the 9 students in Dickey are high school (6 | 66.7%), kindergarten (1 | 11.1%), and elementary school (1 | 11.1%).
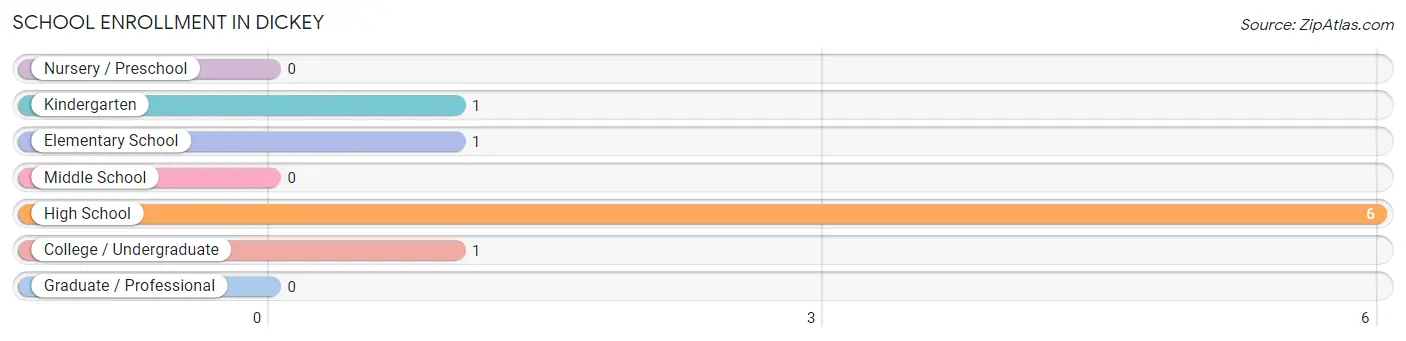
| School Level | # Students | % Students |
| Nursery / Preschool | 0 | 0.0% |
| Kindergarten | 1 | 11.1% |
| Elementary School | 1 | 11.1% |
| Middle School | 0 | 0.0% |
| High School | 6 | 66.7% |
| College / Undergraduate | 1 | 11.1% |
| Graduate / Professional | 0 | 0.0% |
| Total | 9 | 100.0% |
School Enrollment by Age by Funding Source in Dickey
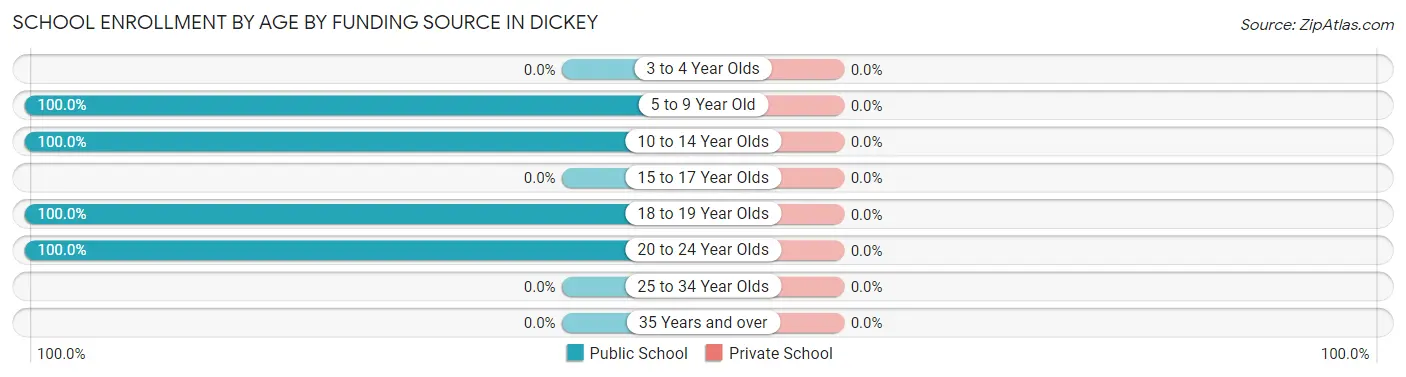
| Age Bracket | Public School | Private School |
| 3 to 4 Year Olds | 0 (0.0%) | 0 (0.0%) |
| 5 to 9 Year Old | 2 (100.0%) | 0 (0.0%) |
| 10 to 14 Year Olds | 3 (100.0%) | 0 (0.0%) |
| 15 to 17 Year Olds | 0 (0.0%) | 0 (0.0%) |
| 18 to 19 Year Olds | 3 (100.0%) | 0 (0.0%) |
| 20 to 24 Year Olds | 1 (100.0%) | 0 (0.0%) |
| 25 to 34 Year Olds | 0 (0.0%) | 0 (0.0%) |
| 35 Years and over | 0 (0.0%) | 0 (0.0%) |
| Total | 9 (100.0%) | 0 (0.0%) |
Educational Attainment by Field of Study in Dickey
Business (16 | 38.1%), education (12 | 28.6%), social sciences (11 | 26.2%), bio, nature & agricultural (2 | 4.8%), and science & technology (1 | 2.4%) are the most common fields of study among 42 individuals in Dickey who have obtained a bachelor's degree or higher.
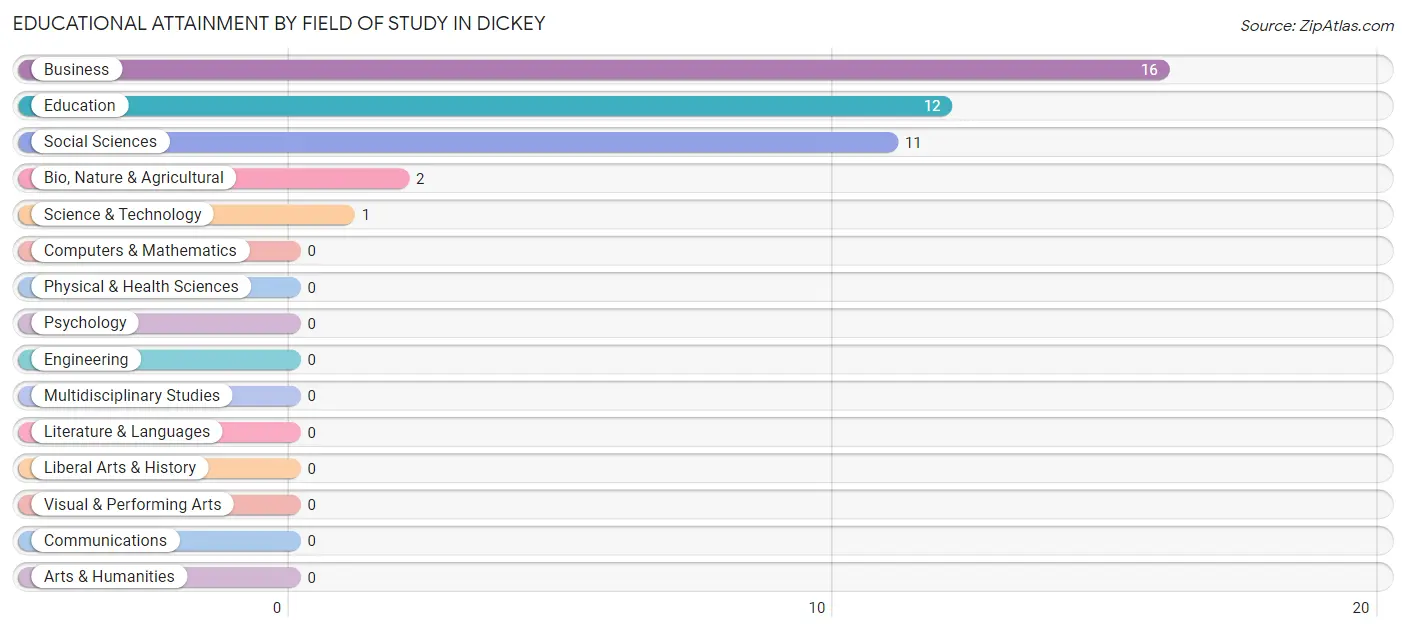
| Field of Study | # Graduates | % Graduates |
| Computers & Mathematics | 0 | 0.0% |
| Bio, Nature & Agricultural | 2 | 4.8% |
| Physical & Health Sciences | 0 | 0.0% |
| Psychology | 0 | 0.0% |
| Social Sciences | 11 | 26.2% |
| Engineering | 0 | 0.0% |
| Multidisciplinary Studies | 0 | 0.0% |
| Science & Technology | 1 | 2.4% |
| Business | 16 | 38.1% |
| Education | 12 | 28.6% |
| Literature & Languages | 0 | 0.0% |
| Liberal Arts & History | 0 | 0.0% |
| Visual & Performing Arts | 0 | 0.0% |
| Communications | 0 | 0.0% |
| Arts & Humanities | 0 | 0.0% |
| Total | 42 | 100.0% |
Transportation & Commute in Dickey
Vehicle Availability by Sex in Dickey
The most prevalent vehicle ownership categories in Dickey are males with 5 or more vehicles (4, accounting for 57.1%) and females with 5 or more vehicles (18, making up 20.0%).
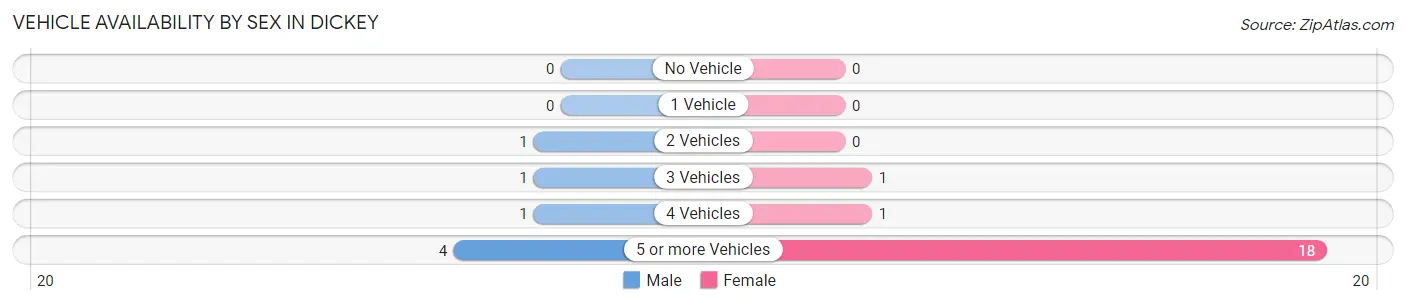
| Vehicles Available | Male | Female |
| No Vehicle | 0 (0.0%) | 0 (0.0%) |
| 1 Vehicle | 0 (0.0%) | 0 (0.0%) |
| 2 Vehicles | 1 (14.3%) | 0 (0.0%) |
| 3 Vehicles | 1 (14.3%) | 1 (5.0%) |
| 4 Vehicles | 1 (14.3%) | 1 (5.0%) |
| 5 or more Vehicles | 4 (57.1%) | 18 (90.0%) |
| Total | 7 (100.0%) | 20 (100.0%) |
Commute Time in Dickey
The most frequently occuring commute durations in Dickey are 15 to 19 minutes (14 commuters, 51.8%), 25 to 29 minutes (4 commuters, 14.8%), and 30 to 34 minutes (4 commuters, 14.8%).
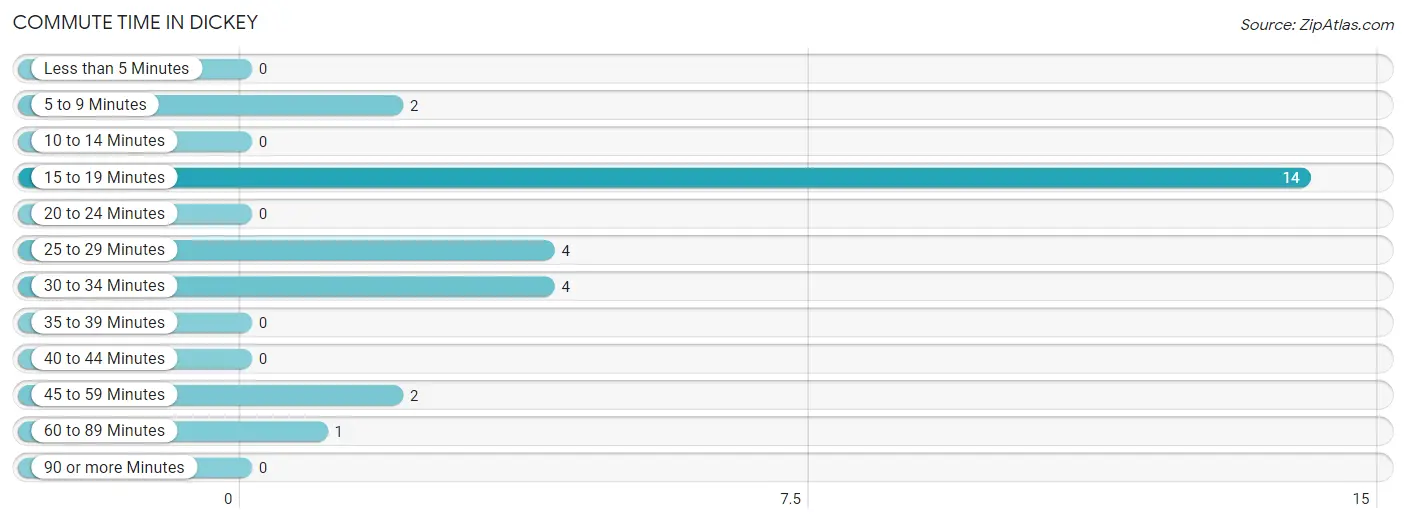
| Commute Time | # Commuters | % Commuters |
| Less than 5 Minutes | 0 | 0.0% |
| 5 to 9 Minutes | 2 | 7.4% |
| 10 to 14 Minutes | 0 | 0.0% |
| 15 to 19 Minutes | 14 | 51.8% |
| 20 to 24 Minutes | 0 | 0.0% |
| 25 to 29 Minutes | 4 | 14.8% |
| 30 to 34 Minutes | 4 | 14.8% |
| 35 to 39 Minutes | 0 | 0.0% |
| 40 to 44 Minutes | 0 | 0.0% |
| 45 to 59 Minutes | 2 | 7.4% |
| 60 to 89 Minutes | 1 | 3.7% |
| 90 or more Minutes | 0 | 0.0% |
Commute Time by Sex in Dickey
The most common commute times in Dickey are 30 to 34 minutes (4 commuters, 57.1%) for males and 15 to 19 minutes (14 commuters, 70.0%) for females.
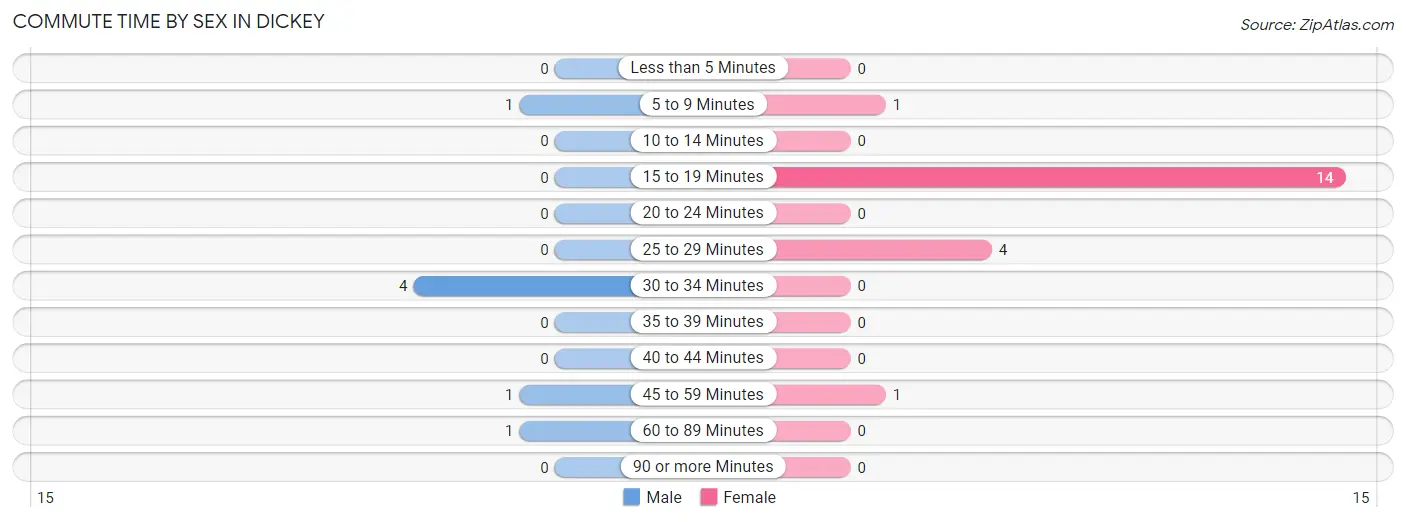
| Commute Time | Male | Female |
| Less than 5 Minutes | 0 (0.0%) | 0 (0.0%) |
| 5 to 9 Minutes | 1 (14.3%) | 1 (5.0%) |
| 10 to 14 Minutes | 0 (0.0%) | 0 (0.0%) |
| 15 to 19 Minutes | 0 (0.0%) | 14 (70.0%) |
| 20 to 24 Minutes | 0 (0.0%) | 0 (0.0%) |
| 25 to 29 Minutes | 0 (0.0%) | 4 (20.0%) |
| 30 to 34 Minutes | 4 (57.1%) | 0 (0.0%) |
| 35 to 39 Minutes | 0 (0.0%) | 0 (0.0%) |
| 40 to 44 Minutes | 0 (0.0%) | 0 (0.0%) |
| 45 to 59 Minutes | 1 (14.3%) | 1 (5.0%) |
| 60 to 89 Minutes | 1 (14.3%) | 0 (0.0%) |
| 90 or more Minutes | 0 (0.0%) | 0 (0.0%) |
Time of Departure to Work by Sex in Dickey
The most frequent times of departure to work in Dickey are 7:00 AM to 7:29 AM (4, 57.1%) for males and 7:00 AM to 7:29 AM (15, 75.0%) for females.
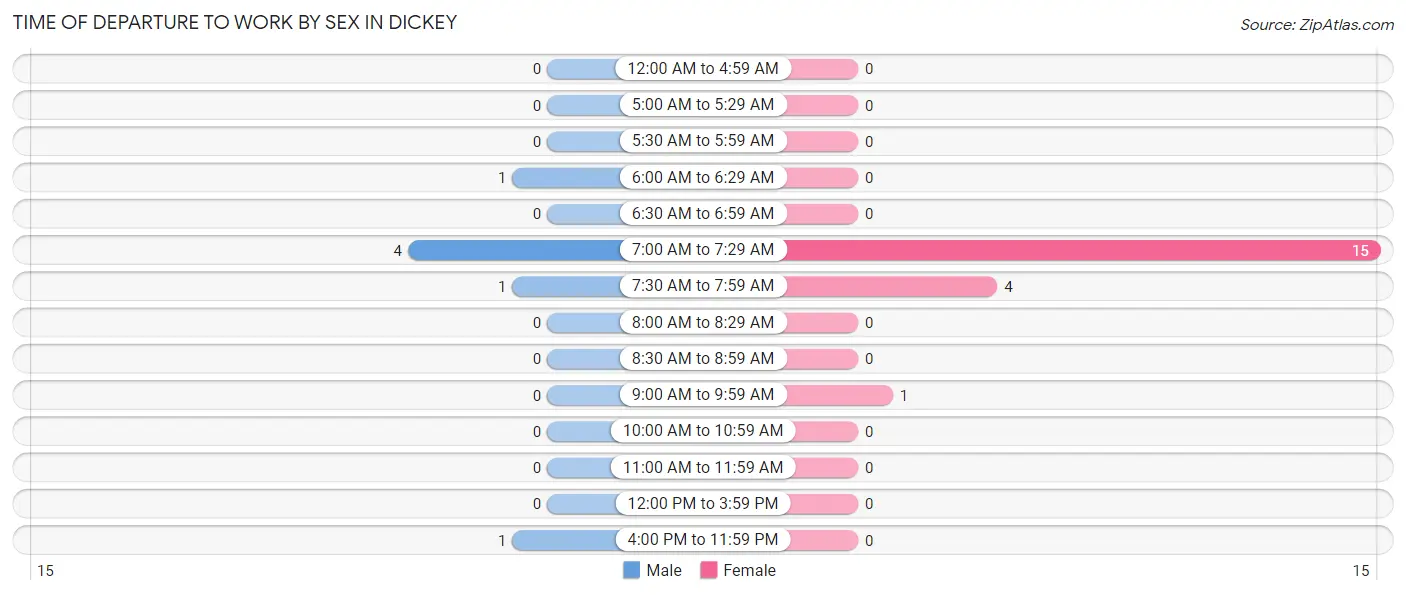
| Time of Departure | Male | Female |
| 12:00 AM to 4:59 AM | 0 (0.0%) | 0 (0.0%) |
| 5:00 AM to 5:29 AM | 0 (0.0%) | 0 (0.0%) |
| 5:30 AM to 5:59 AM | 0 (0.0%) | 0 (0.0%) |
| 6:00 AM to 6:29 AM | 1 (14.3%) | 0 (0.0%) |
| 6:30 AM to 6:59 AM | 0 (0.0%) | 0 (0.0%) |
| 7:00 AM to 7:29 AM | 4 (57.1%) | 15 (75.0%) |
| 7:30 AM to 7:59 AM | 1 (14.3%) | 4 (20.0%) |
| 8:00 AM to 8:29 AM | 0 (0.0%) | 0 (0.0%) |
| 8:30 AM to 8:59 AM | 0 (0.0%) | 0 (0.0%) |
| 9:00 AM to 9:59 AM | 0 (0.0%) | 1 (5.0%) |
| 10:00 AM to 10:59 AM | 0 (0.0%) | 0 (0.0%) |
| 11:00 AM to 11:59 AM | 0 (0.0%) | 0 (0.0%) |
| 12:00 PM to 3:59 PM | 0 (0.0%) | 0 (0.0%) |
| 4:00 PM to 11:59 PM | 1 (14.3%) | 0 (0.0%) |
| Total | 7 (100.0%) | 20 (100.0%) |
Housing Occupancy in Dickey
Occupancy by Ownership in Dickey
Of the total 40 dwellings in Dickey, owner-occupied units account for 36 (90.0%), while renter-occupied units make up 4 (10.0%).
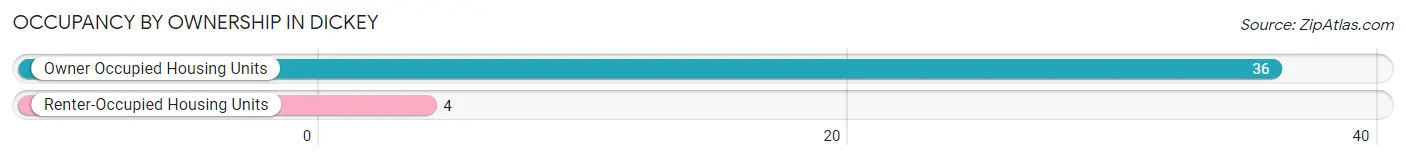
| Occupancy | # Housing Units | % Housing Units |
| Owner Occupied Housing Units | 36 | 90.0% |
| Renter-Occupied Housing Units | 4 | 10.0% |
| Total Occupied Housing Units | 40 | 100.0% |
Occupancy by Household Size in Dickey
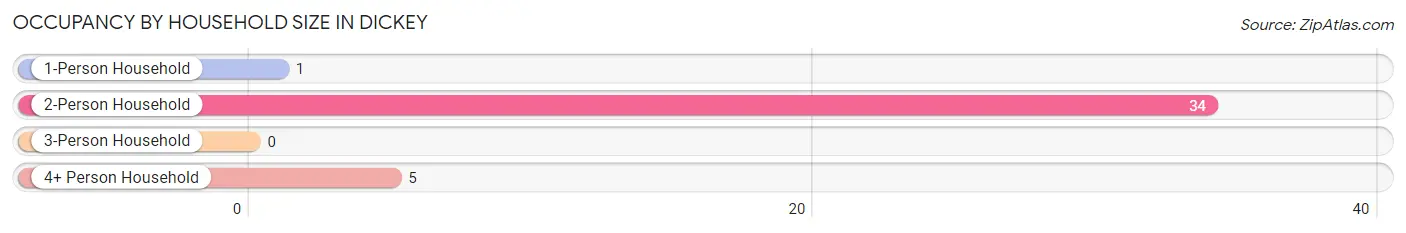
| Household Size | # Housing Units | % Housing Units |
| 1-Person Household | 1 | 2.5% |
| 2-Person Household | 34 | 85.0% |
| 3-Person Household | 0 | 0.0% |
| 4+ Person Household | 5 | 12.5% |
| Total Housing Units | 40 | 100.0% |
Occupancy by Ownership by Household Size in Dickey
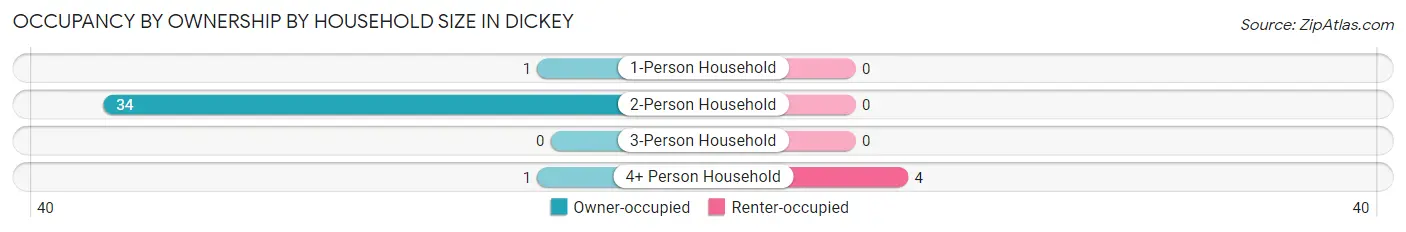
| Household Size | Owner-occupied | Renter-occupied |
| 1-Person Household | 1 (100.0%) | 0 (0.0%) |
| 2-Person Household | 34 (100.0%) | 0 (0.0%) |
| 3-Person Household | 0 (0.0%) | 0 (0.0%) |
| 4+ Person Household | 1 (20.0%) | 4 (80.0%) |
| Total Housing Units | 36 (90.0%) | 4 (10.0%) |
Occupancy by Educational Attainment in Dickey
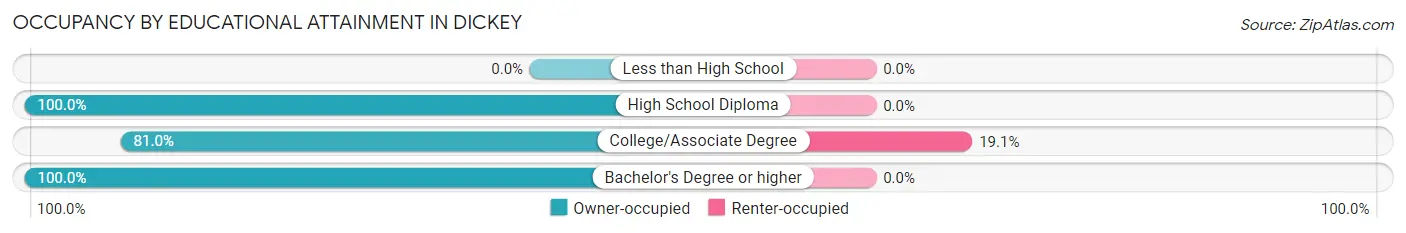
| Household Size | Owner-occupied | Renter-occupied |
| Less than High School | 0 (0.0%) | 0 (0.0%) |
| High School Diploma | 4 (100.0%) | 0 (0.0%) |
| College/Associate Degree | 17 (80.9%) | 4 (19.1%) |
| Bachelor's Degree or higher | 15 (100.0%) | 0 (0.0%) |
Occupancy by Age of Householder in Dickey
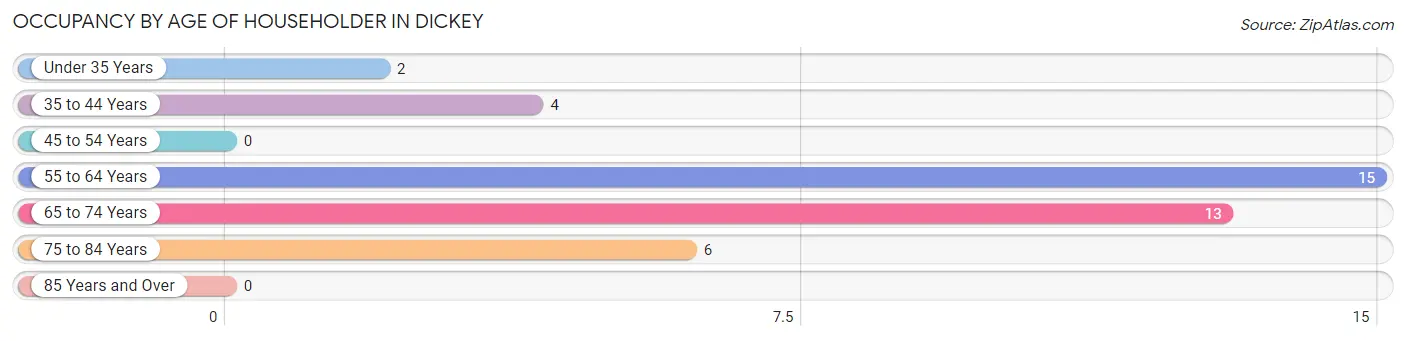
| Age Bracket | # Households | % Households |
| Under 35 Years | 2 | 5.0% |
| 35 to 44 Years | 4 | 10.0% |
| 45 to 54 Years | 0 | 0.0% |
| 55 to 64 Years | 15 | 37.5% |
| 65 to 74 Years | 13 | 32.5% |
| 75 to 84 Years | 6 | 15.0% |
| 85 Years and Over | 0 | 0.0% |
| Total | 40 | 100.0% |
Housing Finances in Dickey
Median Income by Occupancy in Dickey
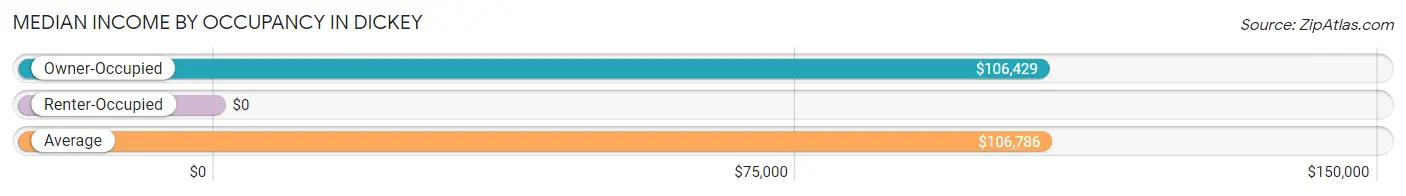
| Occupancy Type | # Households | Median Income |
| Owner-Occupied | 36 (90.0%) | $106,429 |
| Renter-Occupied | 4 (10.0%) | $0 |
| Average | 40 (100.0%) | $106,786 |
Occupancy by Householder Income Bracket in Dickey
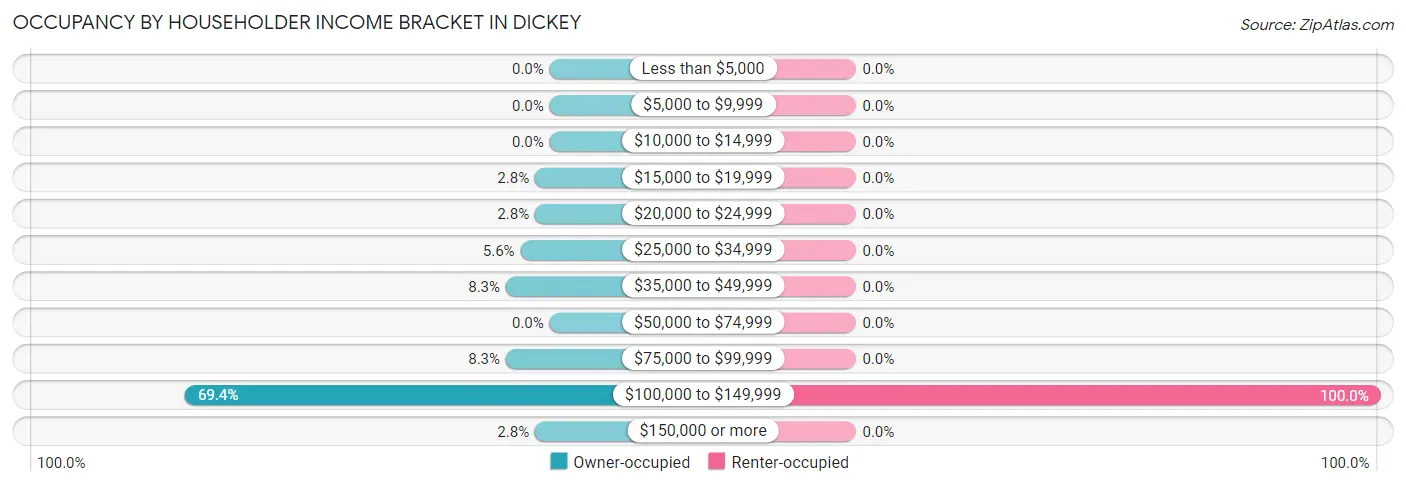
| Income Bracket | Owner-occupied | Renter-occupied |
| Less than $5,000 | 0 (0.0%) | 0 (0.0%) |
| $5,000 to $9,999 | 0 (0.0%) | 0 (0.0%) |
| $10,000 to $14,999 | 0 (0.0%) | 0 (0.0%) |
| $15,000 to $19,999 | 1 (2.8%) | 0 (0.0%) |
| $20,000 to $24,999 | 1 (2.8%) | 0 (0.0%) |
| $25,000 to $34,999 | 2 (5.6%) | 0 (0.0%) |
| $35,000 to $49,999 | 3 (8.3%) | 0 (0.0%) |
| $50,000 to $74,999 | 0 (0.0%) | 0 (0.0%) |
| $75,000 to $99,999 | 3 (8.3%) | 0 (0.0%) |
| $100,000 to $149,999 | 25 (69.4%) | 4 (100.0%) |
| $150,000 or more | 1 (2.8%) | 0 (0.0%) |
| Total | 36 (100.0%) | 4 (100.0%) |
Monthly Housing Cost Tiers in Dickey
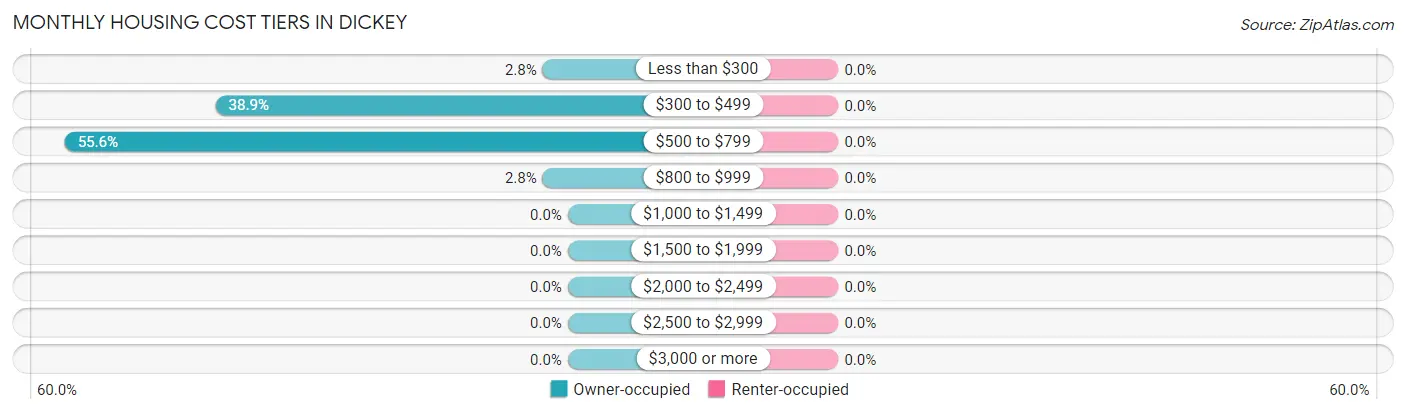
| Monthly Cost | Owner-occupied | Renter-occupied |
| Less than $300 | 1 (2.8%) | 0 (0.0%) |
| $300 to $499 | 14 (38.9%) | 0 (0.0%) |
| $500 to $799 | 20 (55.6%) | 0 (0.0%) |
| $800 to $999 | 1 (2.8%) | 0 (0.0%) |
| $1,000 to $1,499 | 0 (0.0%) | 0 (0.0%) |
| $1,500 to $1,999 | 0 (0.0%) | 0 (0.0%) |
| $2,000 to $2,499 | 0 (0.0%) | 0 (0.0%) |
| $2,500 to $2,999 | 0 (0.0%) | 0 (0.0%) |
| $3,000 or more | 0 (0.0%) | 0 (0.0%) |
| Total | 36 (100.0%) | 4 (100.0%) |
Physical Housing Characteristics in Dickey
Housing Structures in Dickey
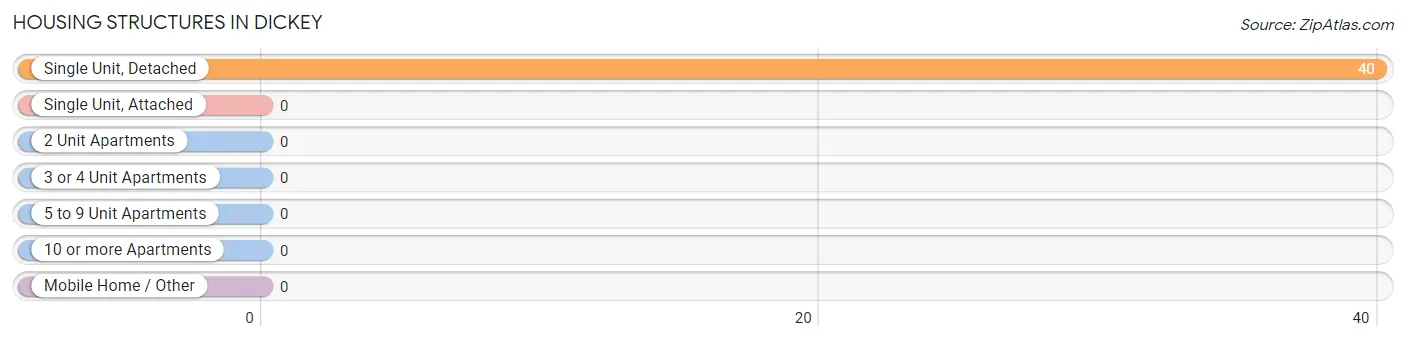
| Structure Type | # Housing Units | % Housing Units |
| Single Unit, Detached | 40 | 100.0% |
| Single Unit, Attached | 0 | 0.0% |
| 2 Unit Apartments | 0 | 0.0% |
| 3 or 4 Unit Apartments | 0 | 0.0% |
| 5 to 9 Unit Apartments | 0 | 0.0% |
| 10 or more Apartments | 0 | 0.0% |
| Mobile Home / Other | 0 | 0.0% |
| Total | 40 | 100.0% |
Housing Structures by Occupancy in Dickey
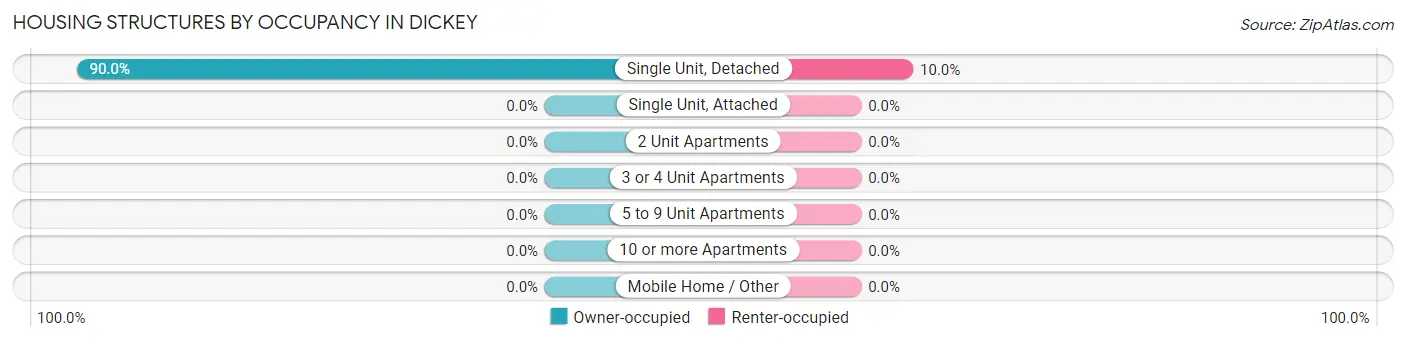
| Structure Type | Owner-occupied | Renter-occupied |
| Single Unit, Detached | 36 (90.0%) | 4 (10.0%) |
| Single Unit, Attached | 0 (0.0%) | 0 (0.0%) |
| 2 Unit Apartments | 0 (0.0%) | 0 (0.0%) |
| 3 or 4 Unit Apartments | 0 (0.0%) | 0 (0.0%) |
| 5 to 9 Unit Apartments | 0 (0.0%) | 0 (0.0%) |
| 10 or more Apartments | 0 (0.0%) | 0 (0.0%) |
| Mobile Home / Other | 0 (0.0%) | 0 (0.0%) |
| Total | 36 (90.0%) | 4 (10.0%) |
Housing Structures by Number of Rooms in Dickey
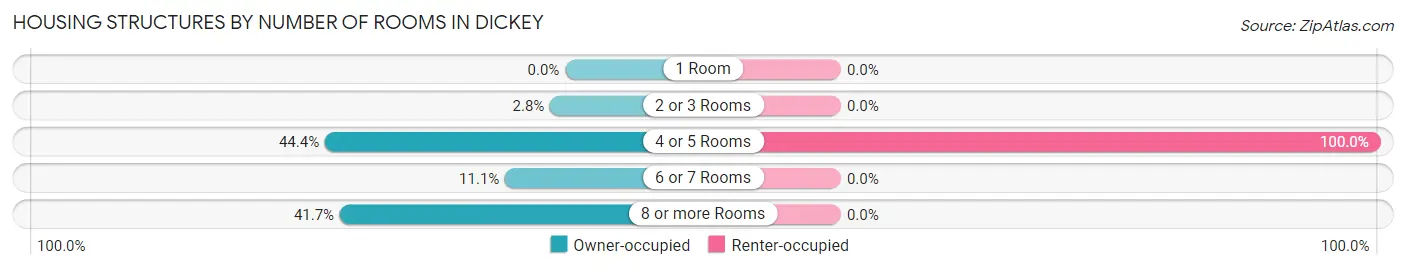
| Number of Rooms | Owner-occupied | Renter-occupied |
| 1 Room | 0 (0.0%) | 0 (0.0%) |
| 2 or 3 Rooms | 1 (2.8%) | 0 (0.0%) |
| 4 or 5 Rooms | 16 (44.4%) | 4 (100.0%) |
| 6 or 7 Rooms | 4 (11.1%) | 0 (0.0%) |
| 8 or more Rooms | 15 (41.7%) | 0 (0.0%) |
| Total | 36 (100.0%) | 4 (100.0%) |
Housing Structure by Heating Type in Dickey
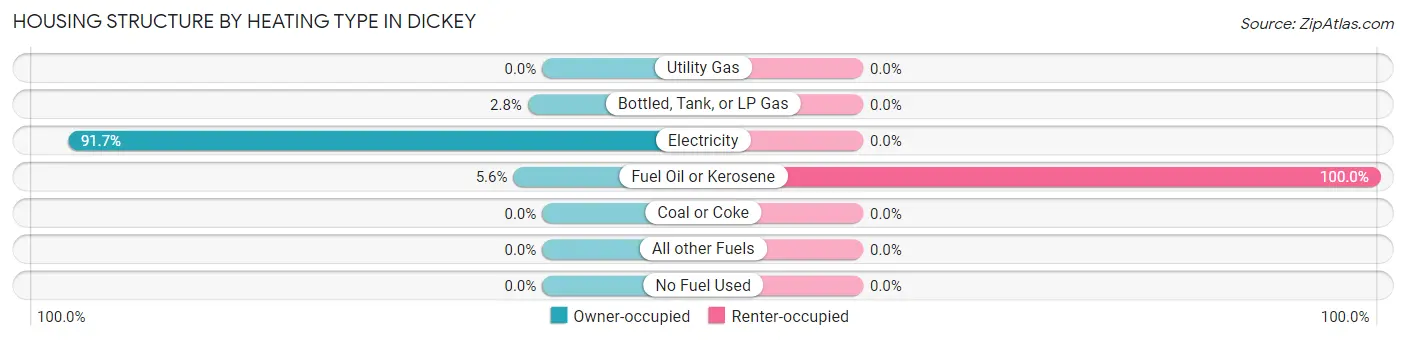
| Heating Type | Owner-occupied | Renter-occupied |
| Utility Gas | 0 (0.0%) | 0 (0.0%) |
| Bottled, Tank, or LP Gas | 1 (2.8%) | 0 (0.0%) |
| Electricity | 33 (91.7%) | 0 (0.0%) |
| Fuel Oil or Kerosene | 2 (5.6%) | 4 (100.0%) |
| Coal or Coke | 0 (0.0%) | 0 (0.0%) |
| All other Fuels | 0 (0.0%) | 0 (0.0%) |
| No Fuel Used | 0 (0.0%) | 0 (0.0%) |
| Total | 36 (100.0%) | 4 (100.0%) |
Household Vehicle Usage in Dickey
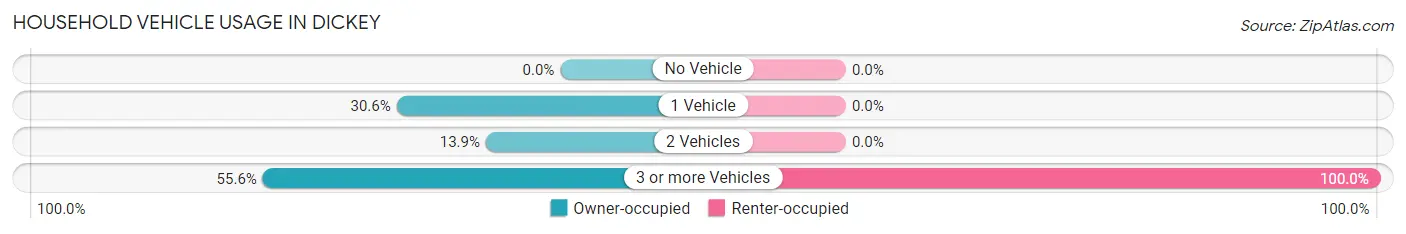
| Vehicles per Household | Owner-occupied | Renter-occupied |
| No Vehicle | 0 (0.0%) | 0 (0.0%) |
| 1 Vehicle | 11 (30.6%) | 0 (0.0%) |
| 2 Vehicles | 5 (13.9%) | 0 (0.0%) |
| 3 or more Vehicles | 20 (55.6%) | 4 (100.0%) |
| Total | 36 (100.0%) | 4 (100.0%) |
Real Estate & Mortgages in Dickey
Real Estate and Mortgage Overview in Dickey
| Characteristic | Without Mortgage | With Mortgage |
| Housing Units | 36 | 0 |
| Median Property Value | $187,500 | $0 |
| Median Household Income | $106,429 | $0 |
| Monthly Housing Costs | $706 | $0 |
| Real Estate Taxes | $1,341 | $0 |
Property Value by Mortgage Status in Dickey
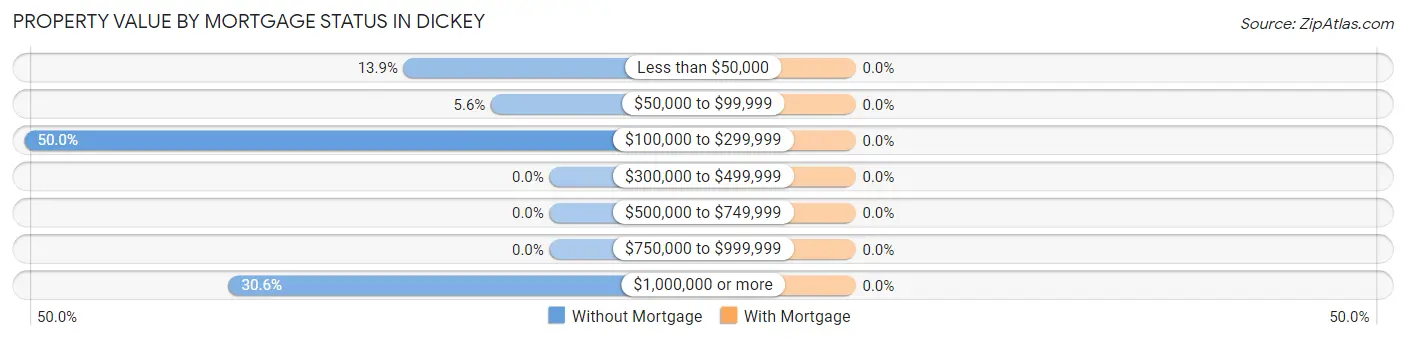
| Property Value | Without Mortgage | With Mortgage |
| Less than $50,000 | 5 (13.9%) | 0 (0.0%) |
| $50,000 to $99,999 | 2 (5.6%) | 0 (0.0%) |
| $100,000 to $299,999 | 18 (50.0%) | 0 (0.0%) |
| $300,000 to $499,999 | 0 (0.0%) | 0 (0.0%) |
| $500,000 to $749,999 | 0 (0.0%) | 0 (0.0%) |
| $750,000 to $999,999 | 0 (0.0%) | 0 (0.0%) |
| $1,000,000 or more | 11 (30.6%) | 0 (0.0%) |
| Total | 36 (100.0%) | 0 (0.0%) |
Household Income by Mortgage Status in Dickey
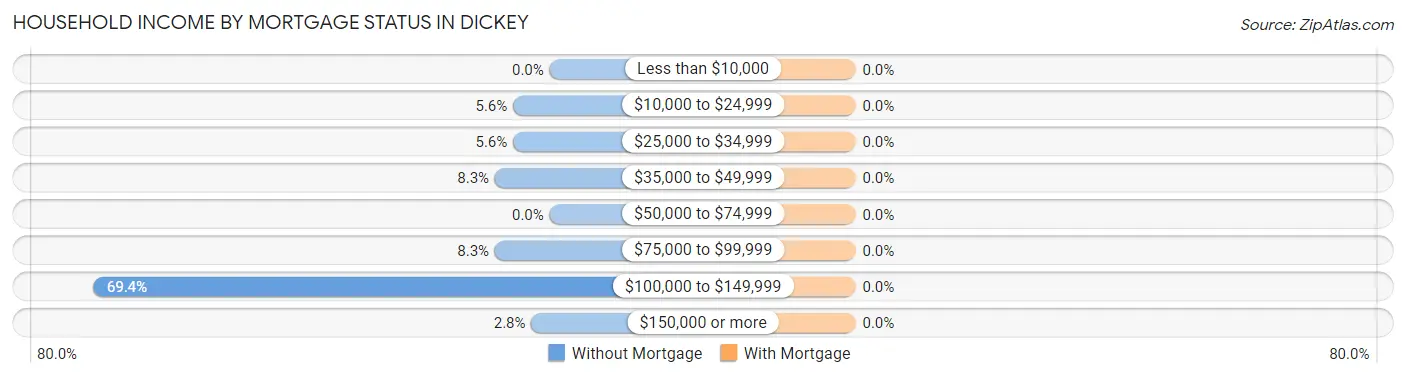
| Household Income | Without Mortgage | With Mortgage |
| Less than $10,000 | 0 (0.0%) | 0 (0.0%) |
| $10,000 to $24,999 | 2 (5.6%) | 0 (0.0%) |
| $25,000 to $34,999 | 2 (5.6%) | 0 (0.0%) |
| $35,000 to $49,999 | 3 (8.3%) | 0 (0.0%) |
| $50,000 to $74,999 | 0 (0.0%) | 0 (0.0%) |
| $75,000 to $99,999 | 3 (8.3%) | 0 (0.0%) |
| $100,000 to $149,999 | 25 (69.4%) | 0 (0.0%) |
| $150,000 or more | 1 (2.8%) | 0 (0.0%) |
| Total | 36 (100.0%) | 0 (0.0%) |
Property Value to Household Income Ratio in Dickey
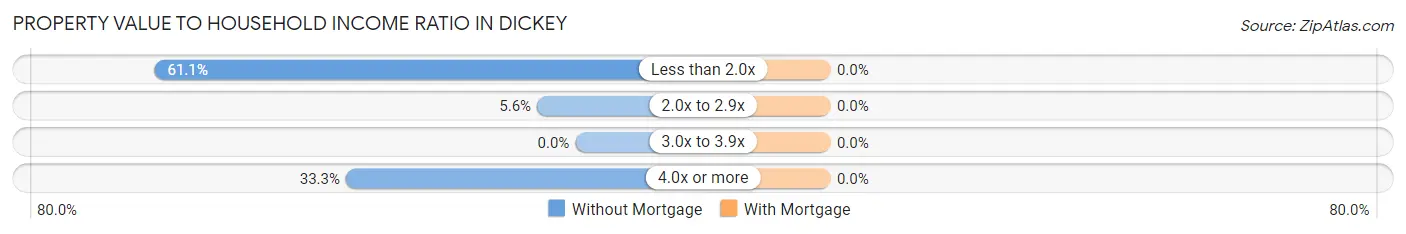
| Value-to-Income Ratio | Without Mortgage | With Mortgage |
| Less than 2.0x | 22 (61.1%) | 0 (0.0%) |
| 2.0x to 2.9x | 2 (5.6%) | 0 (0.0%) |
| 3.0x to 3.9x | 0 (0.0%) | 0 (0.0%) |
| 4.0x or more | 12 (33.3%) | 0 (0.0%) |
| Total | 36 (100.0%) | 0 (0.0%) |
Real Estate Taxes by Mortgage Status in Dickey
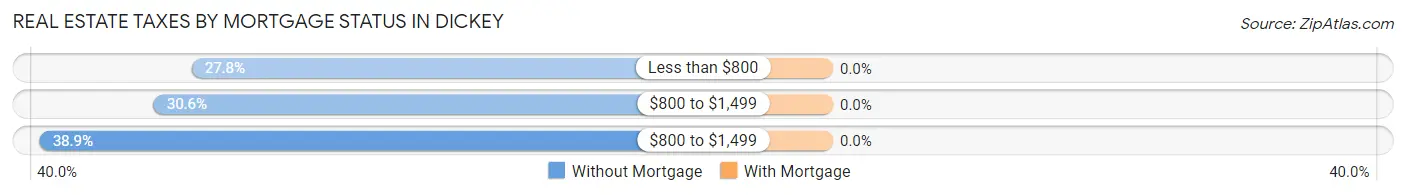
| Property Taxes | Without Mortgage | With Mortgage |
| Less than $800 | 10 (27.8%) | 0 (0.0%) |
| $800 to $1,499 | 11 (30.6%) | 0 (0.0%) |
| $800 to $1,499 | 14 (38.9%) | 0 (0.0%) |
| Total | 36 (100.0%) | 0 (0.0%) |
Health & Disability in Dickey
Health Insurance Coverage by Age in Dickey
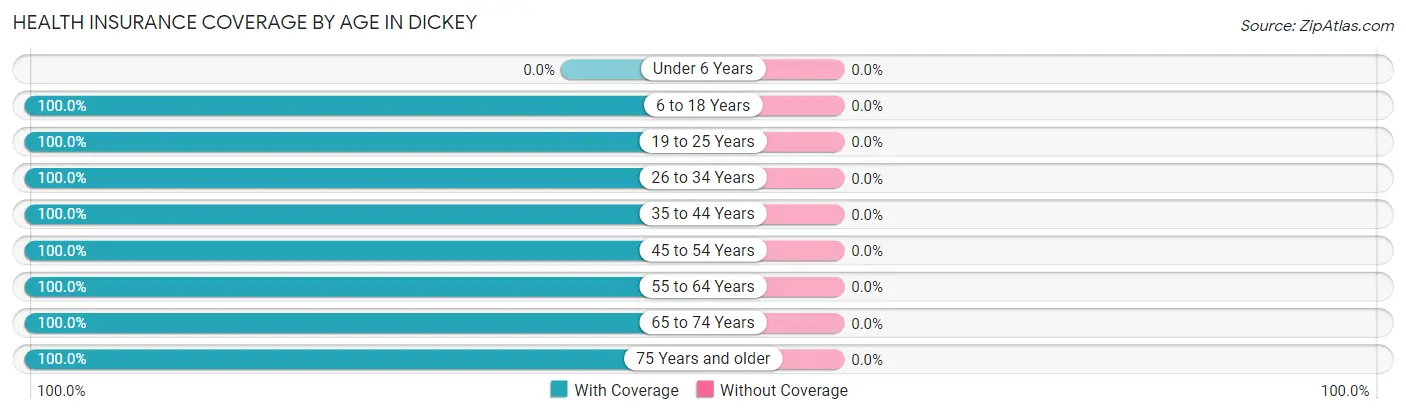
| Age Bracket | With Coverage | Without Coverage |
| Under 6 Years | 0 (0.0%) | 0 (0.0%) |
| 6 to 18 Years | 8 (100.0%) | 0 (0.0%) |
| 19 to 25 Years | 2 (100.0%) | 0 (0.0%) |
| 26 to 34 Years | 1 (100.0%) | 0 (0.0%) |
| 35 to 44 Years | 5 (100.0%) | 0 (0.0%) |
| 45 to 54 Years | 4 (100.0%) | 0 (0.0%) |
| 55 to 64 Years | 27 (100.0%) | 0 (0.0%) |
| 65 to 74 Years | 32 (100.0%) | 0 (0.0%) |
| 75 Years and older | 10 (100.0%) | 0 (0.0%) |
| Total | 89 (100.0%) | 0 (0.0%) |
Health Insurance Coverage by Citizenship Status in Dickey
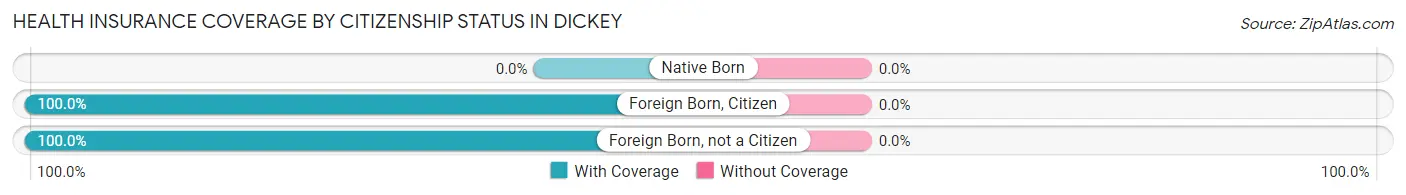
| Citizenship Status | With Coverage | Without Coverage |
| Native Born | 0 (0.0%) | 0 (0.0%) |
| Foreign Born, Citizen | 8 (100.0%) | 0 (0.0%) |
| Foreign Born, not a Citizen | 2 (100.0%) | 0 (0.0%) |
Health Insurance Coverage by Household Income in Dickey
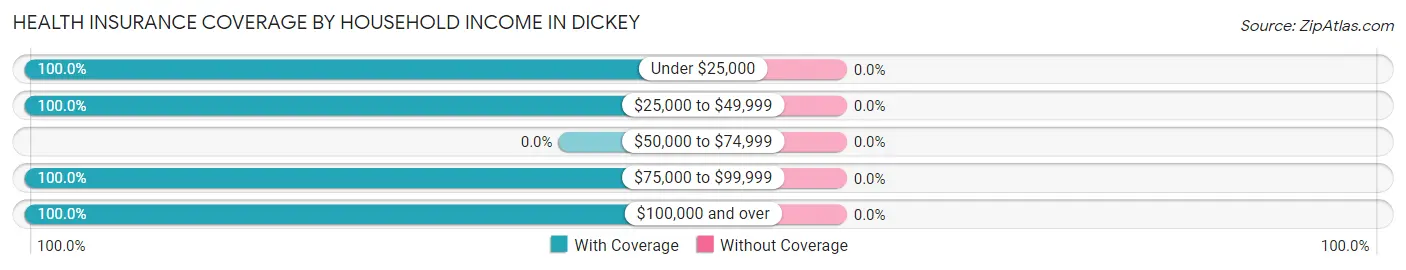
| Household Income | With Coverage | Without Coverage |
| Under $25,000 | 4 (100.0%) | 0 (0.0%) |
| $25,000 to $49,999 | 8 (100.0%) | 0 (0.0%) |
| $50,000 to $74,999 | 0 (0.0%) | 0 (0.0%) |
| $75,000 to $99,999 | 7 (100.0%) | 0 (0.0%) |
| $100,000 and over | 70 (100.0%) | 0 (0.0%) |
Public vs Private Health Insurance Coverage by Age in Dickey
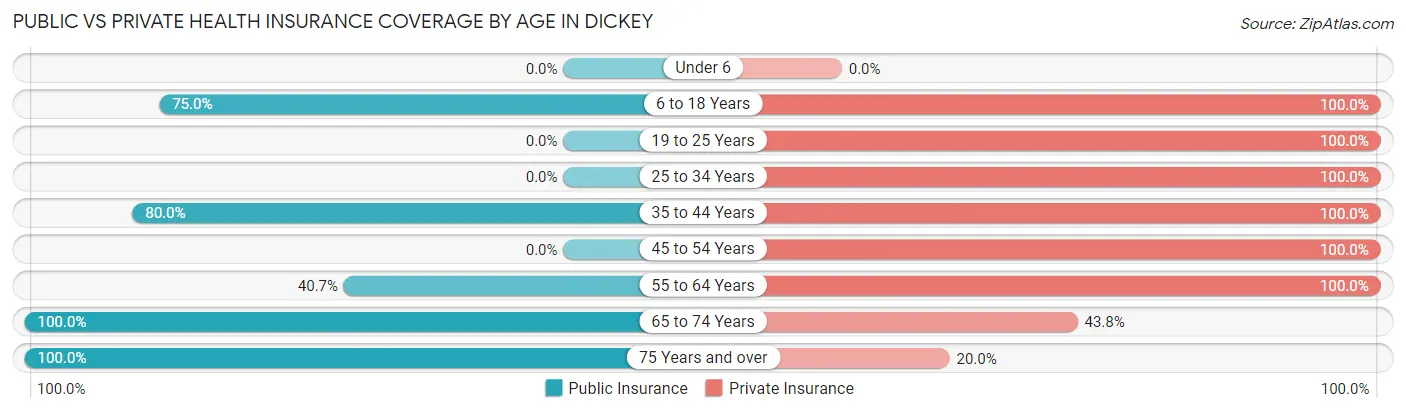
| Age Bracket | Public Insurance | Private Insurance |
| Under 6 | 0 (0.0%) | 0 (0.0%) |
| 6 to 18 Years | 6 (75.0%) | 8 (100.0%) |
| 19 to 25 Years | 0 (0.0%) | 2 (100.0%) |
| 25 to 34 Years | 0 (0.0%) | 1 (100.0%) |
| 35 to 44 Years | 4 (80.0%) | 5 (100.0%) |
| 45 to 54 Years | 0 (0.0%) | 4 (100.0%) |
| 55 to 64 Years | 11 (40.7%) | 27 (100.0%) |
| 65 to 74 Years | 32 (100.0%) | 14 (43.8%) |
| 75 Years and over | 10 (100.0%) | 2 (20.0%) |
| Total | 63 (70.8%) | 63 (70.8%) |
Disability Status by Sex by Age in Dickey
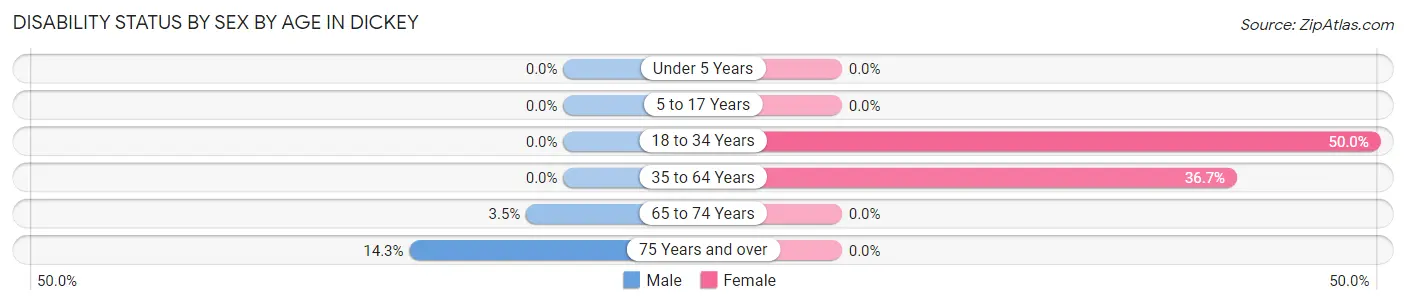
| Age Bracket | Male | Female |
| Under 5 Years | 0 (0.0%) | 0 (0.0%) |
| 5 to 17 Years | 0 (0.0%) | 0 (0.0%) |
| 18 to 34 Years | 0 (0.0%) | 1 (50.0%) |
| 35 to 64 Years | 0 (0.0%) | 11 (36.7%) |
| 65 to 74 Years | 1 (3.5%) | 0 (0.0%) |
| 75 Years and over | 1 (14.3%) | 0 (0.0%) |
Disability Class by Sex by Age in Dickey
Disability Class: Hearing Difficulty
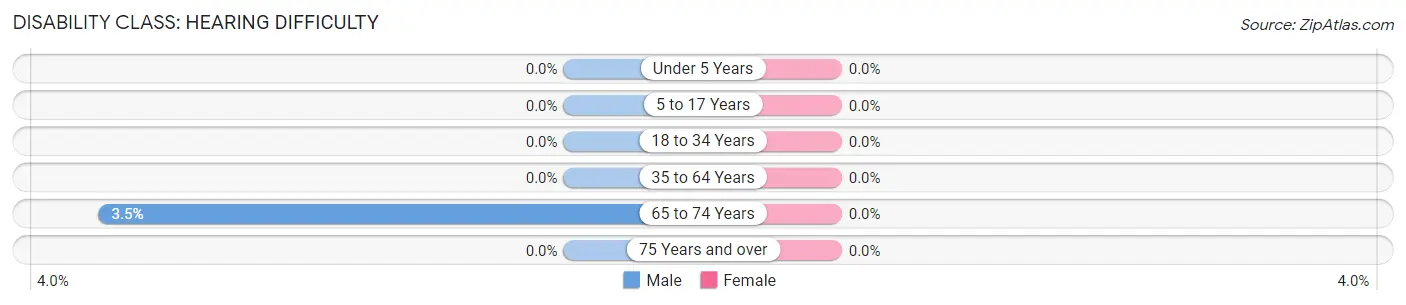
| Age Bracket | Male | Female |
| Under 5 Years | 0 (0.0%) | 0 (0.0%) |
| 5 to 17 Years | 0 (0.0%) | 0 (0.0%) |
| 18 to 34 Years | 0 (0.0%) | 0 (0.0%) |
| 35 to 64 Years | 0 (0.0%) | 0 (0.0%) |
| 65 to 74 Years | 1 (3.5%) | 0 (0.0%) |
| 75 Years and over | 0 (0.0%) | 0 (0.0%) |
Disability Class: Vision Difficulty
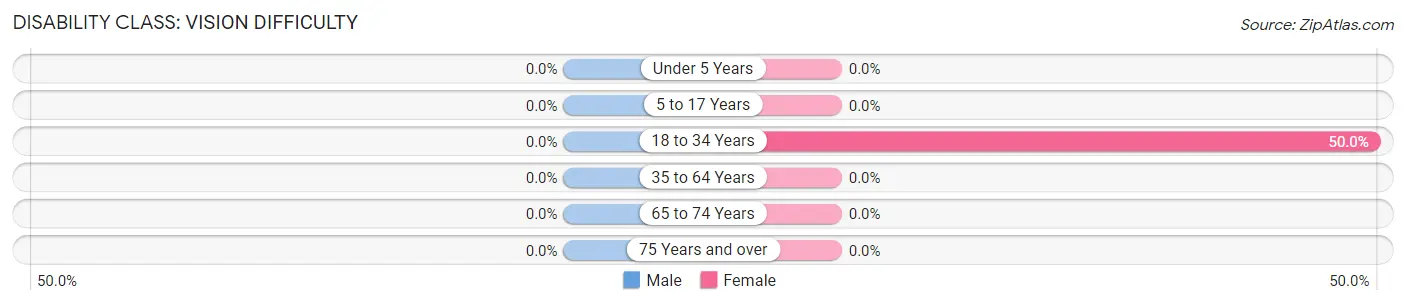
| Age Bracket | Male | Female |
| Under 5 Years | 0 (0.0%) | 0 (0.0%) |
| 5 to 17 Years | 0 (0.0%) | 0 (0.0%) |
| 18 to 34 Years | 0 (0.0%) | 1 (50.0%) |
| 35 to 64 Years | 0 (0.0%) | 0 (0.0%) |
| 65 to 74 Years | 0 (0.0%) | 0 (0.0%) |
| 75 Years and over | 0 (0.0%) | 0 (0.0%) |
Disability Class: Cognitive Difficulty
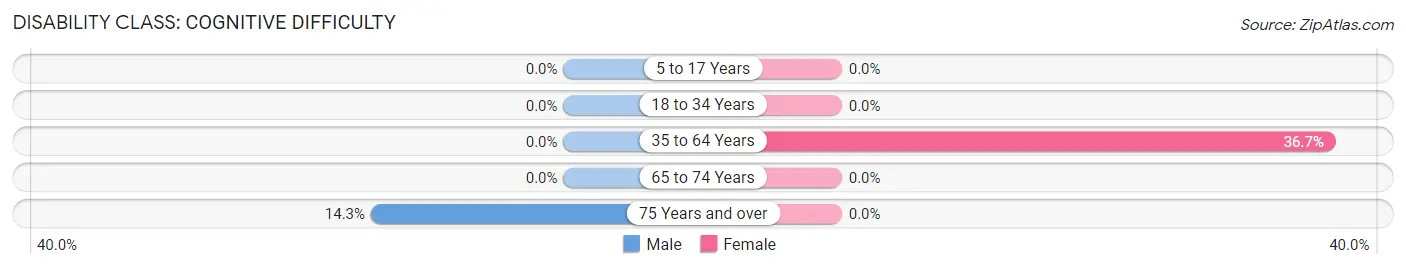
| Age Bracket | Male | Female |
| 5 to 17 Years | 0 (0.0%) | 0 (0.0%) |
| 18 to 34 Years | 0 (0.0%) | 0 (0.0%) |
| 35 to 64 Years | 0 (0.0%) | 11 (36.7%) |
| 65 to 74 Years | 0 (0.0%) | 0 (0.0%) |
| 75 Years and over | 1 (14.3%) | 0 (0.0%) |
Disability Class: Ambulatory Difficulty
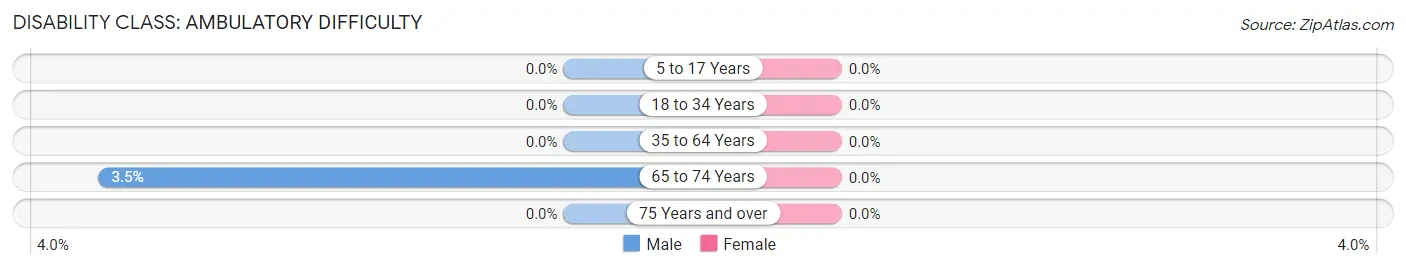
| Age Bracket | Male | Female |
| 5 to 17 Years | 0 (0.0%) | 0 (0.0%) |
| 18 to 34 Years | 0 (0.0%) | 0 (0.0%) |
| 35 to 64 Years | 0 (0.0%) | 0 (0.0%) |
| 65 to 74 Years | 1 (3.5%) | 0 (0.0%) |
| 75 Years and over | 0 (0.0%) | 0 (0.0%) |
Disability Class: Self-Care Difficulty
| Age Bracket | Male | Female |
| 5 to 17 Years | 0 (0.0%) | 0 (0.0%) |
| 18 to 34 Years | 0 (0.0%) | 0 (0.0%) |
| 35 to 64 Years | 0 (0.0%) | 0 (0.0%) |
| 65 to 74 Years | 0 (0.0%) | 0 (0.0%) |
| 75 Years and over | 0 (0.0%) | 0 (0.0%) |
Technology Access in Dickey
Computing Device Access in Dickey
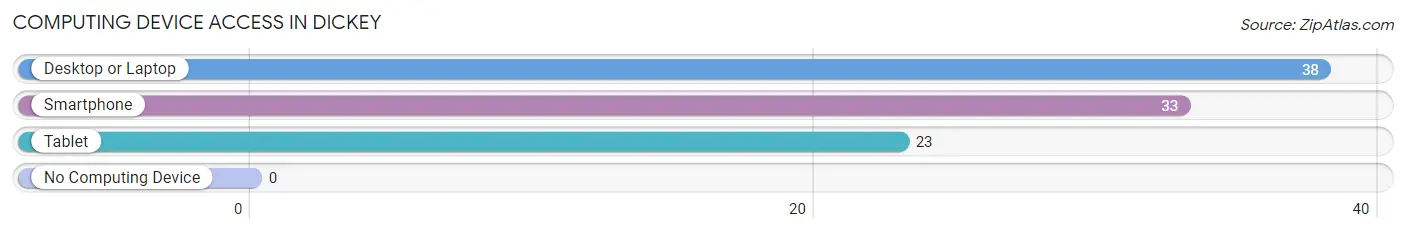
| Device Type | # Households | % Households |
| Desktop or Laptop | 38 | 95.0% |
| Smartphone | 33 | 82.5% |
| Tablet | 23 | 57.5% |
| No Computing Device | 0 | 0.0% |
| Total | 40 | 100.0% |
Internet Access in Dickey
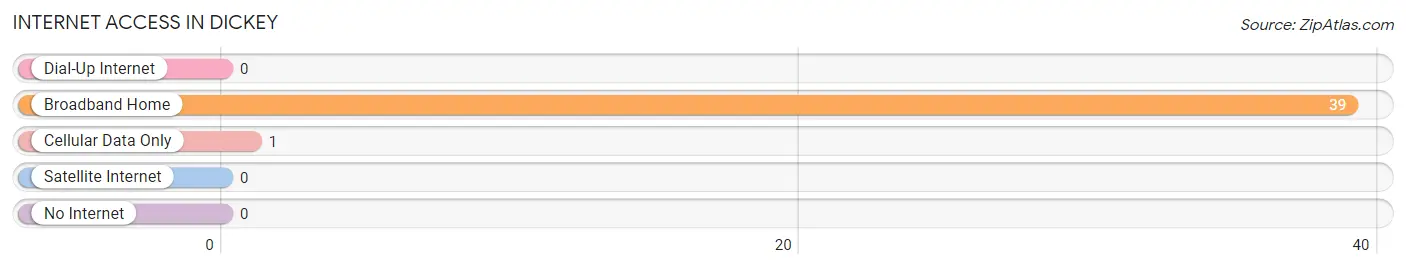
| Internet Type | # Households | % Households |
| Dial-Up Internet | 0 | 0.0% |
| Broadband Home | 39 | 97.5% |
| Cellular Data Only | 1 | 2.5% |
| Satellite Internet | 0 | 0.0% |
| No Internet | 0 | 0.0% |
| Total | 40 | 100.0% |
Dickey Summary
North Dakota is a state located in the Midwestern and Great Plains regions of the United States. It is bordered by Minnesota to the east, South Dakota to the south, Montana to the west, and the Canadian provinces of Saskatchewan and Manitoba to the north. North Dakota is the 19th-most extensive but the 4th-least populous and the 4th-least densely populated of the 50 United States. The state capital is Bismarck, and the largest city is Fargo.
History
The area that is now North Dakota has been inhabited for thousands of years by various Native American tribes. The first Europeans to explore the area were French fur traders, who arrived in the late 17th century. The area became part of the United States in 1803 as part of the Louisiana Purchase. In 1861, the Dakota Territory was created, which included the present-day states of North and South Dakota. The territory was divided in 1889, and North Dakota became a state on November 2, 1889.
Geography
North Dakota is located in the Upper Midwest region of the United States. It is bordered by Minnesota to the east, South Dakota to the south, Montana to the west, and the Canadian provinces of Saskatchewan and Manitoba to the north. The state has an area of 70,762 square miles, making it the 19th-largest state in the country.
The geography of North Dakota is diverse, with the western half of the state consisting of the Great Plains and the eastern half of the state consisting of the Missouri Plateau. The state is divided into three distinct geographic regions: the Great Plains, the Missouri Plateau, and the Red River Valley.
The Great Plains region is characterized by flat, rolling terrain and is home to the state’s largest cities, including Fargo, Bismarck, and Grand Forks. The Missouri Plateau is characterized by rolling hills and is home to the state’s capital, Bismarck. The Red River Valley is a flat, fertile region located in the eastern part of the state and is home to the state’s agricultural industry.
Economy
North Dakota’s economy is largely based on agriculture, energy production, and tourism. Agriculture is the state’s largest industry, accounting for nearly one-third of the state’s total economic output. The state is a major producer of wheat, barley, oats, corn, and soybeans.
Energy production is the state’s second-largest industry, accounting for nearly one-quarter of the state’s total economic output. North Dakota is the second-largest producer of crude oil in the United States, and the state is also a major producer of natural gas, coal, and wind energy.
Tourism is the state’s third-largest industry, accounting for nearly one-tenth of the state’s total economic output. The state is home to numerous national parks, monuments, and historic sites, as well as a variety of outdoor recreational activities.
Demographics
As of 2019, North Dakota had an estimated population of 762,062, making it the 4th-least populous state in the country. The state’s population is largely concentrated in the eastern part of the state, with the largest cities being Fargo, Bismarck, and Grand Forks.
The state’s population is predominantly white (90.2%), with the largest minority groups being American Indian (5.2%), Hispanic (2.2%), and Asian (1.3%). The state’s median household income is $58,945, and the poverty rate is 11.2%.
Common Questions
What is Per Capita Income in Dickey?
Per Capita income in Dickey is $46,040.
What is the Median Family Income in Dickey?
Median Family Income in Dickey is $106,250.
What is the Median Household income in Dickey?
Median Household Income in Dickey is $106,786.
What is Income or Wage Gap in Dickey?
Income or Wage Gap in Dickey is 0.3%.
Women in Dickey earn 99.7 cents for every dollar earned by a man.
What is Inequality or Gini Index in Dickey?
Inequality or Gini Index in Dickey is 0.18.
What is the Total Population of Dickey?
Total Population of Dickey is 89.
What is the Total Male Population of Dickey?
Total Male Population of Dickey is 47.
What is the Total Female Population of Dickey?
Total Female Population of Dickey is 42.
What is the Ratio of Males per 100 Females in Dickey?
There are 111.90 Males per 100 Females in Dickey.
What is the Ratio of Females per 100 Males in Dickey?
There are 89.36 Females per 100 Males in Dickey.
What is the Median Population Age in Dickey?
Median Population Age in Dickey is 64.8 Years.
What is the Average Family Size in Dickey
Average Family Size in Dickey is 2.2 People.
What is the Average Household Size in Dickey
Average Household Size in Dickey is 2.2 People.
How Large is the Labor Force in Dickey?
There are 27 People in the Labor Forcein in Dickey.
What is the Percentage of People in the Labor Force in Dickey?
32.1% of People are in the Labor Force in Dickey.