Frontier, ND Map & Demographics
Frontier Map
Frontier Overview
$56,857
PER CAPITA INCOME
$122,750
AVG FAMILY INCOME
$116,250
AVG HOUSEHOLD INCOME
45.1%
WAGE / INCOME GAP [ % ]
54.9¢/ $1
WAGE / INCOME GAP [ $ ]
0.33
INEQUALITY / GINI INDEX
175
TOTAL POPULATION
84
MALE POPULATION
91
FEMALE POPULATION
92.31
MALES / 100 FEMALES
108.33
FEMALES / 100 MALES
59.0
MEDIAN AGE
2.5
AVG FAMILY SIZE
2.4
AVG HOUSEHOLD SIZE
109
LABOR FORCE [ PEOPLE ]
62.3%
PERCENT IN LABOR FORCE
6.4%
UNEMPLOYMENT RATE
Frontier Area Codes
Income in Frontier
Income Overview in Frontier
Per Capita Income in Frontier is $56,857, while median incomes of families and households are $122,750 and $116,250 respectively.
| Characteristic | Number | Measure |
| Per Capita Income | 175 | $56,857 |
| Median Family Income | 69 | $122,750 |
| Mean Family Income | 69 | $141,428 |
| Median Household Income | 72 | $116,250 |
| Mean Household Income | 72 | $137,865 |
| Income Deficit | 69 | $0 |
| Wage / Income Gap (%) | 175 | 45.10% |
| Wage / Income Gap ($) | 175 | 54.90¢ per $1 |
| Gini / Inequality Index | 175 | 0.33 |
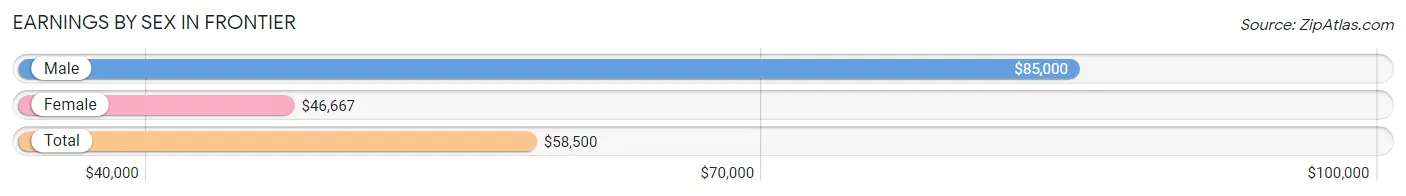
Earnings by Sex in Frontier
Average Earnings in Frontier are $58,500, $85,000 for men and $46,667 for women, a difference of 45.1%.
| Sex | Number | Average Earnings |
| Male | 60 (50.8%) | $85,000 |
| Female | 58 (49.1%) | $46,667 |
| Total | 118 (100.0%) | $58,500 |
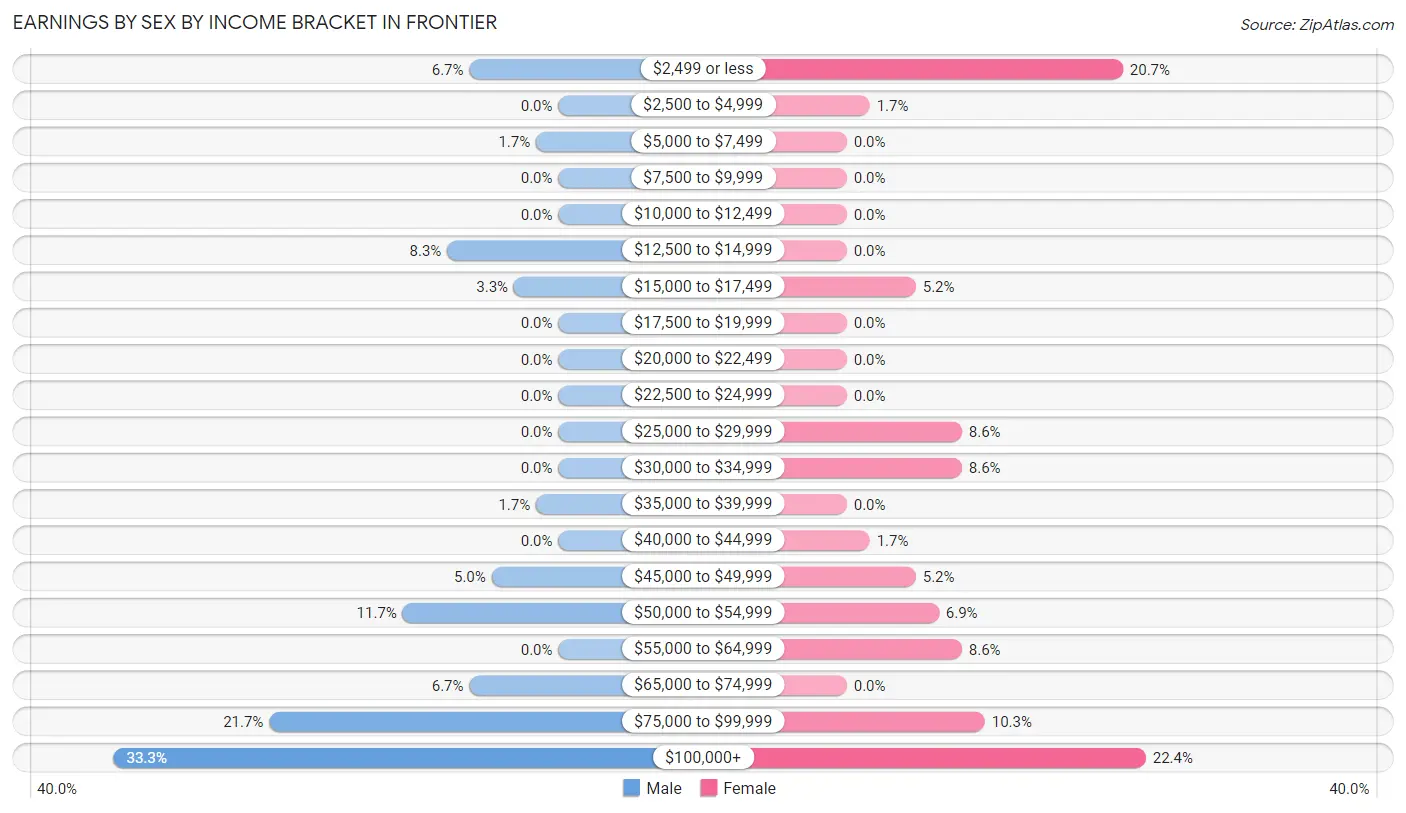
Earnings by Sex by Income Bracket in Frontier
The most common earnings brackets in Frontier are $100,000+ for men (20 | 33.3%) and $100,000+ for women (13 | 22.4%).
| Income | Male | Female |
| $2,499 or less | 4 (6.7%) | 12 (20.7%) |
| $2,500 to $4,999 | 0 (0.0%) | 1 (1.7%) |
| $5,000 to $7,499 | 1 (1.7%) | 0 (0.0%) |
| $7,500 to $9,999 | 0 (0.0%) | 0 (0.0%) |
| $10,000 to $12,499 | 0 (0.0%) | 0 (0.0%) |
| $12,500 to $14,999 | 5 (8.3%) | 0 (0.0%) |
| $15,000 to $17,499 | 2 (3.3%) | 3 (5.2%) |
| $17,500 to $19,999 | 0 (0.0%) | 0 (0.0%) |
| $20,000 to $22,499 | 0 (0.0%) | 0 (0.0%) |
| $22,500 to $24,999 | 0 (0.0%) | 0 (0.0%) |
| $25,000 to $29,999 | 0 (0.0%) | 5 (8.6%) |
| $30,000 to $34,999 | 0 (0.0%) | 5 (8.6%) |
| $35,000 to $39,999 | 1 (1.7%) | 0 (0.0%) |
| $40,000 to $44,999 | 0 (0.0%) | 1 (1.7%) |
| $45,000 to $49,999 | 3 (5.0%) | 3 (5.2%) |
| $50,000 to $54,999 | 7 (11.7%) | 4 (6.9%) |
| $55,000 to $64,999 | 0 (0.0%) | 5 (8.6%) |
| $65,000 to $74,999 | 4 (6.7%) | 0 (0.0%) |
| $75,000 to $99,999 | 13 (21.7%) | 6 (10.3%) |
| $100,000+ | 20 (33.3%) | 13 (22.4%) |
| Total | 60 (100.0%) | 58 (100.0%) |
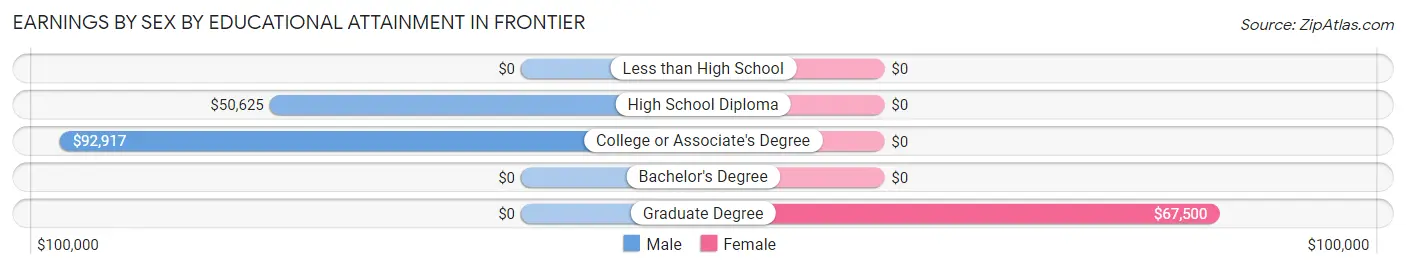
Earnings by Sex by Educational Attainment in Frontier
Average earnings in Frontier are $81,667 for men and $58,250 for women, a difference of 28.7%. Men with an educational attainment of college or associate's degree enjoy the highest average annual earnings of $92,917, while those with high school diploma education earn the least with $50,625. Women with an educational attainment of graduate degree earn the most with the average annual earnings of $67,500, while those with graduate degree education have the smallest earnings of $67,500.
| Educational Attainment | Male Income | Female Income |
| Less than High School | - | - |
| High School Diploma | $50,625 | $0 |
| College or Associate's Degree | $92,917 | $0 |
| Bachelor's Degree | - | - |
| Graduate Degree | - | - |
| Total | $81,667 | $58,250 |
Family Income in Frontier
Family Income Brackets in Frontier
According to the Frontier family income data, there are 24 families falling into the $100,000 to $149,999 income range, which is the most common income bracket and makes up 34.8% of all families.
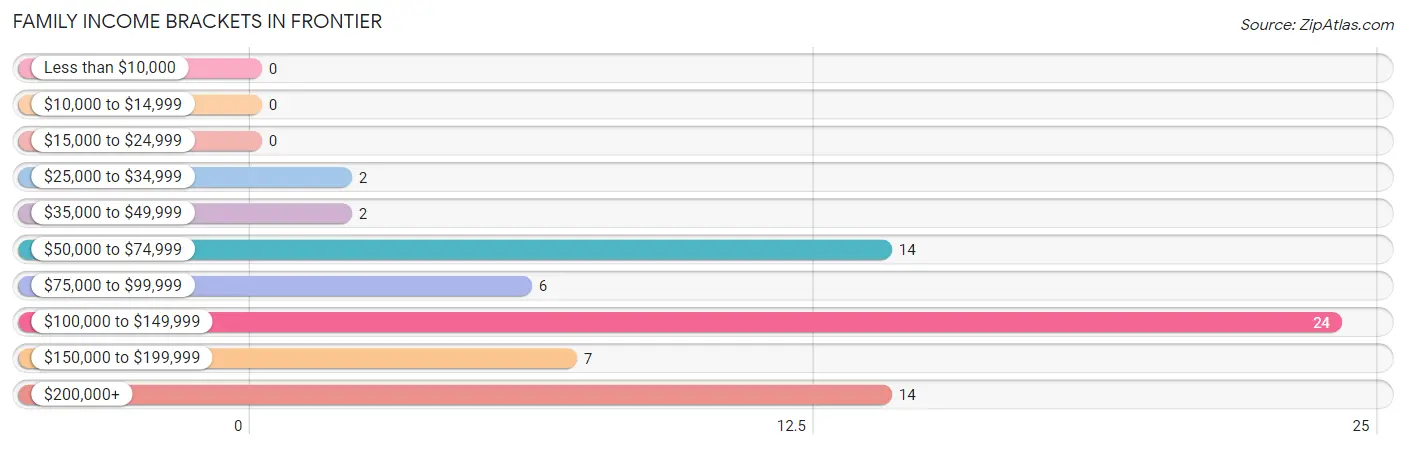
| Income Bracket | # Families | % Families |
| Less than $10,000 | 0 | 0.0% |
| $10,000 to $14,999 | 0 | 0.0% |
| $15,000 to $24,999 | 0 | 0.0% |
| $25,000 to $34,999 | 2 | 2.9% |
| $35,000 to $49,999 | 2 | 2.9% |
| $50,000 to $74,999 | 14 | 20.3% |
| $75,000 to $99,999 | 6 | 8.7% |
| $100,000 to $149,999 | 24 | 34.8% |
| $150,000 to $199,999 | 7 | 10.1% |
| $200,000+ | 14 | 20.3% |
Family Income by Famaliy Size in Frontier
3-person families (10 | 14.5%) account for the highest median family income in Frontier with $141,667 per family, while 2-person families (49 | 71.0%) have the highest median income of $55,625 per family member.
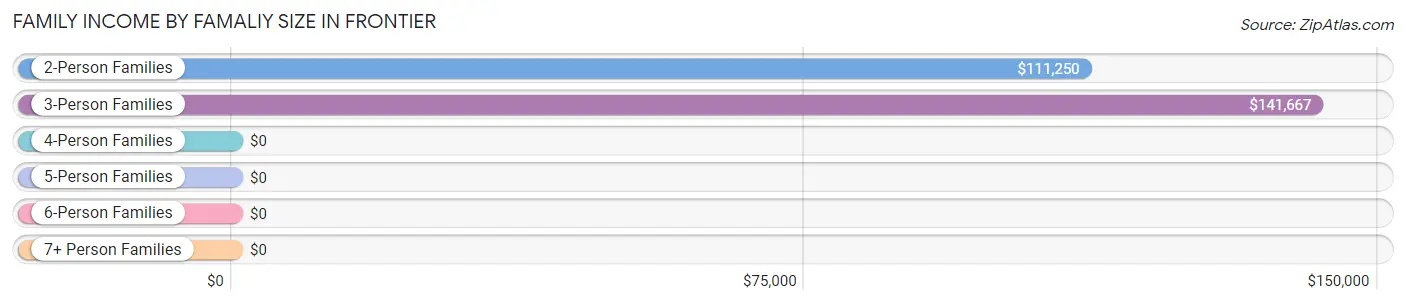
| Income Bracket | # Families | Median Income |
| 2-Person Families | 49 (71.0%) | $111,250 |
| 3-Person Families | 10 (14.5%) | $141,667 |
| 4-Person Families | 10 (14.5%) | $0 |
| 5-Person Families | 0 (0.0%) | $0 |
| 6-Person Families | 0 (0.0%) | $0 |
| 7+ Person Families | 0 (0.0%) | $0 |
| Total | 69 (100.0%) | $122,750 |
Family Income by Number of Earners in Frontier
The median family income in Frontier is $122,750, with families comprising 3+ earners (15) having the highest median family income of $250,001, while families with no earners (18) have the lowest median family income of $64,167, accounting for 21.7% and 26.1% of families, respectively.
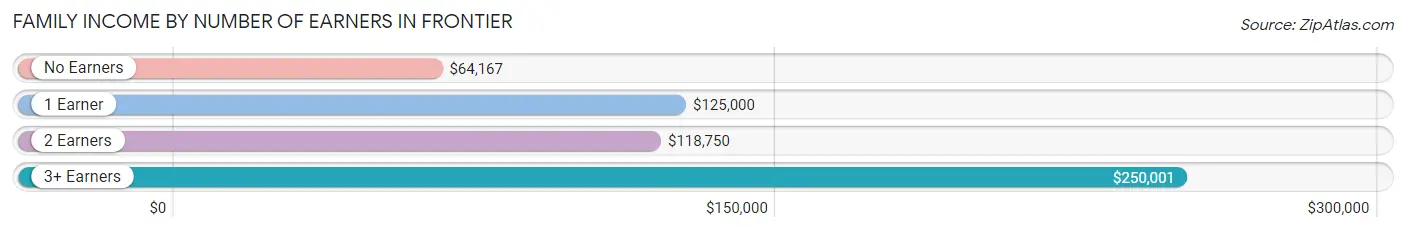
| Number of Earners | # Families | Median Income |
| No Earners | 18 (26.1%) | $64,167 |
| 1 Earner | 8 (11.6%) | $125,000 |
| 2 Earners | 28 (40.6%) | $118,750 |
| 3+ Earners | 15 (21.7%) | $250,001 |
| Total | 69 (100.0%) | $122,750 |
Household Income in Frontier
Household Income Brackets in Frontier
With 25 households falling in the category, the $100,000 to $149,999 income range is the most frequent in Frontier, accounting for 34.7% of all households.
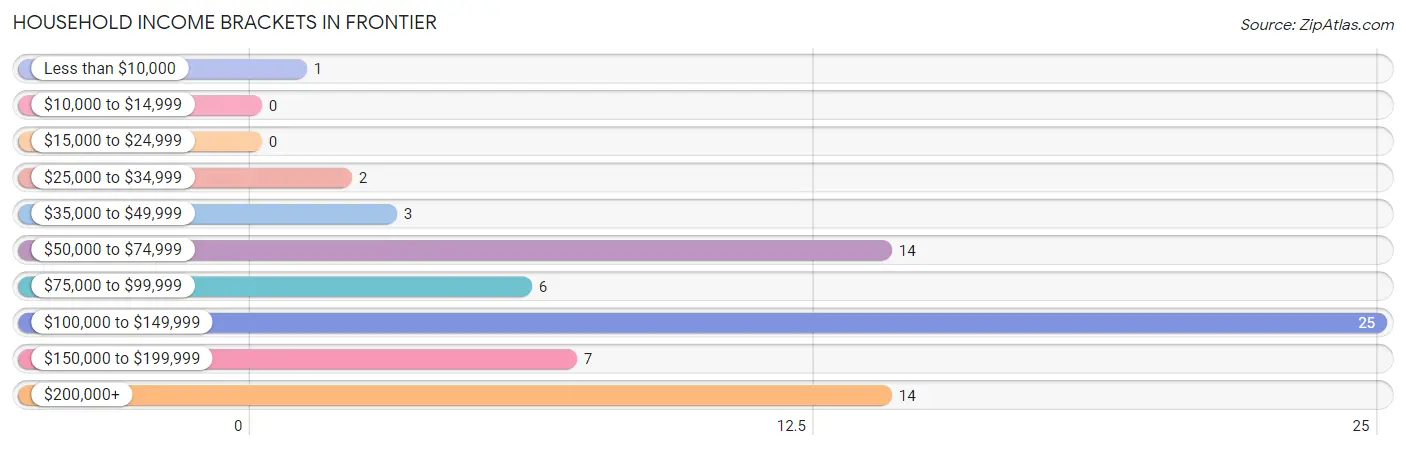
| Income Bracket | # Households | % Households |
| Less than $10,000 | 1 | 1.4% |
| $10,000 to $14,999 | 0 | 0.0% |
| $15,000 to $24,999 | 0 | 0.0% |
| $25,000 to $34,999 | 2 | 2.8% |
| $35,000 to $49,999 | 3 | 4.2% |
| $50,000 to $74,999 | 14 | 19.4% |
| $75,000 to $99,999 | 6 | 8.3% |
| $100,000 to $149,999 | 25 | 34.7% |
| $150,000 to $199,999 | 7 | 9.7% |
| $200,000+ | 14 | 19.4% |
Household Income by Householder Age in Frontier
The median household income in Frontier is $116,250, with the highest median household income of $157,917 found in the 45 to 64 years age bracket for the primary householder. A total of 40 households (55.6%) fall into this category.
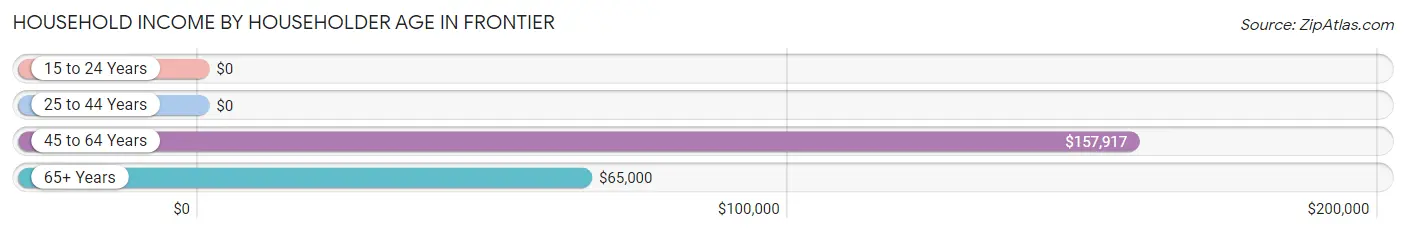
| Income Bracket | # Households | Median Income |
| 15 to 24 Years | 0 (0.0%) | $0 |
| 25 to 44 Years | 6 (8.3%) | $0 |
| 45 to 64 Years | 40 (55.6%) | $157,917 |
| 65+ Years | 26 (36.1%) | $65,000 |
| Total | 72 (100.0%) | $116,250 |
Poverty in Frontier
Income Below Poverty by Sex and Age in Frontier
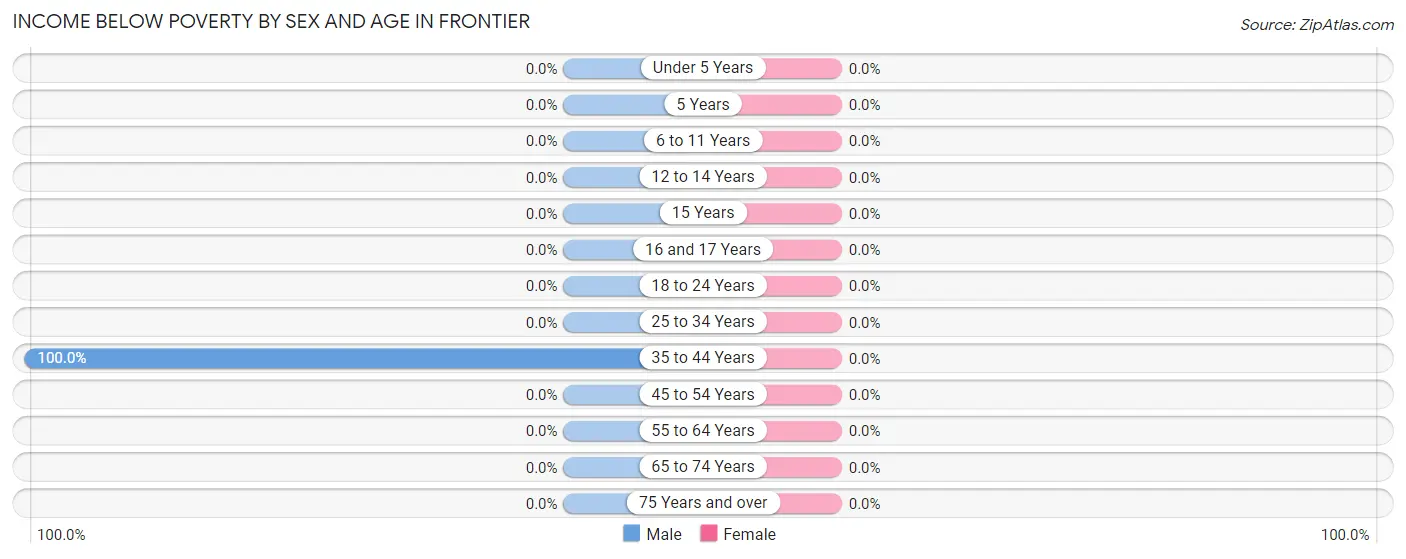
| Age Bracket | Male | Female |
| Under 5 Years | 0 (0.0%) | 0 (0.0%) |
| 5 Years | 0 (0.0%) | 0 (0.0%) |
| 6 to 11 Years | 0 (0.0%) | 0 (0.0%) |
| 12 to 14 Years | 0 (0.0%) | 0 (0.0%) |
| 15 Years | 0 (0.0%) | 0 (0.0%) |
| 16 and 17 Years | 0 (0.0%) | 0 (0.0%) |
| 18 to 24 Years | 0 (0.0%) | 0 (0.0%) |
| 25 to 34 Years | 0 (0.0%) | 0 (0.0%) |
| 35 to 44 Years | 1 (100.0%) | 0 (0.0%) |
| 45 to 54 Years | 0 (0.0%) | 0 (0.0%) |
| 55 to 64 Years | 0 (0.0%) | 0 (0.0%) |
| 65 to 74 Years | 0 (0.0%) | 0 (0.0%) |
| 75 Years and over | 0 (0.0%) | 0 (0.0%) |
| Total | 1 (1.2%) | 0 (0.0%) |
Income Above Poverty by Sex and Age in Frontier
According to the poverty statistics in Frontier, males aged 18 to 24 years and females aged 16 and 17 years are the age groups that are most secure financially, with 100.0% of males and 100.0% of females in these age groups living above the poverty line.
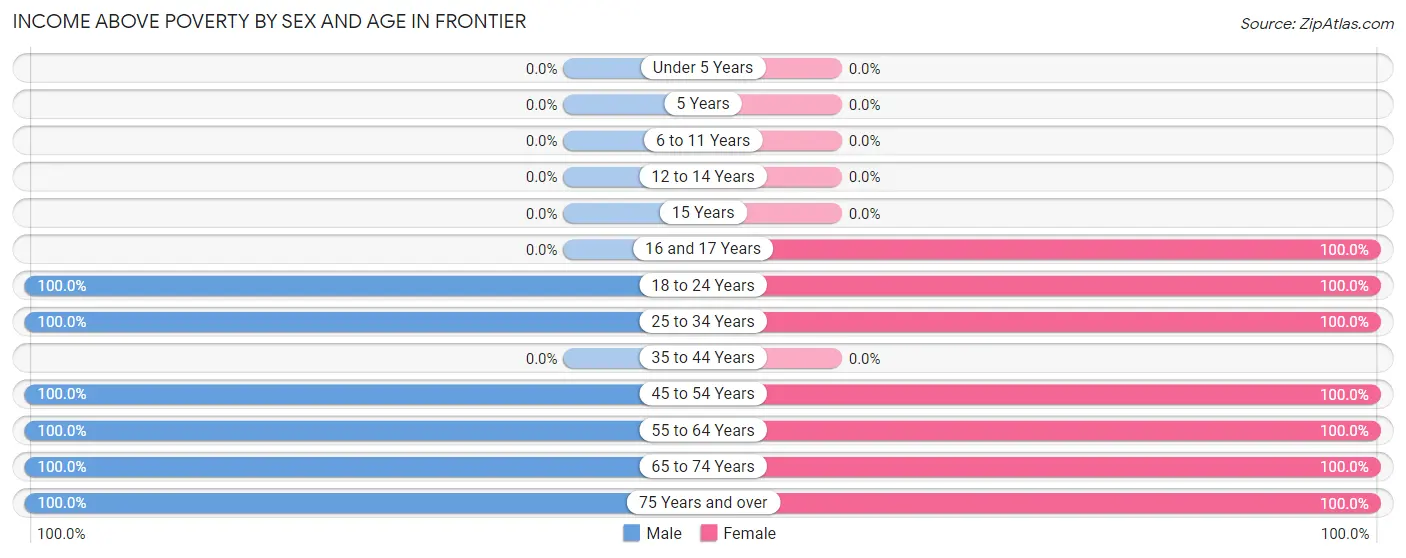
| Age Bracket | Male | Female |
| Under 5 Years | 0 (0.0%) | 0 (0.0%) |
| 5 Years | 0 (0.0%) | 0 (0.0%) |
| 6 to 11 Years | 0 (0.0%) | 0 (0.0%) |
| 12 to 14 Years | 0 (0.0%) | 0 (0.0%) |
| 15 Years | 0 (0.0%) | 0 (0.0%) |
| 16 and 17 Years | 0 (0.0%) | 3 (100.0%) |
| 18 to 24 Years | 12 (100.0%) | 17 (100.0%) |
| 25 to 34 Years | 4 (100.0%) | 5 (100.0%) |
| 35 to 44 Years | 0 (0.0%) | 0 (0.0%) |
| 45 to 54 Years | 21 (100.0%) | 21 (100.0%) |
| 55 to 64 Years | 13 (100.0%) | 20 (100.0%) |
| 65 to 74 Years | 28 (100.0%) | 21 (100.0%) |
| 75 Years and over | 5 (100.0%) | 4 (100.0%) |
| Total | 83 (98.8%) | 91 (100.0%) |
Income Below Poverty Among Married-Couple Families in Frontier
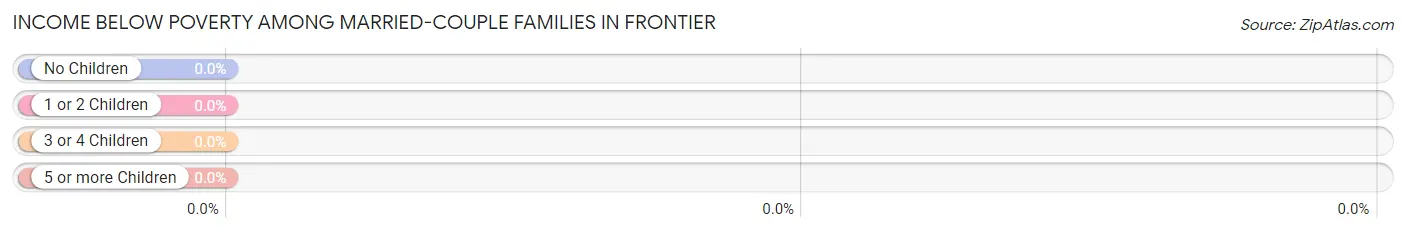
| Children | Above Poverty | Below Poverty |
| No Children | 65 (100.0%) | 0 (0.0%) |
| 1 or 2 Children | 4 (100.0%) | 0 (0.0%) |
| 3 or 4 Children | 0 (0.0%) | 0 (0.0%) |
| 5 or more Children | 0 (0.0%) | 0 (0.0%) |
| Total | 69 (100.0%) | 0 (0.0%) |
Income Below Poverty Among Single-Parent Households in Frontier
| Children | Single Father | Single Mother |
| No Children | 0 (0.0%) | 0 (0.0%) |
| 1 or 2 Children | 0 (0.0%) | 0 (0.0%) |
| 3 or 4 Children | 0 (0.0%) | 0 (0.0%) |
| 5 or more Children | 0 (0.0%) | 0 (0.0%) |
| Total | 0 (0.0%) | 0 (0.0%) |
Income Below Poverty Among Married-Couple vs Single-Parent Households in Frontier
| Children | Married-Couple Families | Single-Parent Households |
| No Children | 0 (0.0%) | 0 (0.0%) |
| 1 or 2 Children | 0 (0.0%) | 0 (0.0%) |
| 3 or 4 Children | 0 (0.0%) | 0 (0.0%) |
| 5 or more Children | 0 (0.0%) | 0 (0.0%) |
| Total | 0 (0.0%) | 0 (0.0%) |
Race in Frontier
The most populous races in Frontier are , and White / Caucasian (175 | 100.0%).
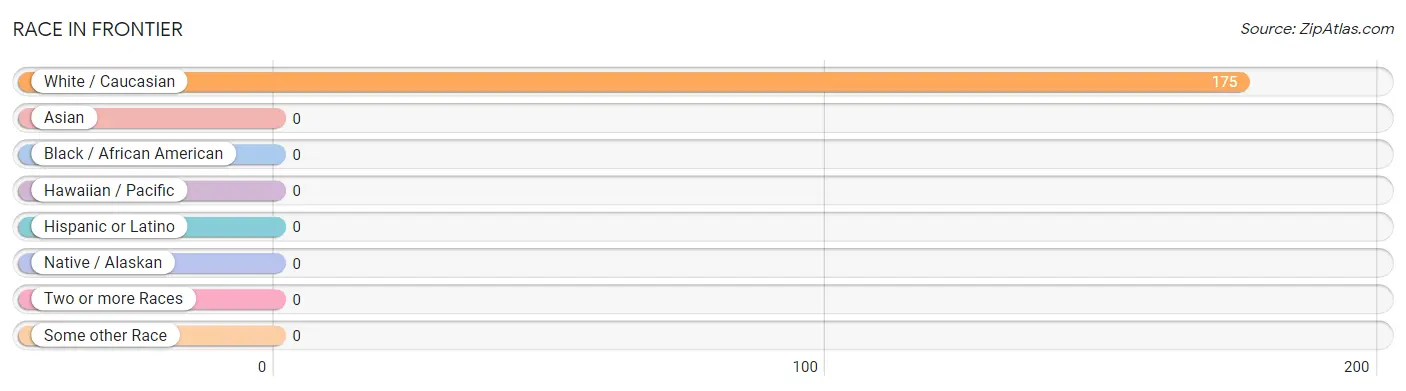
| Race | # Population | % Population |
| Asian | 0 | 0.0% |
| Black / African American | 0 | 0.0% |
| Hawaiian / Pacific | 0 | 0.0% |
| Hispanic or Latino | 0 | 0.0% |
| Native / Alaskan | 0 | 0.0% |
| White / Caucasian | 175 | 100.0% |
| Two or more Races | 0 | 0.0% |
| Some other Race | 0 | 0.0% |
| Total | 175 | 100.0% |
Ancestry in Frontier
The most populous ancestries reported in Frontier are German (85 | 48.6%), Norwegian (54 | 30.9%), Irish (20 | 11.4%), English (16 | 9.1%), and Polish (11 | 6.3%), together accounting for 106.3% of all Frontier residents.
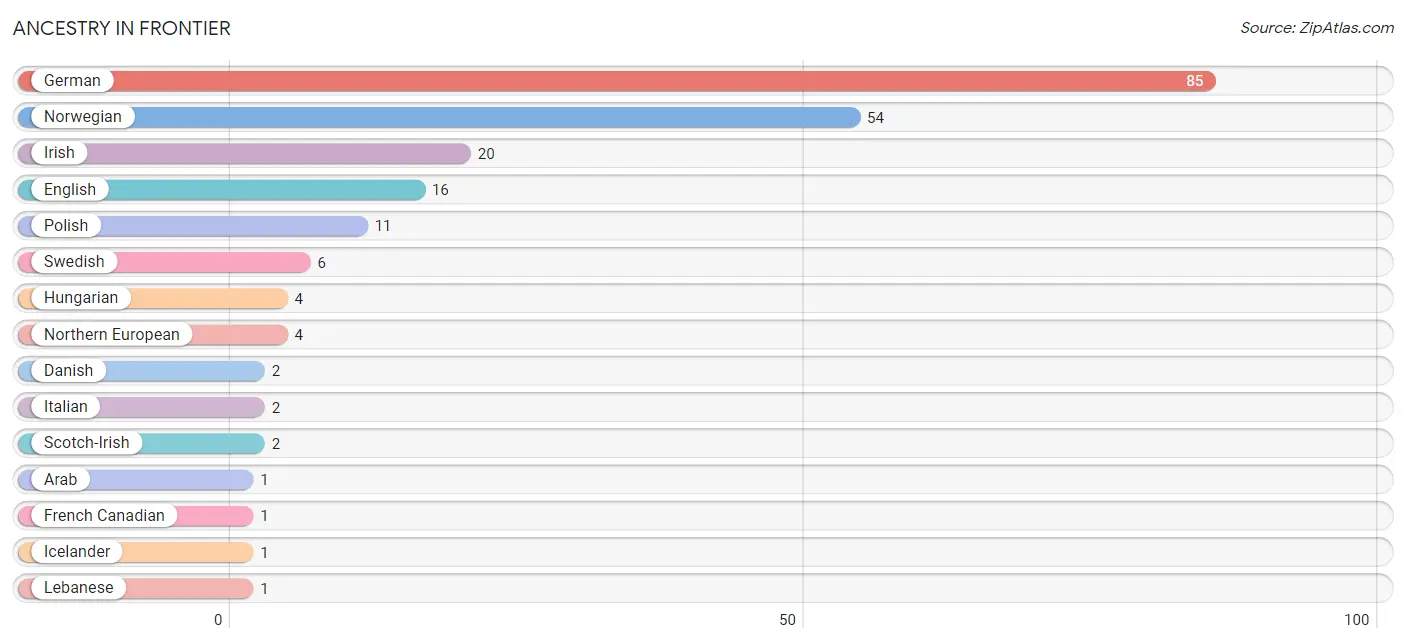
| Ancestry | # Population | % Population |
| Arab | 1 | 0.6% |
| Danish | 2 | 1.1% |
| English | 16 | 9.1% |
| French Canadian | 1 | 0.6% |
| German | 85 | 48.6% |
| Hungarian | 4 | 2.3% |
| Icelander | 1 | 0.6% |
| Irish | 20 | 11.4% |
| Italian | 2 | 1.1% |
| Lebanese | 1 | 0.6% |
| Northern European | 4 | 2.3% |
| Norwegian | 54 | 30.9% |
| Polish | 11 | 6.3% |
| Scandinavian | 1 | 0.6% |
| Scotch-Irish | 2 | 1.1% |
| Swedish | 6 | 3.4% | View All 16 Rows |
Immigrants in Frontier

| Immigration Origin | # Population | % Population | View All 0 Rows |
Sex and Age in Frontier
Sex and Age in Frontier
The most populous age groups in Frontier are 65 to 69 Years (19 | 22.6%) for men and 65 to 69 Years (14 | 15.4%) for women.
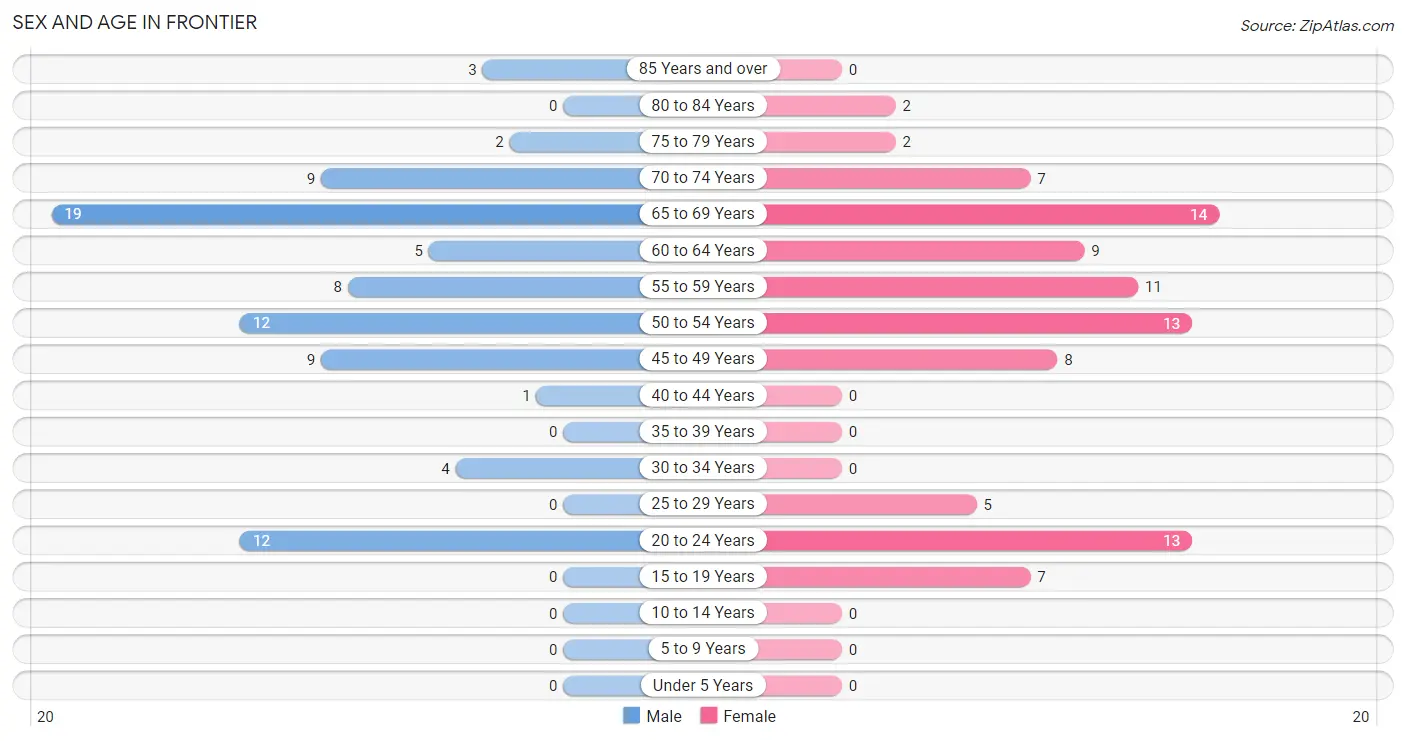
| Age Bracket | Male | Female |
| Under 5 Years | 0 (0.0%) | 0 (0.0%) |
| 5 to 9 Years | 0 (0.0%) | 0 (0.0%) |
| 10 to 14 Years | 0 (0.0%) | 0 (0.0%) |
| 15 to 19 Years | 0 (0.0%) | 7 (7.7%) |
| 20 to 24 Years | 12 (14.3%) | 13 (14.3%) |
| 25 to 29 Years | 0 (0.0%) | 5 (5.5%) |
| 30 to 34 Years | 4 (4.8%) | 0 (0.0%) |
| 35 to 39 Years | 0 (0.0%) | 0 (0.0%) |
| 40 to 44 Years | 1 (1.2%) | 0 (0.0%) |
| 45 to 49 Years | 9 (10.7%) | 8 (8.8%) |
| 50 to 54 Years | 12 (14.3%) | 13 (14.3%) |
| 55 to 59 Years | 8 (9.5%) | 11 (12.1%) |
| 60 to 64 Years | 5 (5.9%) | 9 (9.9%) |
| 65 to 69 Years | 19 (22.6%) | 14 (15.4%) |
| 70 to 74 Years | 9 (10.7%) | 7 (7.7%) |
| 75 to 79 Years | 2 (2.4%) | 2 (2.2%) |
| 80 to 84 Years | 0 (0.0%) | 2 (2.2%) |
| 85 Years and over | 3 (3.6%) | 0 (0.0%) |
| Total | 84 (100.0%) | 91 (100.0%) |
Families and Households in Frontier
Median Family Size in Frontier
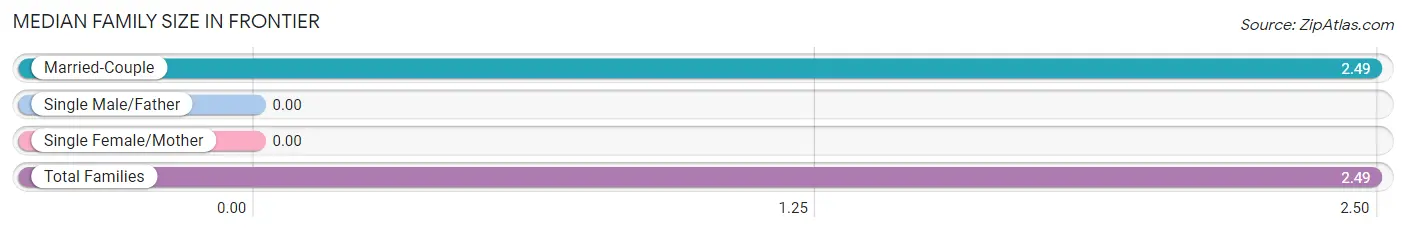
| Family Type | # Families | Family Size |
| Married-Couple | 69 (100.0%) | 2.49 |
| Single Male/Father | 0 (0.0%) | - |
| Single Female/Mother | 0 (0.0%) | - |
| Total Families | 69 (100.0%) | 2.49 |
Median Household Size in Frontier
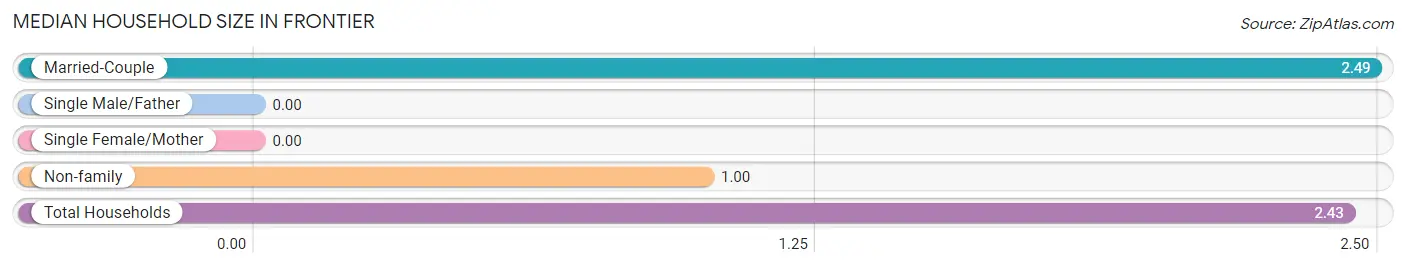
| Household Type | # Households | Household Size |
| Married-Couple | 69 (95.8%) | 2.49 |
| Single Male/Father | 0 (0.0%) | - |
| Single Female/Mother | 0 (0.0%) | - |
| Non-family | 3 (4.2%) | 1.00 |
| Total Households | 72 (100.0%) | 2.43 |
Household Size by Marriage Status in Frontier
Out of a total of 72 households in Frontier, 69 (95.8%) are family households, while 3 (4.2%) are nonfamily households. The most numerous type of family households are 2-person households, comprising 49, and the most common type of nonfamily households are 1-person households, comprising 3.
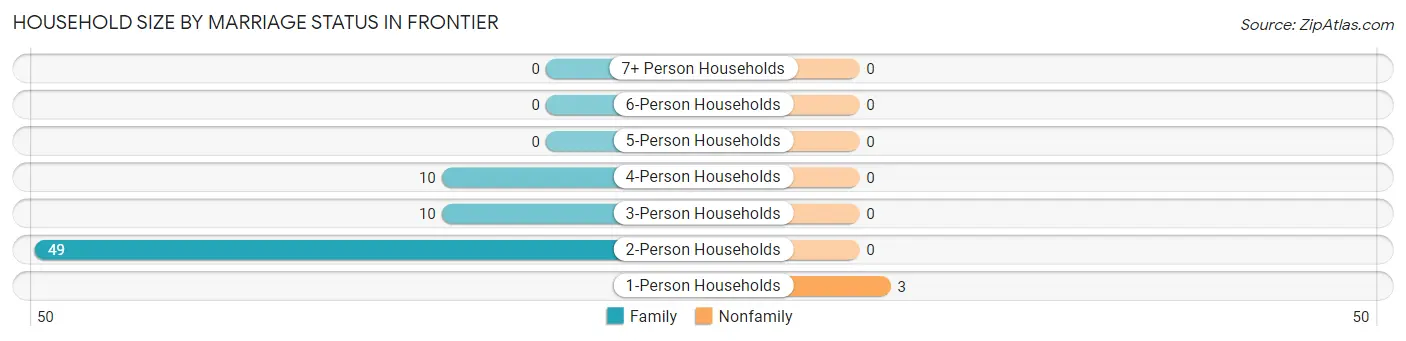
| Household Size | Family Households | Nonfamily Households |
| 1-Person Households | - | 3 (4.2%) |
| 2-Person Households | 49 (68.1%) | 0 (0.0%) |
| 3-Person Households | 10 (13.9%) | 0 (0.0%) |
| 4-Person Households | 10 (13.9%) | 0 (0.0%) |
| 5-Person Households | 0 (0.0%) | 0 (0.0%) |
| 6-Person Households | 0 (0.0%) | 0 (0.0%) |
| 7+ Person Households | 0 (0.0%) | 0 (0.0%) |
| Total | 69 (95.8%) | 3 (4.2%) |
Female Fertility in Frontier
Fertility by Age in Frontier
| Age Bracket | Women with Births | Births / 1,000 Women |
| 15 to 19 years | 0 (0.0%) | 0.0 |
| 20 to 34 years | 0 (0.0%) | 0.0 |
| 35 to 50 years | 0 (0.0%) | 0.0 |
| Total | 0 (0.0%) | 0.0 |
Fertility by Age by Marriage Status in Frontier
| Age Bracket | Married | Unmarried |
| 15 to 19 years | 0 (0.0%) | 0 (0.0%) |
| 20 to 34 years | 0 (0.0%) | 0 (0.0%) |
| 35 to 50 years | 0 (0.0%) | 0 (0.0%) |
| Total | 0 (0.0%) | 0 (0.0%) |
Fertility by Education in Frontier
| Educational Attainment | Women with Births | Births / 1,000 Women |
| Less than High School | 0 (0.0%) | 0.0 |
| High School Diploma | 0 (0.0%) | 0.0 |
| College or Associate's Degree | 0 (0.0%) | 0.0 |
| Bachelor's Degree | 0 (0.0%) | 0.0 |
| Graduate Degree | 0 (0.0%) | 0.0 |
| Total | 0 (0.0%) | 0.0 |
Fertility by Education by Marriage Status in Frontier
| Educational Attainment | Married | Unmarried |
| Less than High School | 0 (0.0%) | 0 (0.0%) |
| High School Diploma | 0 (0.0%) | 0 (0.0%) |
| College or Associate's Degree | 0 (0.0%) | 0 (0.0%) |
| Bachelor's Degree | 0 (0.0%) | 0 (0.0%) |
| Graduate Degree | 0 (0.0%) | 0 (0.0%) |
| Total | 0 (0.0%) | 0 (0.0%) |
Employment Characteristics in Frontier
Employment by Class of Employer in Frontier
Among the 102 employed individuals in Frontier, private company employees (61 | 59.8%), self-employed (not incorporated) (15 | 14.7%), and not-for-profit organizations (13 | 12.8%) make up the most common classes of employment.
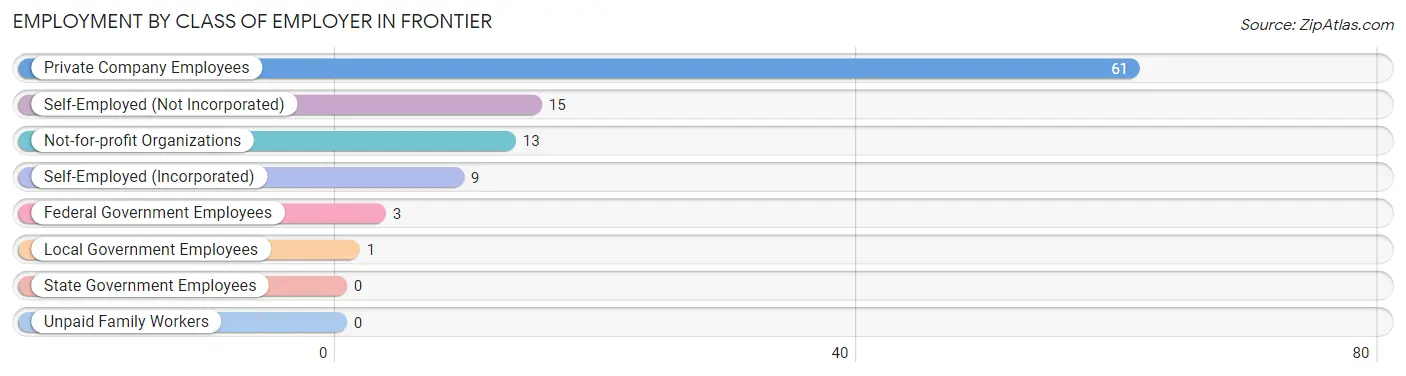
| Employer Class | # Employees | % Employees |
| Private Company Employees | 61 | 59.8% |
| Self-Employed (Incorporated) | 9 | 8.8% |
| Self-Employed (Not Incorporated) | 15 | 14.7% |
| Not-for-profit Organizations | 13 | 12.8% |
| Local Government Employees | 1 | 1.0% |
| State Government Employees | 0 | 0.0% |
| Federal Government Employees | 3 | 2.9% |
| Unpaid Family Workers | 0 | 0.0% |
| Total | 102 | 100.0% |
Employment Status by Age in Frontier
According to the labor force statistics for Frontier, out of the total population over 16 years of age (175), 62.3% or 109 individuals are in the labor force, with 6.4% or 7 of them unemployed. The age group with the highest labor force participation rate is 25 to 29 years, with 100.0% or 5 individuals in the labor force. Within the labor force, the 20 to 24 years age range has the highest percentage of unemployed individuals, with 35.0% or 7 of them being unemployed.
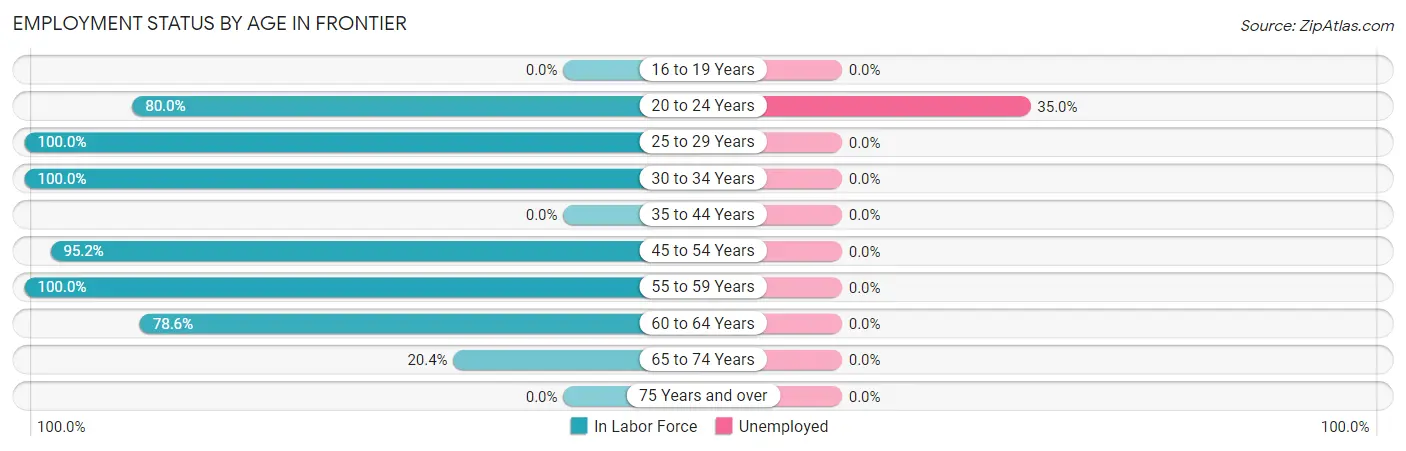
| Age Bracket | In Labor Force | Unemployed |
| 16 to 19 Years | 0 (0.0%) | 0 (0.0%) |
| 20 to 24 Years | 20 (80.0%) | 7 (35.0%) |
| 25 to 29 Years | 5 (100.0%) | 0 (0.0%) |
| 30 to 34 Years | 4 (100.0%) | 0 (0.0%) |
| 35 to 44 Years | 0 (0.0%) | 0 (0.0%) |
| 45 to 54 Years | 40 (95.2%) | 0 (0.0%) |
| 55 to 59 Years | 19 (100.0%) | 0 (0.0%) |
| 60 to 64 Years | 11 (78.6%) | 0 (0.0%) |
| 65 to 74 Years | 10 (20.4%) | 0 (0.0%) |
| 75 Years and over | 0 (0.0%) | 0 (0.0%) |
| Total | 109 (62.3%) | 7 (6.4%) |
Employment Status by Educational Attainment in Frontier
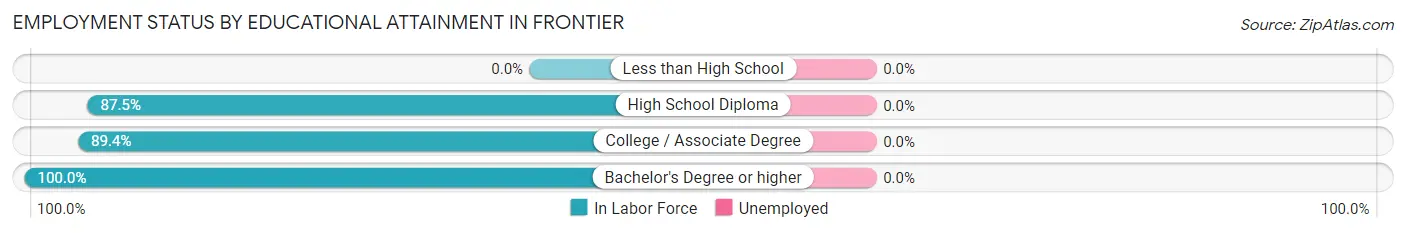
| Educational Attainment | In Labor Force | Unemployed |
| Less than High School | 0 (0.0%) | 0 (0.0%) |
| High School Diploma | 7 (87.5%) | 0 (0.0%) |
| College / Associate Degree | 42 (89.4%) | 0 (0.0%) |
| Bachelor's Degree or higher | 30 (100.0%) | 0 (0.0%) |
| Total | 79 (92.9%) | 0 (0.0%) |
Employment Occupations by Sex in Frontier
Management, Business, Science and Arts Occupations
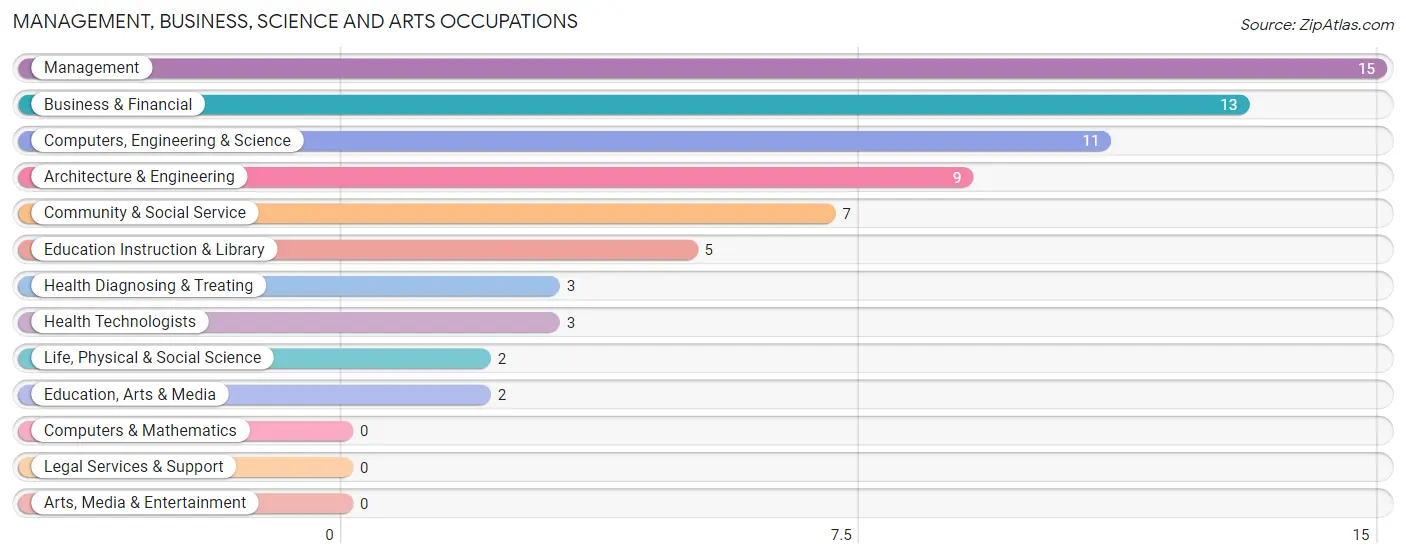
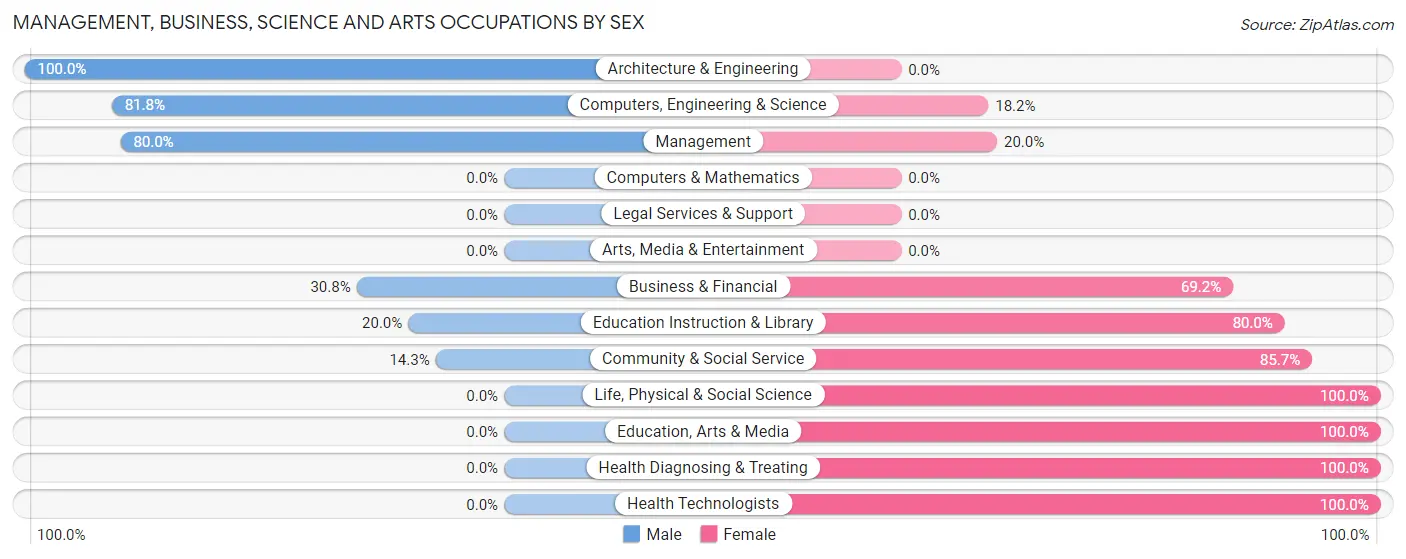
The most common Management, Business, Science and Arts occupations in Frontier are Management (15 | 14.7%), Business & Financial (13 | 12.8%), Computers, Engineering & Science (11 | 10.8%), Architecture & Engineering (9 | 8.8%), and Community & Social Service (7 | 6.9%).
Management, Business, Science and Arts Occupations by Sex
Within the Management, Business, Science and Arts occupations in Frontier, the most male-oriented occupations are Architecture & Engineering (100.0%), Computers, Engineering & Science (81.8%), and Management (80.0%), while the most female-oriented occupations are Life, Physical & Social Science (100.0%), Education, Arts & Media (100.0%), and Health Diagnosing & Treating (100.0%).
| Occupation | Male | Female |
| Management | 12 (80.0%) | 3 (20.0%) |
| Business & Financial | 4 (30.8%) | 9 (69.2%) |
| Computers, Engineering & Science | 9 (81.8%) | 2 (18.2%) |
| Computers & Mathematics | 0 (0.0%) | 0 (0.0%) |
| Architecture & Engineering | 9 (100.0%) | 0 (0.0%) |
| Life, Physical & Social Science | 0 (0.0%) | 2 (100.0%) |
| Community & Social Service | 1 (14.3%) | 6 (85.7%) |
| Education, Arts & Media | 0 (0.0%) | 2 (100.0%) |
| Legal Services & Support | 0 (0.0%) | 0 (0.0%) |
| Education Instruction & Library | 1 (20.0%) | 4 (80.0%) |
| Arts, Media & Entertainment | 0 (0.0%) | 0 (0.0%) |
| Health Diagnosing & Treating | 0 (0.0%) | 3 (100.0%) |
| Health Technologists | 0 (0.0%) | 3 (100.0%) |
| Total (Category) | 26 (53.1%) | 23 (46.9%) |
| Total (Overall) | 56 (54.9%) | 46 (45.1%) |
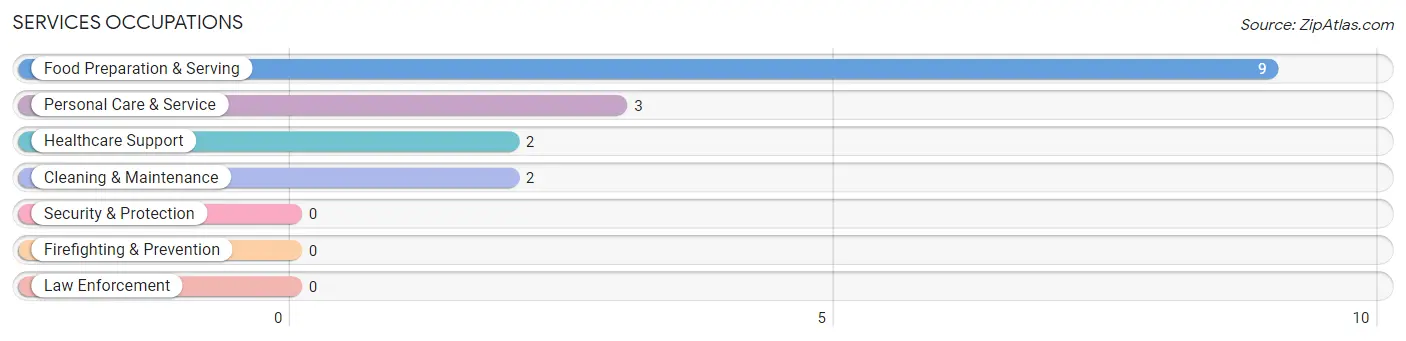
Services Occupations
The most common Services occupations in Frontier are Food Preparation & Serving (9 | 8.8%), Personal Care & Service (3 | 2.9%), Healthcare Support (2 | 2.0%), and Cleaning & Maintenance (2 | 2.0%).
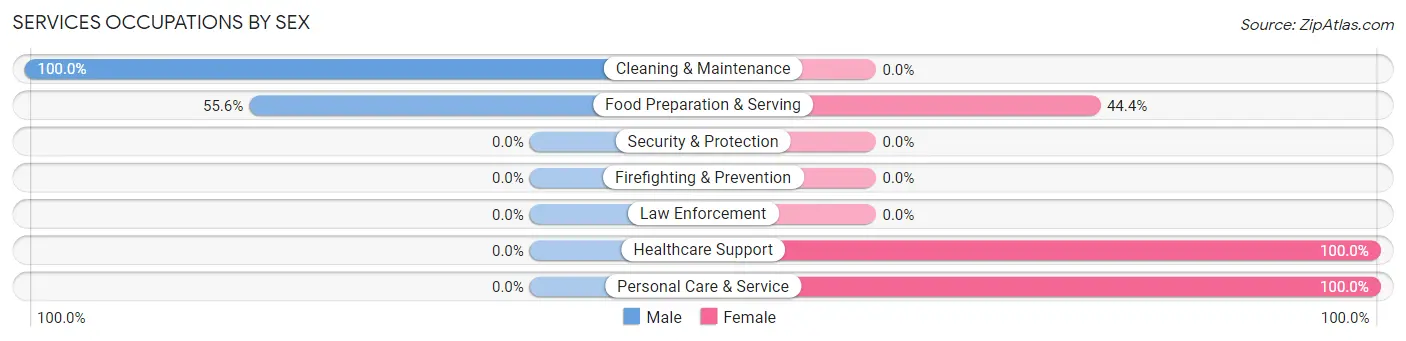
Services Occupations by Sex
Within the Services occupations in Frontier, the most male-oriented occupations are Cleaning & Maintenance (100.0%), and Food Preparation & Serving (55.6%), while the most female-oriented occupations are Healthcare Support (100.0%), Personal Care & Service (100.0%), and Food Preparation & Serving (44.4%).
| Occupation | Male | Female |
| Healthcare Support | 0 (0.0%) | 2 (100.0%) |
| Security & Protection | 0 (0.0%) | 0 (0.0%) |
| Firefighting & Prevention | 0 (0.0%) | 0 (0.0%) |
| Law Enforcement | 0 (0.0%) | 0 (0.0%) |
| Food Preparation & Serving | 5 (55.6%) | 4 (44.4%) |
| Cleaning & Maintenance | 2 (100.0%) | 0 (0.0%) |
| Personal Care & Service | 0 (0.0%) | 3 (100.0%) |
| Total (Category) | 7 (43.8%) | 9 (56.2%) |
| Total (Overall) | 56 (54.9%) | 46 (45.1%) |
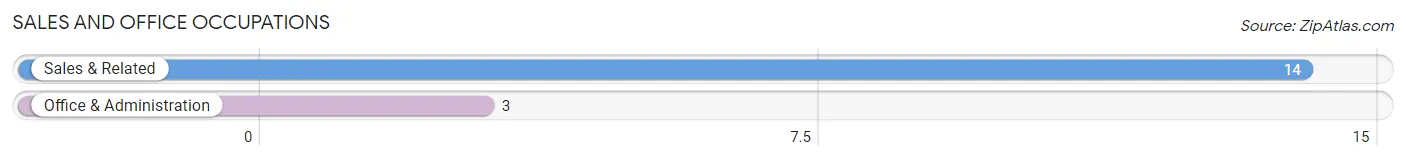
Sales and Office Occupations
The most common Sales and Office occupations in Frontier are Sales & Related (14 | 13.7%), and Office & Administration (3 | 2.9%).
Sales and Office Occupations by Sex
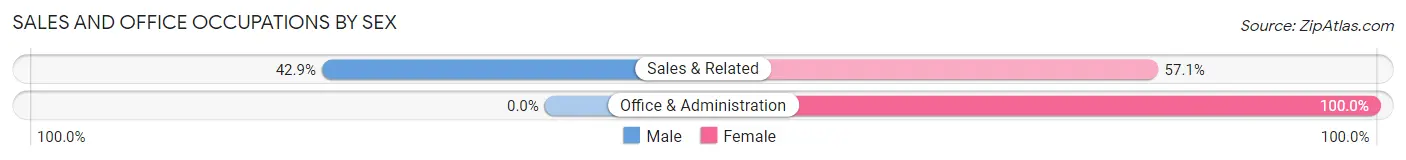
| Occupation | Male | Female |
| Sales & Related | 6 (42.9%) | 8 (57.1%) |
| Office & Administration | 0 (0.0%) | 3 (100.0%) |
| Total (Category) | 6 (35.3%) | 11 (64.7%) |
| Total (Overall) | 56 (54.9%) | 46 (45.1%) |
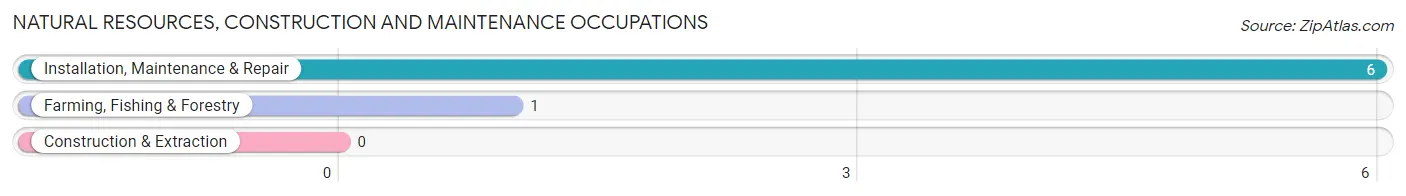
Natural Resources, Construction and Maintenance Occupations
The most common Natural Resources, Construction and Maintenance occupations in Frontier are Installation, Maintenance & Repair (6 | 5.9%), and Farming, Fishing & Forestry (1 | 1.0%).
Natural Resources, Construction and Maintenance Occupations by Sex
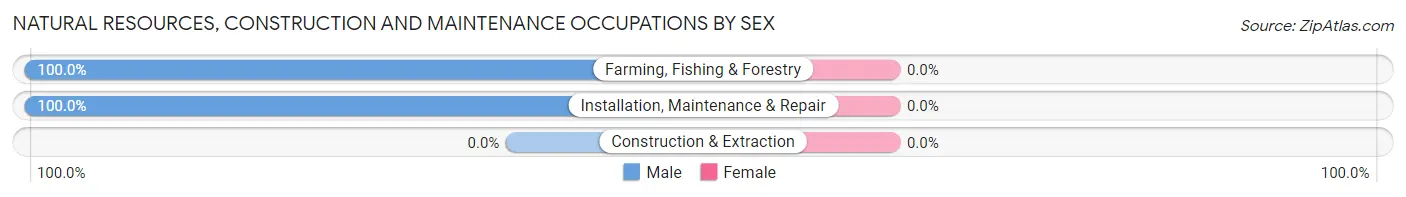
| Occupation | Male | Female |
| Farming, Fishing & Forestry | 1 (100.0%) | 0 (0.0%) |
| Construction & Extraction | 0 (0.0%) | 0 (0.0%) |
| Installation, Maintenance & Repair | 6 (100.0%) | 0 (0.0%) |
| Total (Category) | 7 (100.0%) | 0 (0.0%) |
| Total (Overall) | 56 (54.9%) | 46 (45.1%) |
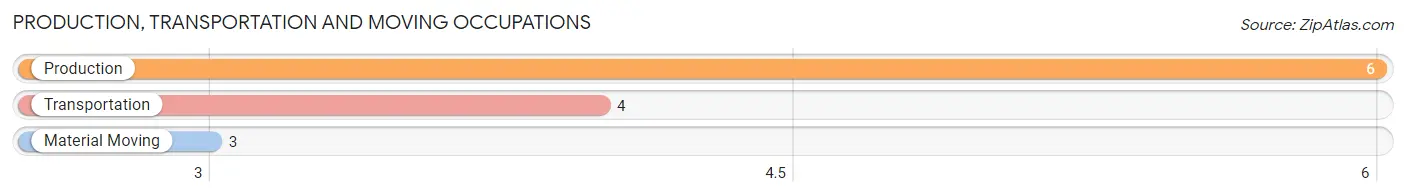
Production, Transportation and Moving Occupations
The most common Production, Transportation and Moving occupations in Frontier are Production (6 | 5.9%), Transportation (4 | 3.9%), and Material Moving (3 | 2.9%).
Production, Transportation and Moving Occupations by Sex
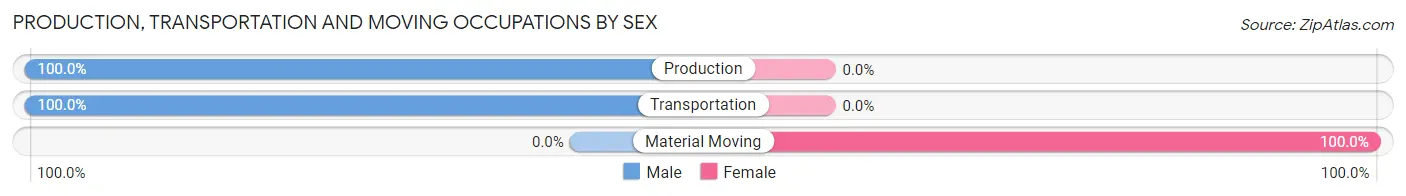
| Occupation | Male | Female |
| Production | 6 (100.0%) | 0 (0.0%) |
| Transportation | 4 (100.0%) | 0 (0.0%) |
| Material Moving | 0 (0.0%) | 3 (100.0%) |
| Total (Category) | 10 (76.9%) | 3 (23.1%) |
| Total (Overall) | 56 (54.9%) | 46 (45.1%) |
Employment Industries by Sex in Frontier
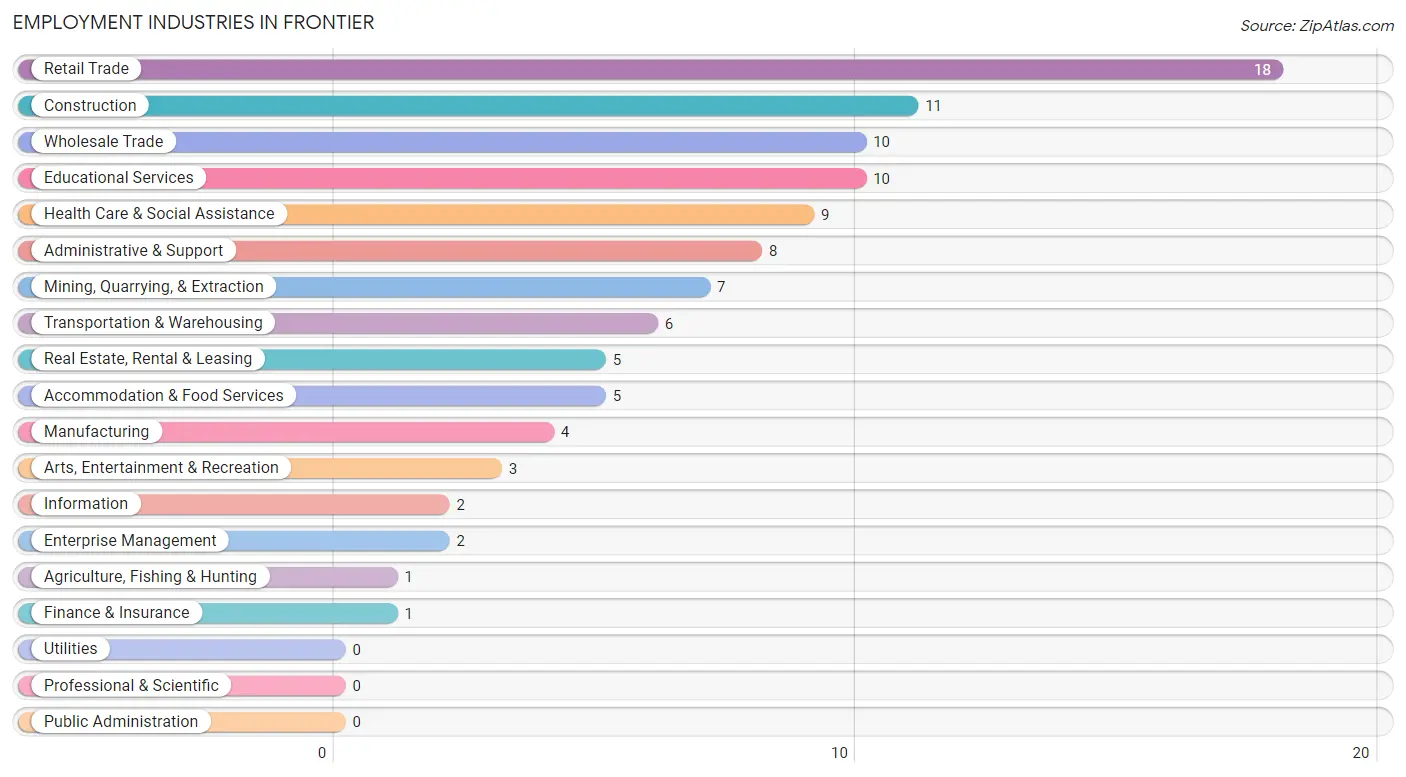
Employment Industries in Frontier
The major employment industries in Frontier include Retail Trade (18 | 17.6%), Construction (11 | 10.8%), Wholesale Trade (10 | 9.8%), Educational Services (10 | 9.8%), and Health Care & Social Assistance (9 | 8.8%).
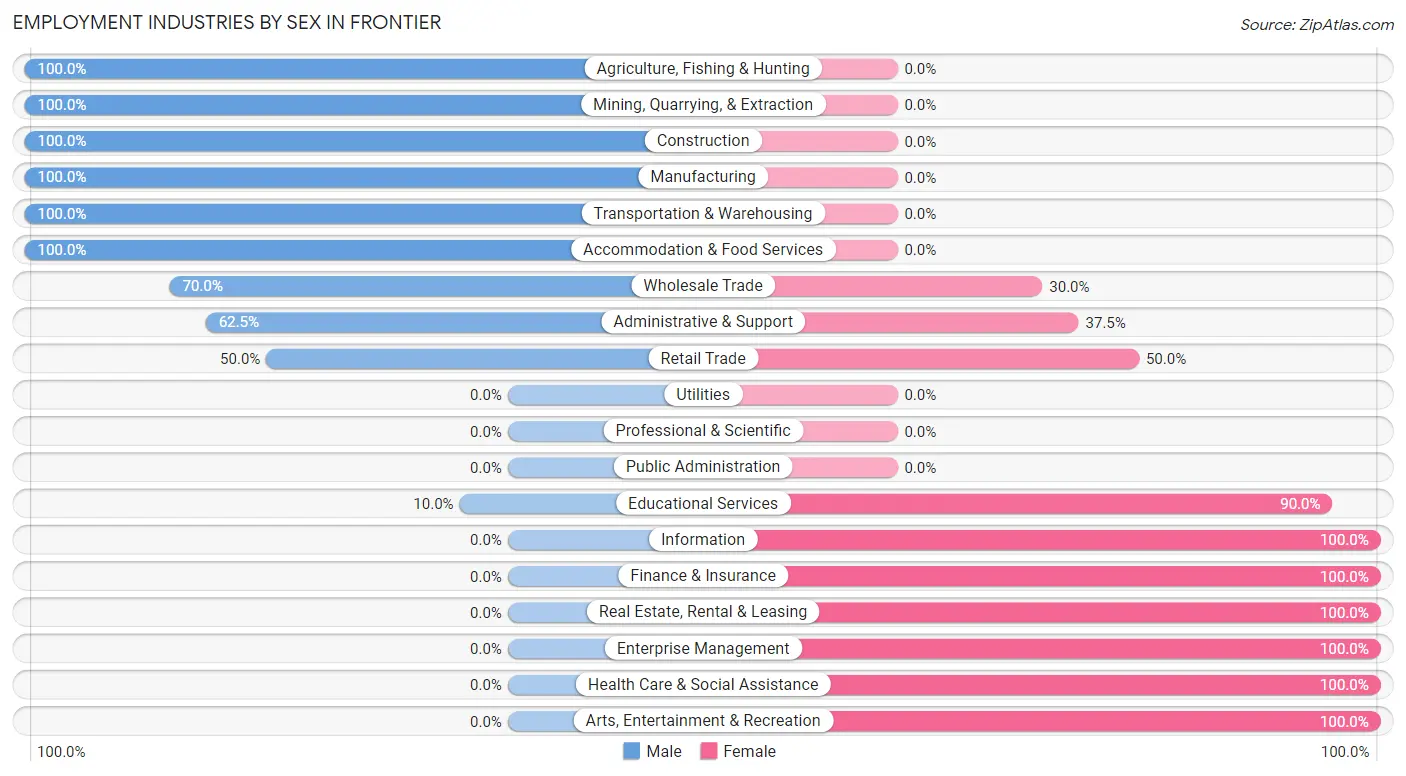
Employment Industries by Sex in Frontier
The Frontier industries that see more men than women are Agriculture, Fishing & Hunting (100.0%), Mining, Quarrying, & Extraction (100.0%), and Construction (100.0%), whereas the industries that tend to have a higher number of women are Information (100.0%), Finance & Insurance (100.0%), and Real Estate, Rental & Leasing (100.0%).
| Industry | Male | Female |
| Agriculture, Fishing & Hunting | 1 (100.0%) | 0 (0.0%) |
| Mining, Quarrying, & Extraction | 7 (100.0%) | 0 (0.0%) |
| Construction | 11 (100.0%) | 0 (0.0%) |
| Manufacturing | 4 (100.0%) | 0 (0.0%) |
| Wholesale Trade | 7 (70.0%) | 3 (30.0%) |
| Retail Trade | 9 (50.0%) | 9 (50.0%) |
| Transportation & Warehousing | 6 (100.0%) | 0 (0.0%) |
| Utilities | 0 (0.0%) | 0 (0.0%) |
| Information | 0 (0.0%) | 2 (100.0%) |
| Finance & Insurance | 0 (0.0%) | 1 (100.0%) |
| Real Estate, Rental & Leasing | 0 (0.0%) | 5 (100.0%) |
| Professional & Scientific | 0 (0.0%) | 0 (0.0%) |
| Enterprise Management | 0 (0.0%) | 2 (100.0%) |
| Administrative & Support | 5 (62.5%) | 3 (37.5%) |
| Educational Services | 1 (10.0%) | 9 (90.0%) |
| Health Care & Social Assistance | 0 (0.0%) | 9 (100.0%) |
| Arts, Entertainment & Recreation | 0 (0.0%) | 3 (100.0%) |
| Accommodation & Food Services | 5 (100.0%) | 0 (0.0%) |
| Public Administration | 0 (0.0%) | 0 (0.0%) |
| Total | 56 (54.9%) | 46 (45.1%) |
Education in Frontier
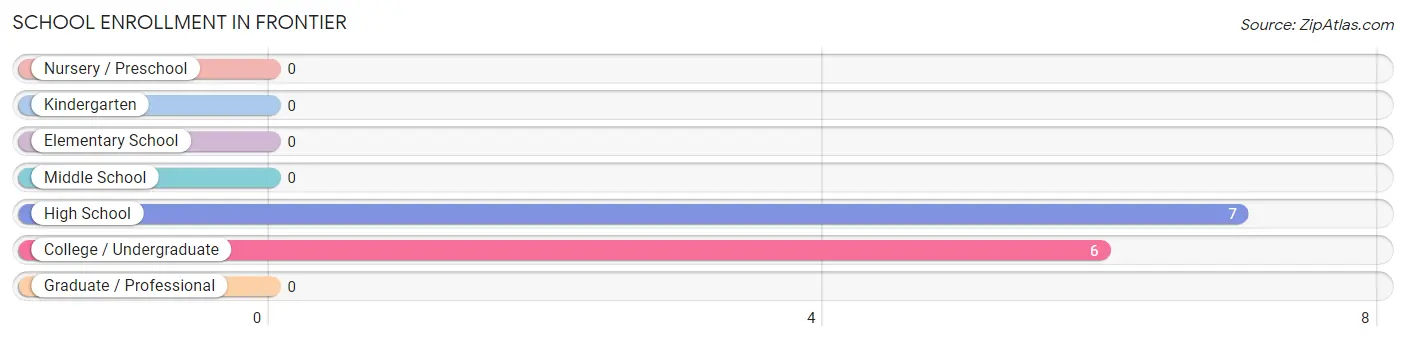
School Enrollment in Frontier
The most common levels of schooling among the 13 students in Frontier are high school (7 | 53.8%), and college / undergraduate (6 | 46.2%).
| School Level | # Students | % Students |
| Nursery / Preschool | 0 | 0.0% |
| Kindergarten | 0 | 0.0% |
| Elementary School | 0 | 0.0% |
| Middle School | 0 | 0.0% |
| High School | 7 | 53.8% |
| College / Undergraduate | 6 | 46.2% |
| Graduate / Professional | 0 | 0.0% |
| Total | 13 | 100.0% |
School Enrollment by Age by Funding Source in Frontier
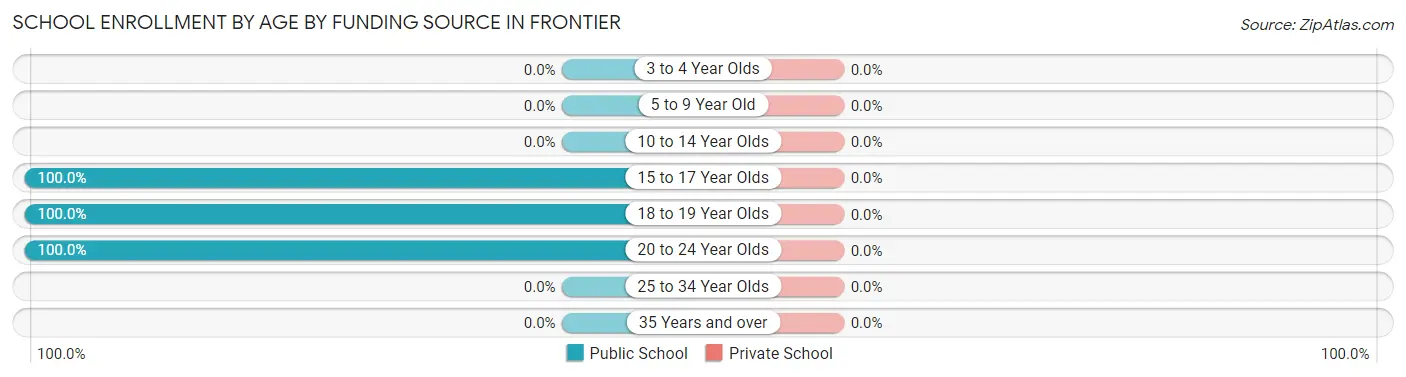
| Age Bracket | Public School | Private School |
| 3 to 4 Year Olds | 0 (0.0%) | 0 (0.0%) |
| 5 to 9 Year Old | 0 (0.0%) | 0 (0.0%) |
| 10 to 14 Year Olds | 0 (0.0%) | 0 (0.0%) |
| 15 to 17 Year Olds | 3 (100.0%) | 0 (0.0%) |
| 18 to 19 Year Olds | 4 (100.0%) | 0 (0.0%) |
| 20 to 24 Year Olds | 6 (100.0%) | 0 (0.0%) |
| 25 to 34 Year Olds | 0 (0.0%) | 0 (0.0%) |
| 35 Years and over | 0 (0.0%) | 0 (0.0%) |
| Total | 13 (100.0%) | 0 (0.0%) |
Educational Attainment by Field of Study in Frontier
Business (21 | 40.4%), education (10 | 19.2%), science & technology (7 | 13.5%), arts & humanities (5 | 9.6%), and psychology (4 | 7.7%) are the most common fields of study among 52 individuals in Frontier who have obtained a bachelor's degree or higher.
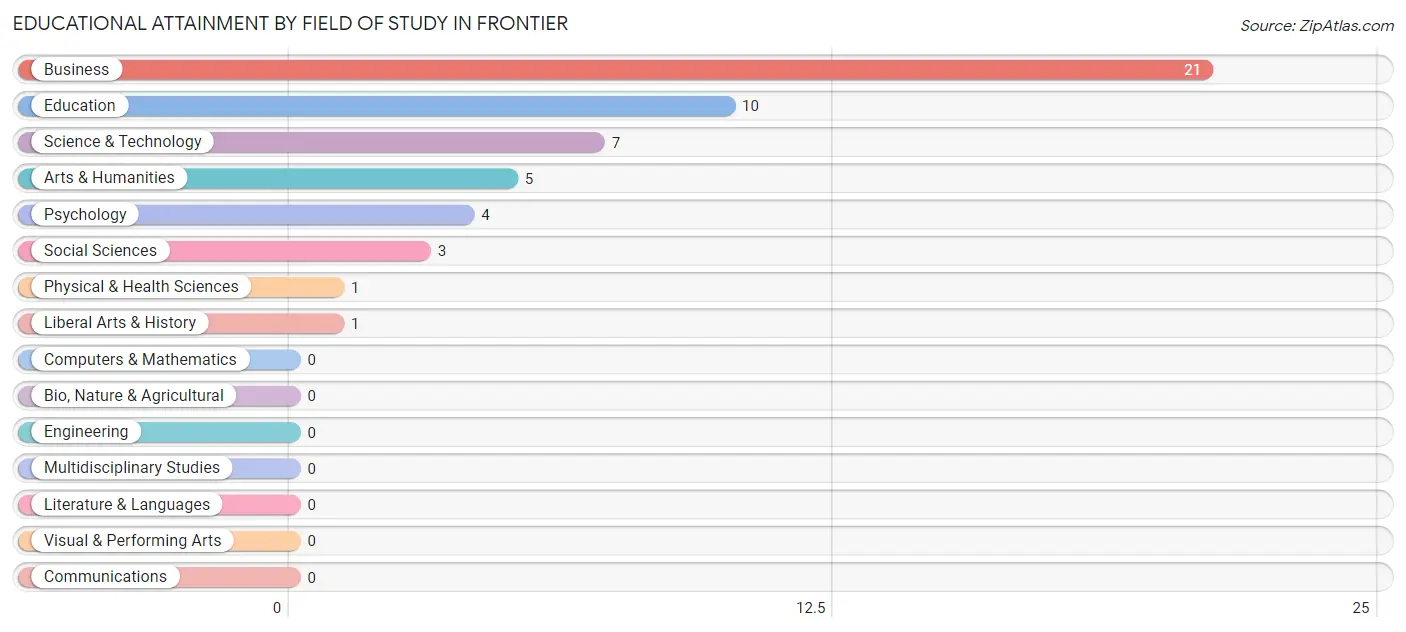
| Field of Study | # Graduates | % Graduates |
| Computers & Mathematics | 0 | 0.0% |
| Bio, Nature & Agricultural | 0 | 0.0% |
| Physical & Health Sciences | 1 | 1.9% |
| Psychology | 4 | 7.7% |
| Social Sciences | 3 | 5.8% |
| Engineering | 0 | 0.0% |
| Multidisciplinary Studies | 0 | 0.0% |
| Science & Technology | 7 | 13.5% |
| Business | 21 | 40.4% |
| Education | 10 | 19.2% |
| Literature & Languages | 0 | 0.0% |
| Liberal Arts & History | 1 | 1.9% |
| Visual & Performing Arts | 0 | 0.0% |
| Communications | 0 | 0.0% |
| Arts & Humanities | 5 | 9.6% |
| Total | 52 | 100.0% |
Transportation & Commute in Frontier
Vehicle Availability by Sex in Frontier
The most prevalent vehicle ownership categories in Frontier are males with 4 vehicles (22, accounting for 39.3%) and females with 4 vehicles (19, making up 47.8%).
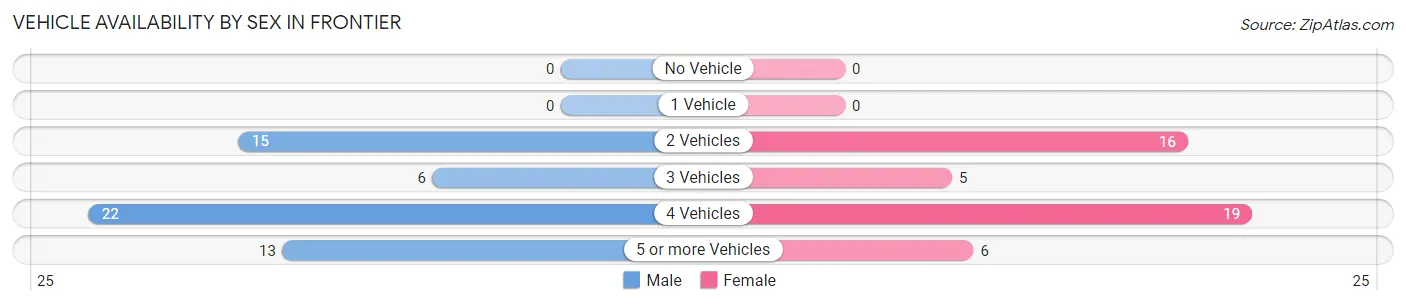
| Vehicles Available | Male | Female |
| No Vehicle | 0 (0.0%) | 0 (0.0%) |
| 1 Vehicle | 0 (0.0%) | 0 (0.0%) |
| 2 Vehicles | 15 (26.8%) | 16 (34.8%) |
| 3 Vehicles | 6 (10.7%) | 5 (10.9%) |
| 4 Vehicles | 22 (39.3%) | 19 (41.3%) |
| 5 or more Vehicles | 13 (23.2%) | 6 (13.0%) |
| Total | 56 (100.0%) | 46 (100.0%) |
Commute Time in Frontier
The most frequently occuring commute durations in Frontier are 10 to 14 minutes (23 commuters, 24.0%), 15 to 19 minutes (23 commuters, 24.0%), and 5 to 9 minutes (15 commuters, 15.6%).
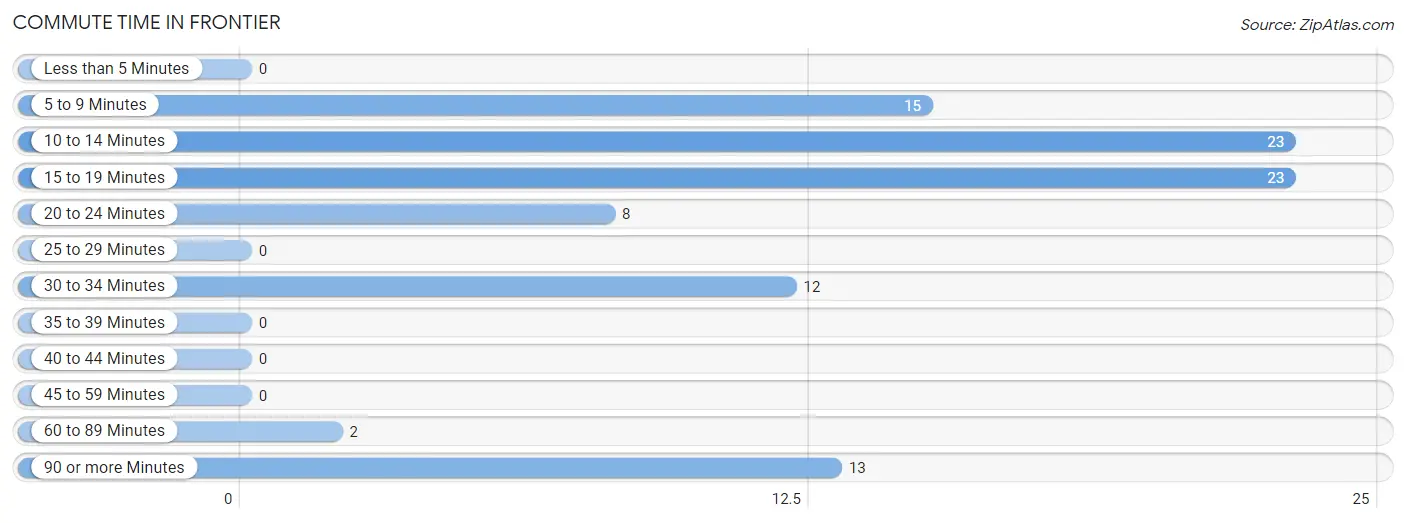
| Commute Time | # Commuters | % Commuters |
| Less than 5 Minutes | 0 | 0.0% |
| 5 to 9 Minutes | 15 | 15.6% |
| 10 to 14 Minutes | 23 | 24.0% |
| 15 to 19 Minutes | 23 | 24.0% |
| 20 to 24 Minutes | 8 | 8.3% |
| 25 to 29 Minutes | 0 | 0.0% |
| 30 to 34 Minutes | 12 | 12.5% |
| 35 to 39 Minutes | 0 | 0.0% |
| 40 to 44 Minutes | 0 | 0.0% |
| 45 to 59 Minutes | 0 | 0.0% |
| 60 to 89 Minutes | 2 | 2.1% |
| 90 or more Minutes | 13 | 13.5% |
Commute Time by Sex in Frontier
The most common commute times in Frontier are 15 to 19 minutes (16 commuters, 28.6%) for males and 5 to 9 minutes (11 commuters, 27.5%) for females.
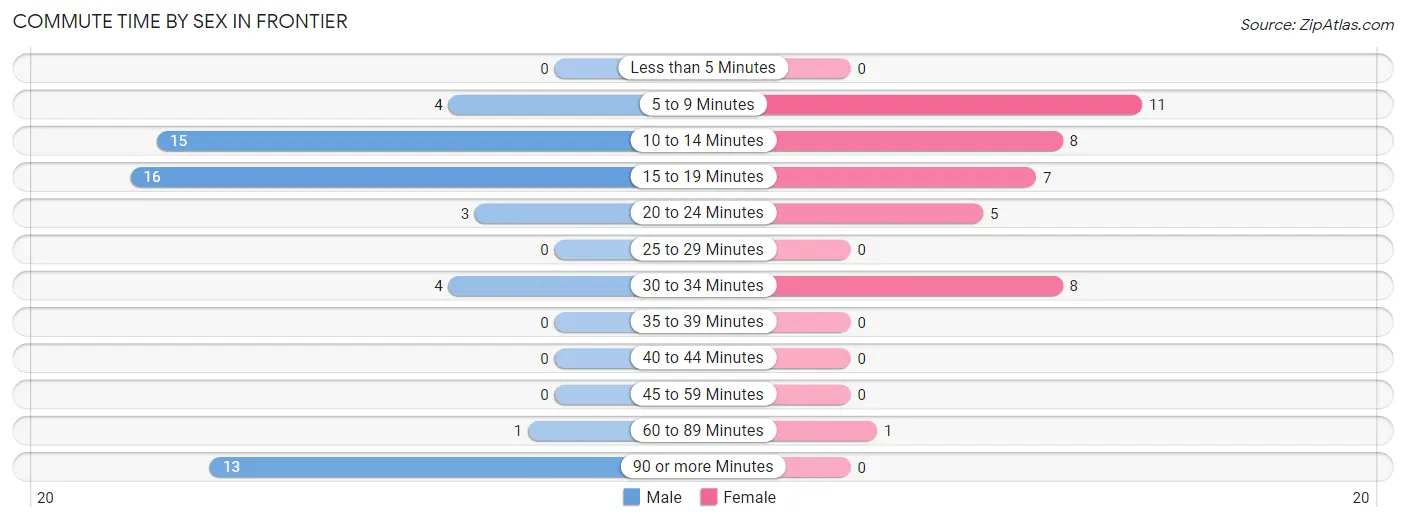
| Commute Time | Male | Female |
| Less than 5 Minutes | 0 (0.0%) | 0 (0.0%) |
| 5 to 9 Minutes | 4 (7.1%) | 11 (27.5%) |
| 10 to 14 Minutes | 15 (26.8%) | 8 (20.0%) |
| 15 to 19 Minutes | 16 (28.6%) | 7 (17.5%) |
| 20 to 24 Minutes | 3 (5.4%) | 5 (12.5%) |
| 25 to 29 Minutes | 0 (0.0%) | 0 (0.0%) |
| 30 to 34 Minutes | 4 (7.1%) | 8 (20.0%) |
| 35 to 39 Minutes | 0 (0.0%) | 0 (0.0%) |
| 40 to 44 Minutes | 0 (0.0%) | 0 (0.0%) |
| 45 to 59 Minutes | 0 (0.0%) | 0 (0.0%) |
| 60 to 89 Minutes | 1 (1.8%) | 1 (2.5%) |
| 90 or more Minutes | 13 (23.2%) | 0 (0.0%) |
Time of Departure to Work by Sex in Frontier
The most frequent times of departure to work in Frontier are 7:30 AM to 7:59 AM (20, 35.7%) for males and 7:30 AM to 7:59 AM (24, 60.0%) for females.
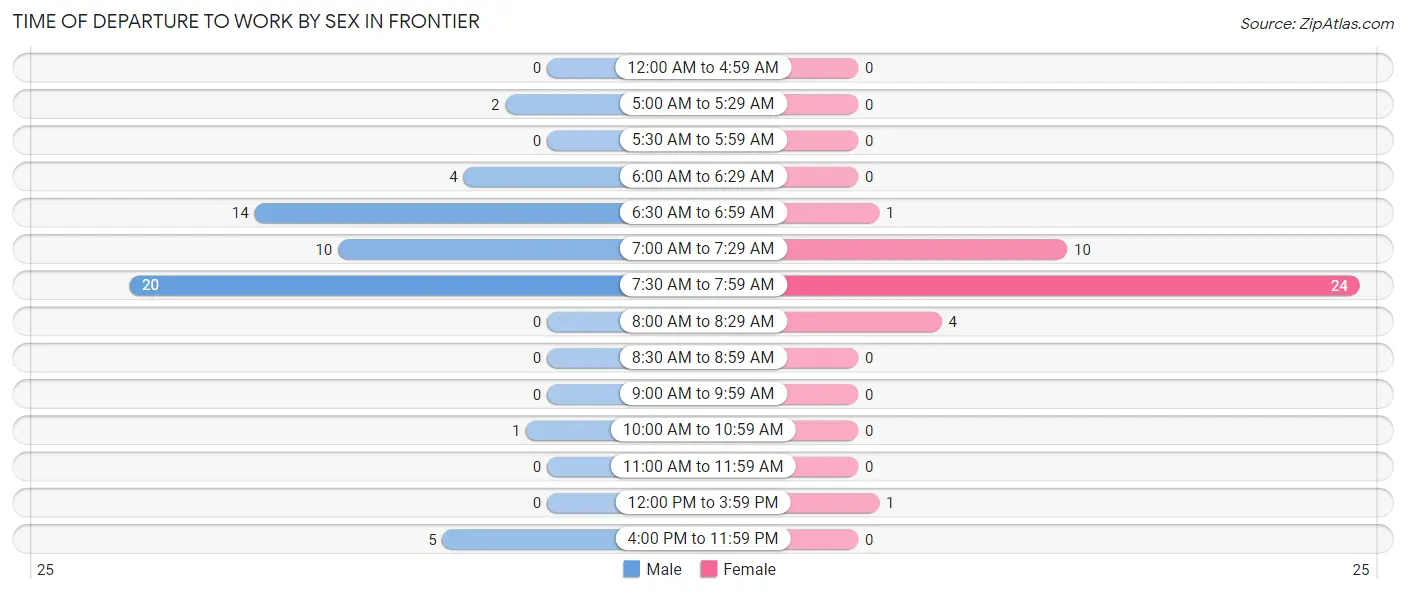
| Time of Departure | Male | Female |
| 12:00 AM to 4:59 AM | 0 (0.0%) | 0 (0.0%) |
| 5:00 AM to 5:29 AM | 2 (3.6%) | 0 (0.0%) |
| 5:30 AM to 5:59 AM | 0 (0.0%) | 0 (0.0%) |
| 6:00 AM to 6:29 AM | 4 (7.1%) | 0 (0.0%) |
| 6:30 AM to 6:59 AM | 14 (25.0%) | 1 (2.5%) |
| 7:00 AM to 7:29 AM | 10 (17.9%) | 10 (25.0%) |
| 7:30 AM to 7:59 AM | 20 (35.7%) | 24 (60.0%) |
| 8:00 AM to 8:29 AM | 0 (0.0%) | 4 (10.0%) |
| 8:30 AM to 8:59 AM | 0 (0.0%) | 0 (0.0%) |
| 9:00 AM to 9:59 AM | 0 (0.0%) | 0 (0.0%) |
| 10:00 AM to 10:59 AM | 1 (1.8%) | 0 (0.0%) |
| 11:00 AM to 11:59 AM | 0 (0.0%) | 0 (0.0%) |
| 12:00 PM to 3:59 PM | 0 (0.0%) | 1 (2.5%) |
| 4:00 PM to 11:59 PM | 5 (8.9%) | 0 (0.0%) |
| Total | 56 (100.0%) | 40 (100.0%) |
Housing Occupancy in Frontier
Occupancy by Ownership in Frontier
Of the total 72 dwellings in Frontier, owner-occupied units account for 71 (98.6%), while renter-occupied units make up 1 (1.4%).
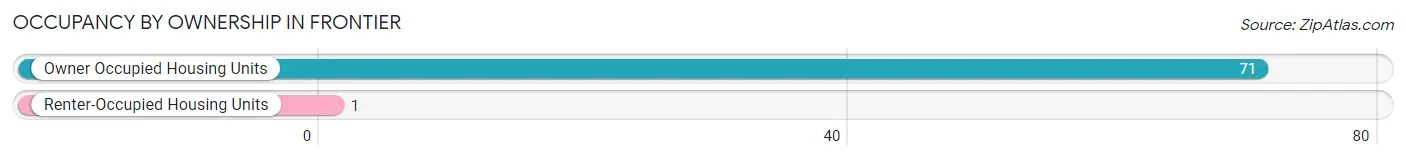
| Occupancy | # Housing Units | % Housing Units |
| Owner Occupied Housing Units | 71 | 98.6% |
| Renter-Occupied Housing Units | 1 | 1.4% |
| Total Occupied Housing Units | 72 | 100.0% |
Occupancy by Household Size in Frontier
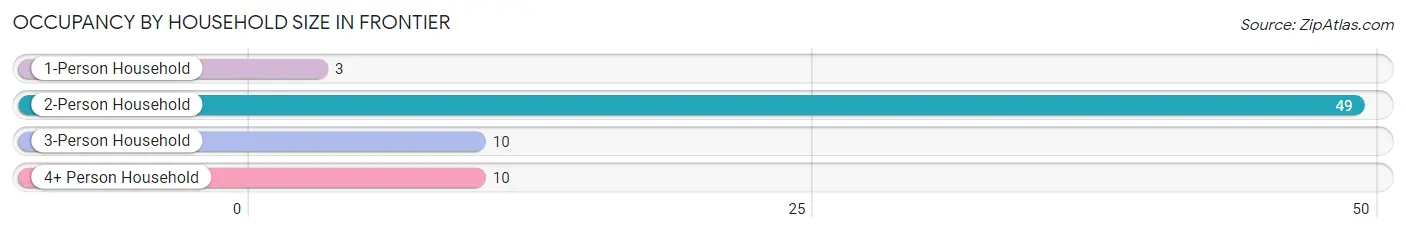
| Household Size | # Housing Units | % Housing Units |
| 1-Person Household | 3 | 4.2% |
| 2-Person Household | 49 | 68.1% |
| 3-Person Household | 10 | 13.9% |
| 4+ Person Household | 10 | 13.9% |
| Total Housing Units | 72 | 100.0% |
Occupancy by Ownership by Household Size in Frontier
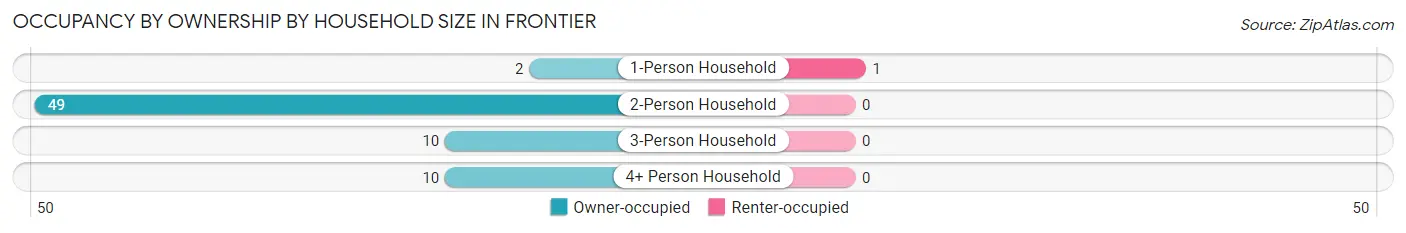
| Household Size | Owner-occupied | Renter-occupied |
| 1-Person Household | 2 (66.7%) | 1 (33.3%) |
| 2-Person Household | 49 (100.0%) | 0 (0.0%) |
| 3-Person Household | 10 (100.0%) | 0 (0.0%) |
| 4+ Person Household | 10 (100.0%) | 0 (0.0%) |
| Total Housing Units | 71 (98.6%) | 1 (1.4%) |
Occupancy by Educational Attainment in Frontier
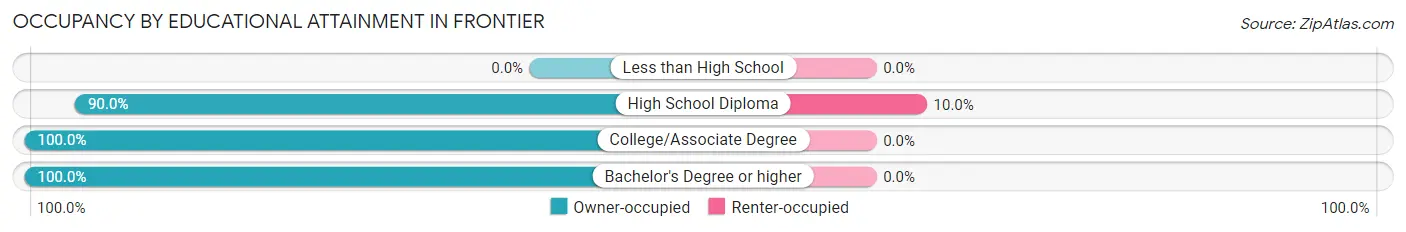
| Household Size | Owner-occupied | Renter-occupied |
| Less than High School | 0 (0.0%) | 0 (0.0%) |
| High School Diploma | 9 (90.0%) | 1 (10.0%) |
| College/Associate Degree | 26 (100.0%) | 0 (0.0%) |
| Bachelor's Degree or higher | 36 (100.0%) | 0 (0.0%) |
Occupancy by Age of Householder in Frontier
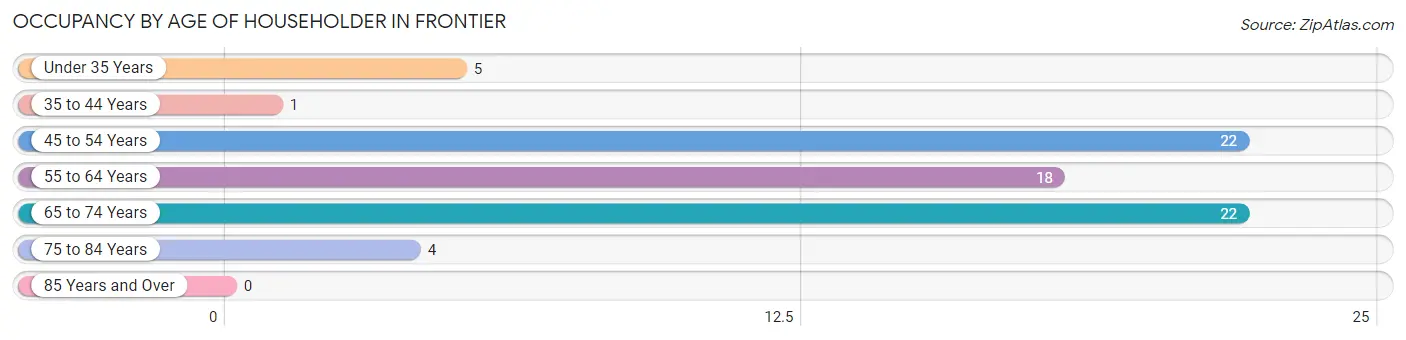
| Age Bracket | # Households | % Households |
| Under 35 Years | 5 | 6.9% |
| 35 to 44 Years | 1 | 1.4% |
| 45 to 54 Years | 22 | 30.6% |
| 55 to 64 Years | 18 | 25.0% |
| 65 to 74 Years | 22 | 30.6% |
| 75 to 84 Years | 4 | 5.6% |
| 85 Years and Over | 0 | 0.0% |
| Total | 72 | 100.0% |
Housing Finances in Frontier
Median Income by Occupancy in Frontier
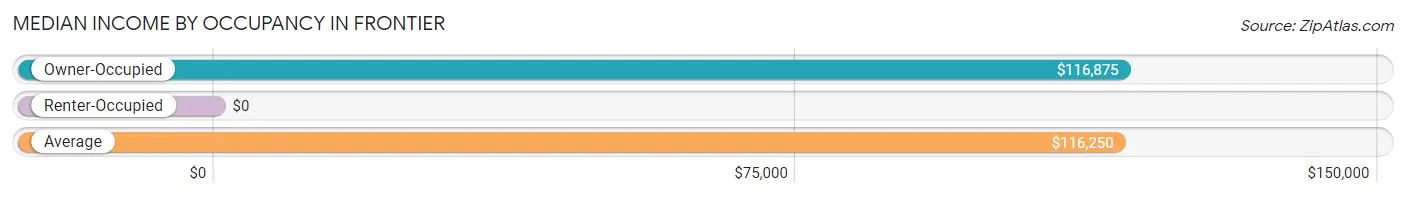
| Occupancy Type | # Households | Median Income |
| Owner-Occupied | 71 (98.6%) | $116,875 |
| Renter-Occupied | 1 (1.4%) | $0 |
| Average | 72 (100.0%) | $116,250 |
Occupancy by Householder Income Bracket in Frontier
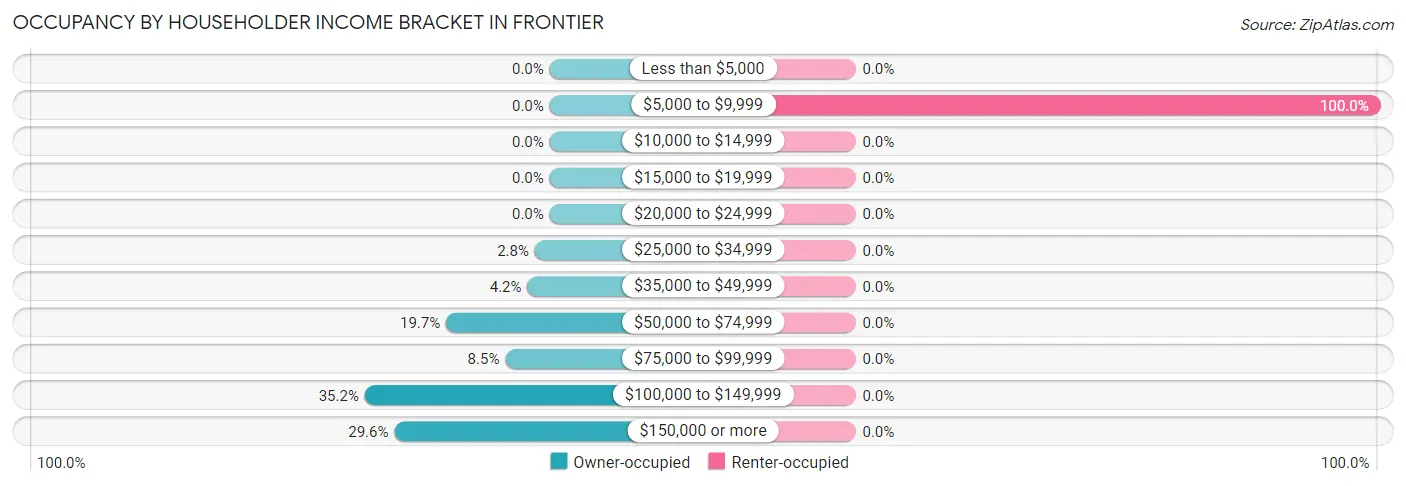
| Income Bracket | Owner-occupied | Renter-occupied |
| Less than $5,000 | 0 (0.0%) | 0 (0.0%) |
| $5,000 to $9,999 | 0 (0.0%) | 1 (100.0%) |
| $10,000 to $14,999 | 0 (0.0%) | 0 (0.0%) |
| $15,000 to $19,999 | 0 (0.0%) | 0 (0.0%) |
| $20,000 to $24,999 | 0 (0.0%) | 0 (0.0%) |
| $25,000 to $34,999 | 2 (2.8%) | 0 (0.0%) |
| $35,000 to $49,999 | 3 (4.2%) | 0 (0.0%) |
| $50,000 to $74,999 | 14 (19.7%) | 0 (0.0%) |
| $75,000 to $99,999 | 6 (8.5%) | 0 (0.0%) |
| $100,000 to $149,999 | 25 (35.2%) | 0 (0.0%) |
| $150,000 or more | 21 (29.6%) | 0 (0.0%) |
| Total | 71 (100.0%) | 1 (100.0%) |
Monthly Housing Cost Tiers in Frontier
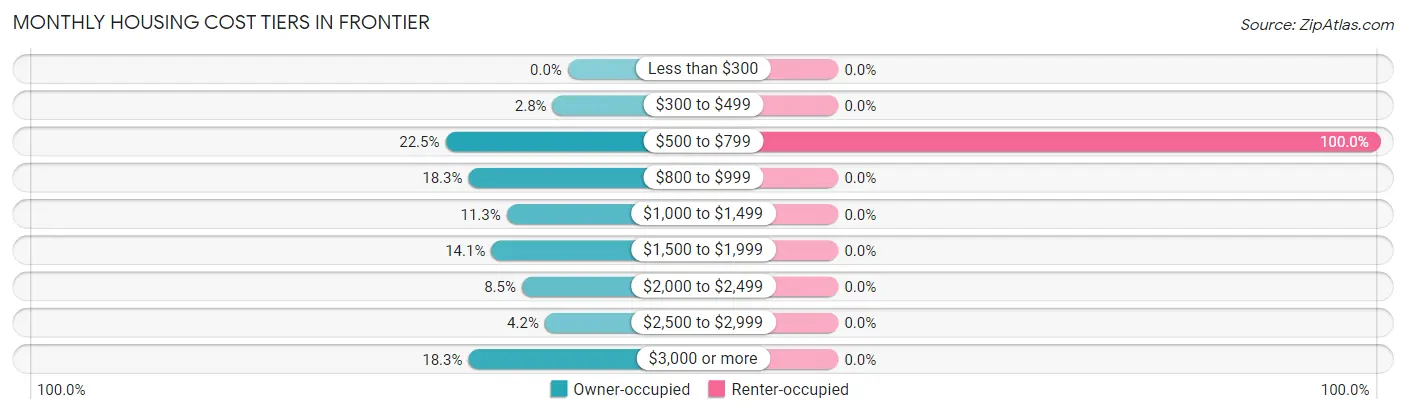
| Monthly Cost | Owner-occupied | Renter-occupied |
| Less than $300 | 0 (0.0%) | 0 (0.0%) |
| $300 to $499 | 2 (2.8%) | 0 (0.0%) |
| $500 to $799 | 16 (22.5%) | 1 (100.0%) |
| $800 to $999 | 13 (18.3%) | 0 (0.0%) |
| $1,000 to $1,499 | 8 (11.3%) | 0 (0.0%) |
| $1,500 to $1,999 | 10 (14.1%) | 0 (0.0%) |
| $2,000 to $2,499 | 6 (8.5%) | 0 (0.0%) |
| $2,500 to $2,999 | 3 (4.2%) | 0 (0.0%) |
| $3,000 or more | 13 (18.3%) | 0 (0.0%) |
| Total | 71 (100.0%) | 1 (100.0%) |
Physical Housing Characteristics in Frontier
Housing Structures in Frontier
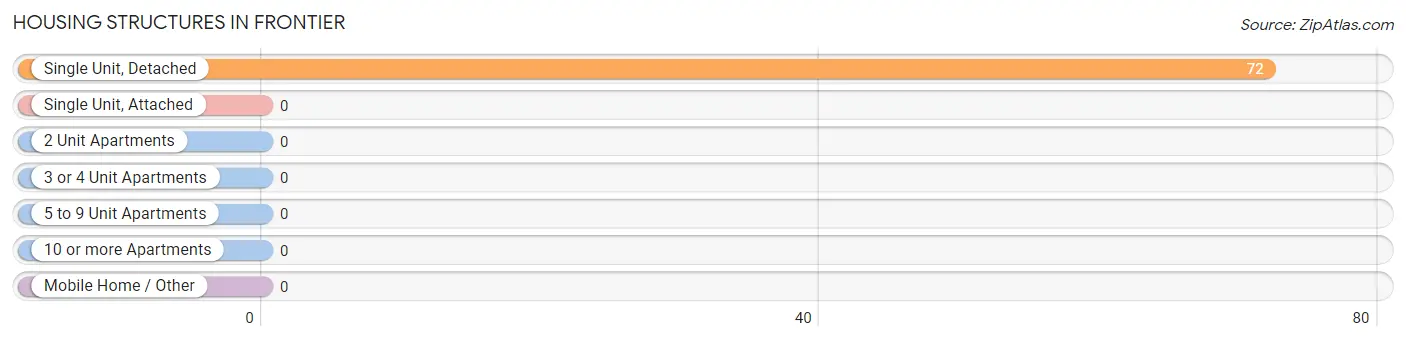
| Structure Type | # Housing Units | % Housing Units |
| Single Unit, Detached | 72 | 100.0% |
| Single Unit, Attached | 0 | 0.0% |
| 2 Unit Apartments | 0 | 0.0% |
| 3 or 4 Unit Apartments | 0 | 0.0% |
| 5 to 9 Unit Apartments | 0 | 0.0% |
| 10 or more Apartments | 0 | 0.0% |
| Mobile Home / Other | 0 | 0.0% |
| Total | 72 | 100.0% |
Housing Structures by Occupancy in Frontier
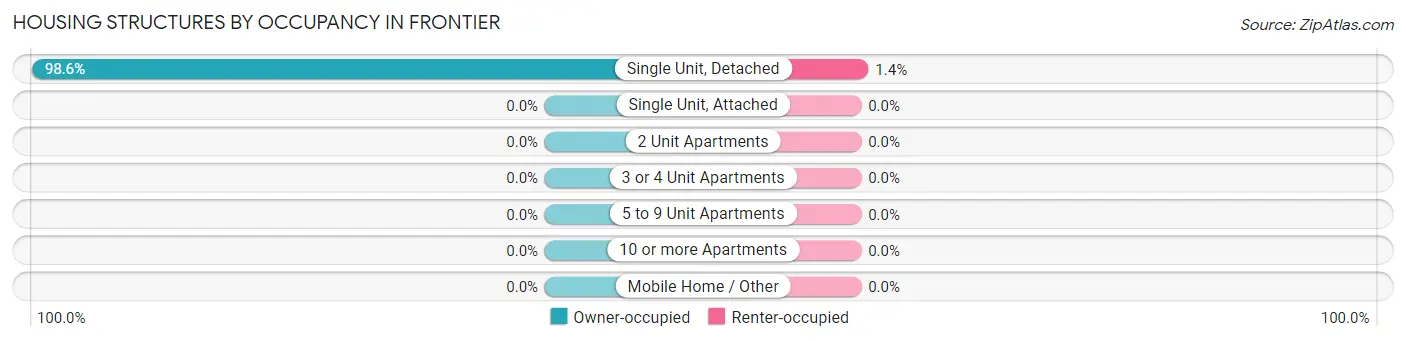
| Structure Type | Owner-occupied | Renter-occupied |
| Single Unit, Detached | 71 (98.6%) | 1 (1.4%) |
| Single Unit, Attached | 0 (0.0%) | 0 (0.0%) |
| 2 Unit Apartments | 0 (0.0%) | 0 (0.0%) |
| 3 or 4 Unit Apartments | 0 (0.0%) | 0 (0.0%) |
| 5 to 9 Unit Apartments | 0 (0.0%) | 0 (0.0%) |
| 10 or more Apartments | 0 (0.0%) | 0 (0.0%) |
| Mobile Home / Other | 0 (0.0%) | 0 (0.0%) |
| Total | 71 (98.6%) | 1 (1.4%) |
Housing Structures by Number of Rooms in Frontier
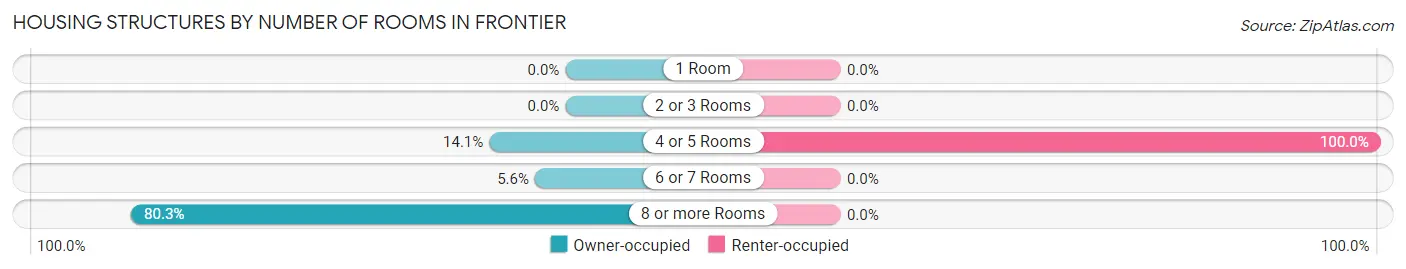
| Number of Rooms | Owner-occupied | Renter-occupied |
| 1 Room | 0 (0.0%) | 0 (0.0%) |
| 2 or 3 Rooms | 0 (0.0%) | 0 (0.0%) |
| 4 or 5 Rooms | 10 (14.1%) | 1 (100.0%) |
| 6 or 7 Rooms | 4 (5.6%) | 0 (0.0%) |
| 8 or more Rooms | 57 (80.3%) | 0 (0.0%) |
| Total | 71 (100.0%) | 1 (100.0%) |
Housing Structure by Heating Type in Frontier
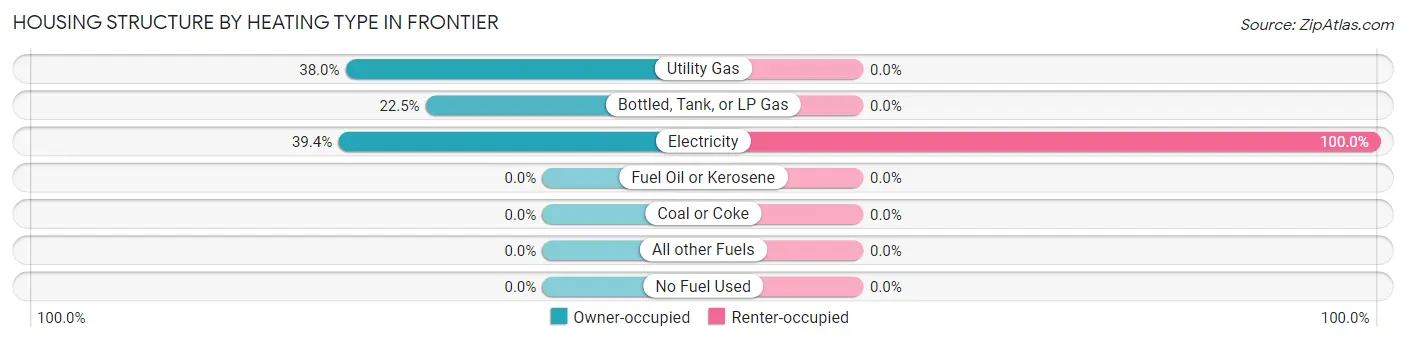
| Heating Type | Owner-occupied | Renter-occupied |
| Utility Gas | 27 (38.0%) | 0 (0.0%) |
| Bottled, Tank, or LP Gas | 16 (22.5%) | 0 (0.0%) |
| Electricity | 28 (39.4%) | 1 (100.0%) |
| Fuel Oil or Kerosene | 0 (0.0%) | 0 (0.0%) |
| Coal or Coke | 0 (0.0%) | 0 (0.0%) |
| All other Fuels | 0 (0.0%) | 0 (0.0%) |
| No Fuel Used | 0 (0.0%) | 0 (0.0%) |
| Total | 71 (100.0%) | 1 (100.0%) |
Household Vehicle Usage in Frontier
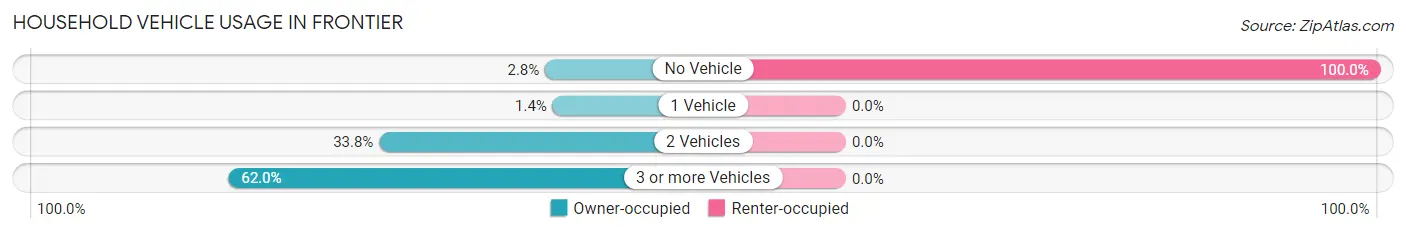
| Vehicles per Household | Owner-occupied | Renter-occupied |
| No Vehicle | 2 (2.8%) | 1 (100.0%) |
| 1 Vehicle | 1 (1.4%) | 0 (0.0%) |
| 2 Vehicles | 24 (33.8%) | 0 (0.0%) |
| 3 or more Vehicles | 44 (62.0%) | 0 (0.0%) |
| Total | 71 (100.0%) | 1 (100.0%) |
Real Estate & Mortgages in Frontier
Real Estate and Mortgage Overview in Frontier
| Characteristic | Without Mortgage | With Mortgage |
| Housing Units | 38 | 33 |
| Median Property Value | $378,300 | $365,000 |
| Median Household Income | $94,375 | $20 |
| Monthly Housing Costs | $833 | $13 |
| Real Estate Taxes | $3,545 | $0 |
Property Value by Mortgage Status in Frontier
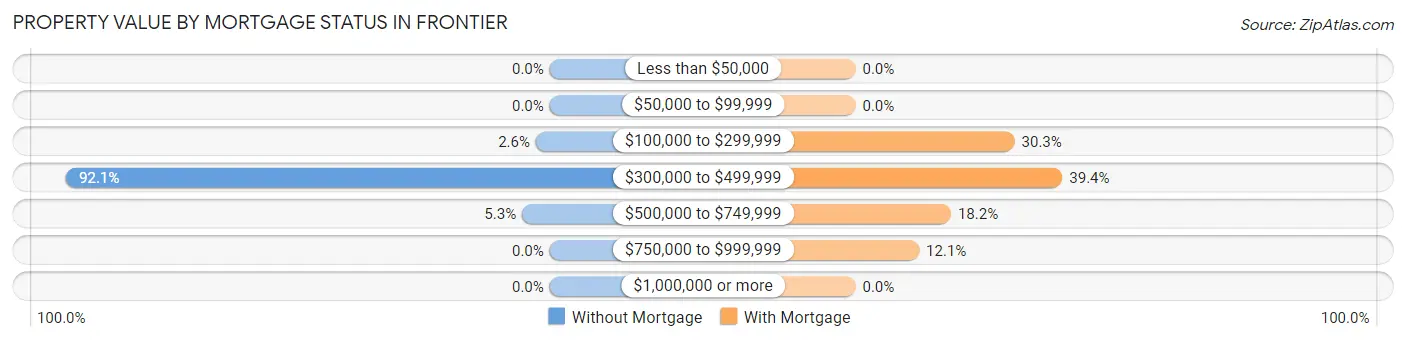
| Property Value | Without Mortgage | With Mortgage |
| Less than $50,000 | 0 (0.0%) | 0 (0.0%) |
| $50,000 to $99,999 | 0 (0.0%) | 0 (0.0%) |
| $100,000 to $299,999 | 1 (2.6%) | 10 (30.3%) |
| $300,000 to $499,999 | 35 (92.1%) | 13 (39.4%) |
| $500,000 to $749,999 | 2 (5.3%) | 6 (18.2%) |
| $750,000 to $999,999 | 0 (0.0%) | 4 (12.1%) |
| $1,000,000 or more | 0 (0.0%) | 0 (0.0%) |
| Total | 38 (100.0%) | 33 (100.0%) |
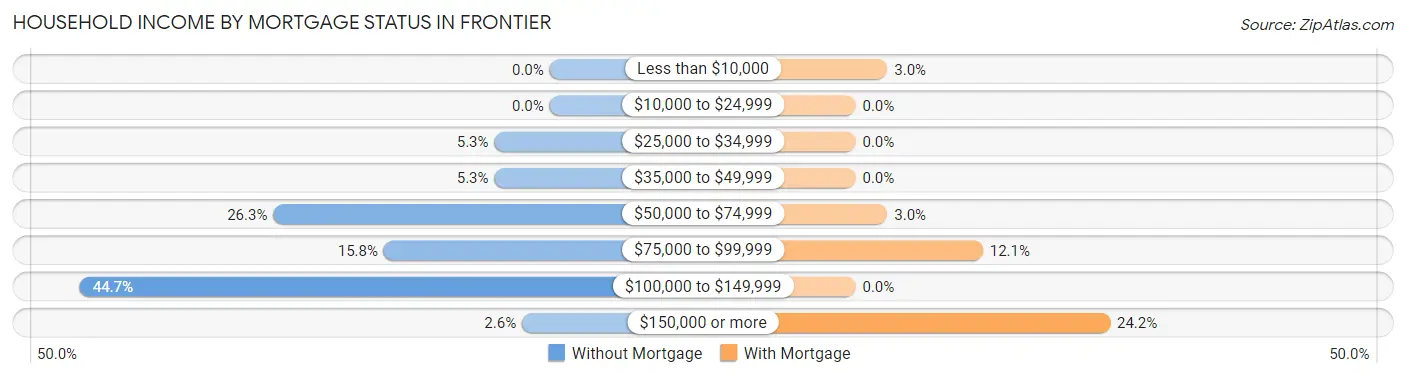
Household Income by Mortgage Status in Frontier
| Household Income | Without Mortgage | With Mortgage |
| Less than $10,000 | 0 (0.0%) | 1 (3.0%) |
| $10,000 to $24,999 | 0 (0.0%) | 0 (0.0%) |
| $25,000 to $34,999 | 2 (5.3%) | 0 (0.0%) |
| $35,000 to $49,999 | 2 (5.3%) | 0 (0.0%) |
| $50,000 to $74,999 | 10 (26.3%) | 1 (3.0%) |
| $75,000 to $99,999 | 6 (15.8%) | 4 (12.1%) |
| $100,000 to $149,999 | 17 (44.7%) | 0 (0.0%) |
| $150,000 or more | 1 (2.6%) | 8 (24.2%) |
| Total | 38 (100.0%) | 33 (100.0%) |
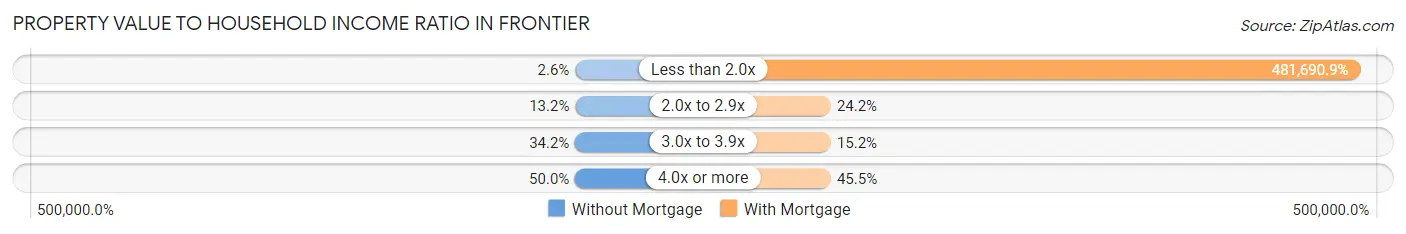
Property Value to Household Income Ratio in Frontier
| Value-to-Income Ratio | Without Mortgage | With Mortgage |
| Less than 2.0x | 1 (2.6%) | 158,958 (481,690.9%) |
| 2.0x to 2.9x | 5 (13.2%) | 8 (24.2%) |
| 3.0x to 3.9x | 13 (34.2%) | 5 (15.1%) |
| 4.0x or more | 19 (50.0%) | 15 (45.5%) |
| Total | 38 (100.0%) | 33 (100.0%) |
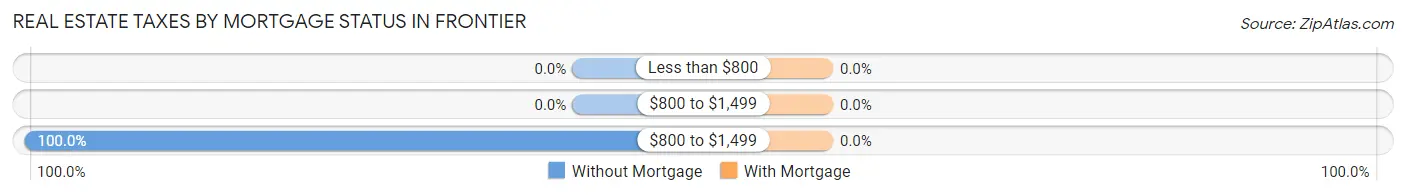
Real Estate Taxes by Mortgage Status in Frontier
| Property Taxes | Without Mortgage | With Mortgage |
| Less than $800 | 0 (0.0%) | 0 (0.0%) |
| $800 to $1,499 | 0 (0.0%) | 0 (0.0%) |
| $800 to $1,499 | 38 (100.0%) | 0 (0.0%) |
| Total | 38 (100.0%) | 33 (100.0%) |
Health & Disability in Frontier
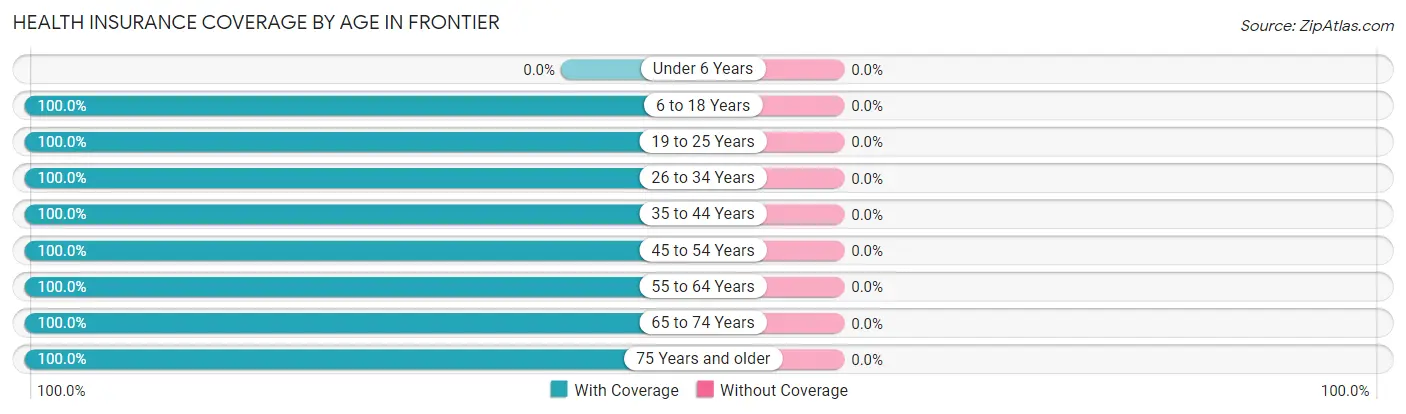
Health Insurance Coverage by Age in Frontier
| Age Bracket | With Coverage | Without Coverage |
| Under 6 Years | 0 (0.0%) | 0 (0.0%) |
| 6 to 18 Years | 7 (100.0%) | 0 (0.0%) |
| 19 to 25 Years | 25 (100.0%) | 0 (0.0%) |
| 26 to 34 Years | 9 (100.0%) | 0 (0.0%) |
| 35 to 44 Years | 1 (100.0%) | 0 (0.0%) |
| 45 to 54 Years | 42 (100.0%) | 0 (0.0%) |
| 55 to 64 Years | 33 (100.0%) | 0 (0.0%) |
| 65 to 74 Years | 49 (100.0%) | 0 (0.0%) |
| 75 Years and older | 9 (100.0%) | 0 (0.0%) |
| Total | 175 (100.0%) | 0 (0.0%) |
Health Insurance Coverage by Citizenship Status in Frontier
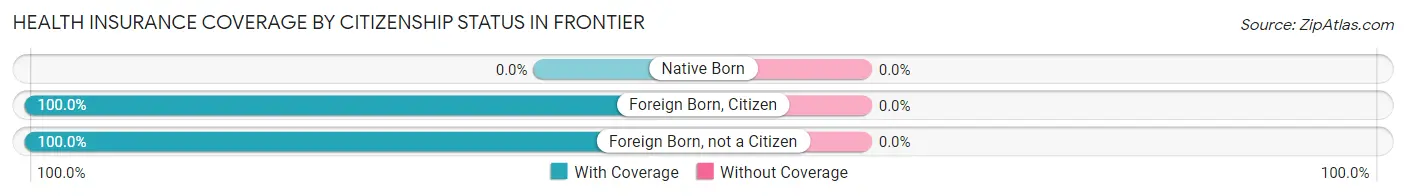
| Citizenship Status | With Coverage | Without Coverage |
| Native Born | 0 (0.0%) | 0 (0.0%) |
| Foreign Born, Citizen | 7 (100.0%) | 0 (0.0%) |
| Foreign Born, not a Citizen | 25 (100.0%) | 0 (0.0%) |
Health Insurance Coverage by Household Income in Frontier
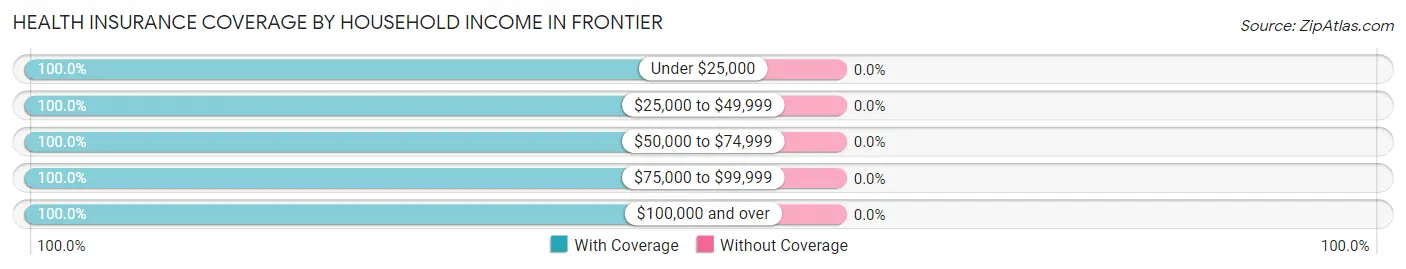
| Household Income | With Coverage | Without Coverage |
| Under $25,000 | 1 (100.0%) | 0 (0.0%) |
| $25,000 to $49,999 | 9 (100.0%) | 0 (0.0%) |
| $50,000 to $74,999 | 28 (100.0%) | 0 (0.0%) |
| $75,000 to $99,999 | 15 (100.0%) | 0 (0.0%) |
| $100,000 and over | 122 (100.0%) | 0 (0.0%) |
Public vs Private Health Insurance Coverage by Age in Frontier
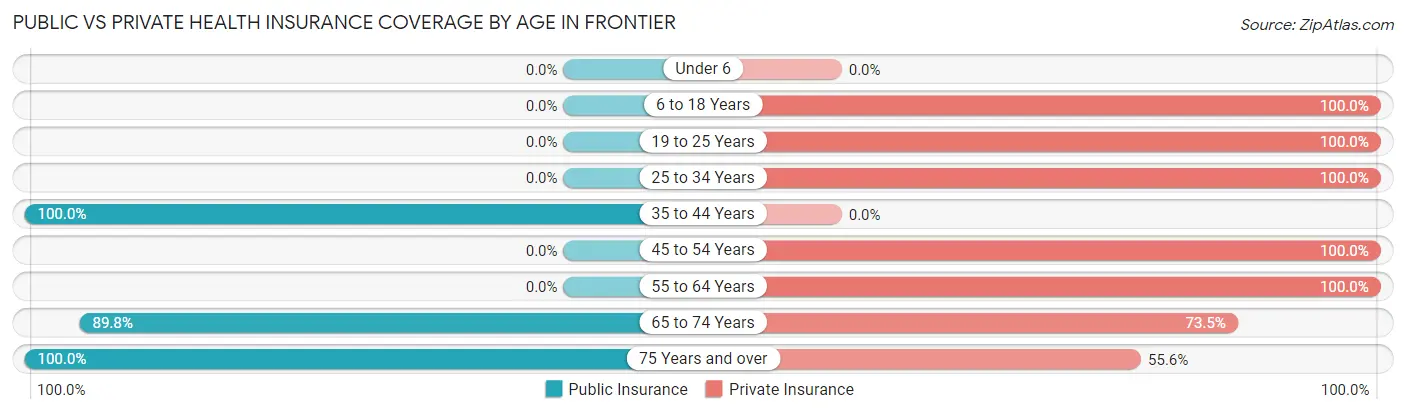
| Age Bracket | Public Insurance | Private Insurance |
| Under 6 | 0 (0.0%) | 0 (0.0%) |
| 6 to 18 Years | 0 (0.0%) | 7 (100.0%) |
| 19 to 25 Years | 0 (0.0%) | 25 (100.0%) |
| 25 to 34 Years | 0 (0.0%) | 9 (100.0%) |
| 35 to 44 Years | 1 (100.0%) | 0 (0.0%) |
| 45 to 54 Years | 0 (0.0%) | 42 (100.0%) |
| 55 to 64 Years | 0 (0.0%) | 33 (100.0%) |
| 65 to 74 Years | 44 (89.8%) | 36 (73.5%) |
| 75 Years and over | 9 (100.0%) | 5 (55.6%) |
| Total | 54 (30.9%) | 157 (89.7%) |
Disability Status by Sex by Age in Frontier
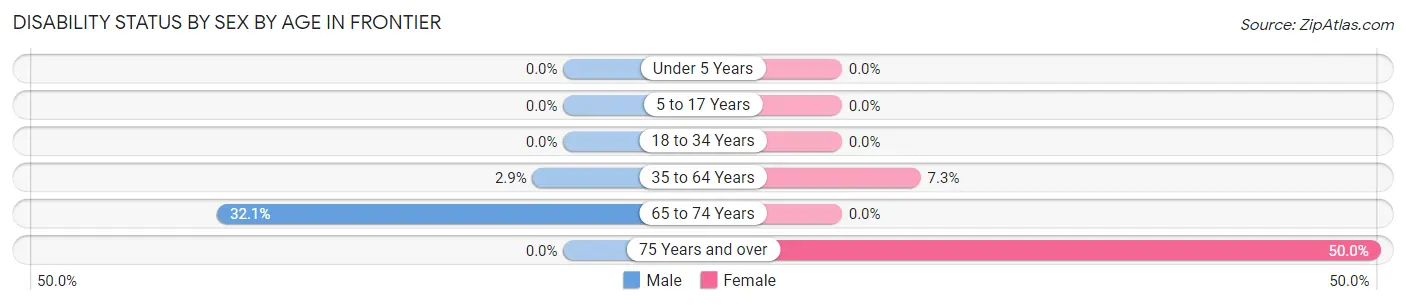
| Age Bracket | Male | Female |
| Under 5 Years | 0 (0.0%) | 0 (0.0%) |
| 5 to 17 Years | 0 (0.0%) | 0 (0.0%) |
| 18 to 34 Years | 0 (0.0%) | 0 (0.0%) |
| 35 to 64 Years | 1 (2.9%) | 3 (7.3%) |
| 65 to 74 Years | 9 (32.1%) | 0 (0.0%) |
| 75 Years and over | 0 (0.0%) | 2 (50.0%) |
Disability Class by Sex by Age in Frontier
Disability Class: Hearing Difficulty
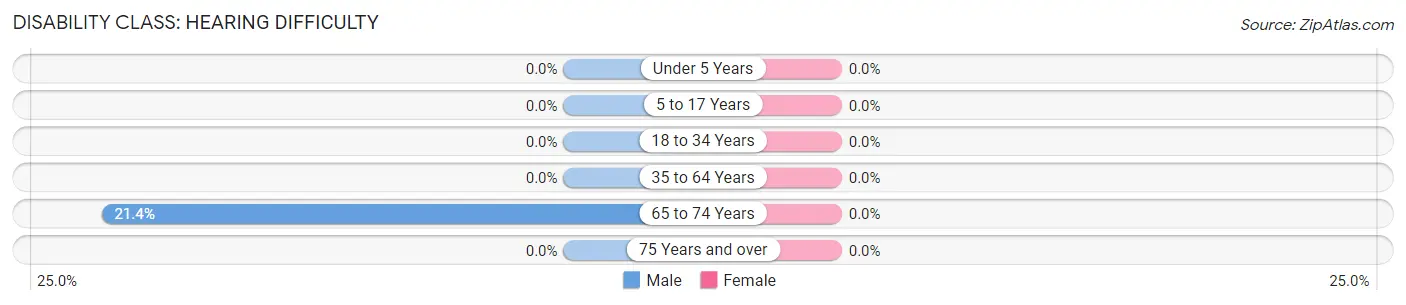
| Age Bracket | Male | Female |
| Under 5 Years | 0 (0.0%) | 0 (0.0%) |
| 5 to 17 Years | 0 (0.0%) | 0 (0.0%) |
| 18 to 34 Years | 0 (0.0%) | 0 (0.0%) |
| 35 to 64 Years | 0 (0.0%) | 0 (0.0%) |
| 65 to 74 Years | 6 (21.4%) | 0 (0.0%) |
| 75 Years and over | 0 (0.0%) | 0 (0.0%) |
Disability Class: Vision Difficulty
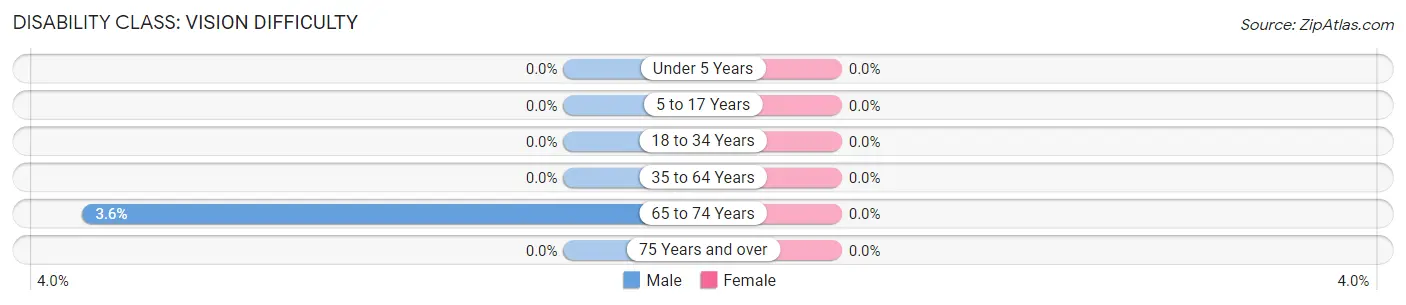
| Age Bracket | Male | Female |
| Under 5 Years | 0 (0.0%) | 0 (0.0%) |
| 5 to 17 Years | 0 (0.0%) | 0 (0.0%) |
| 18 to 34 Years | 0 (0.0%) | 0 (0.0%) |
| 35 to 64 Years | 0 (0.0%) | 0 (0.0%) |
| 65 to 74 Years | 1 (3.6%) | 0 (0.0%) |
| 75 Years and over | 0 (0.0%) | 0 (0.0%) |
Disability Class: Cognitive Difficulty
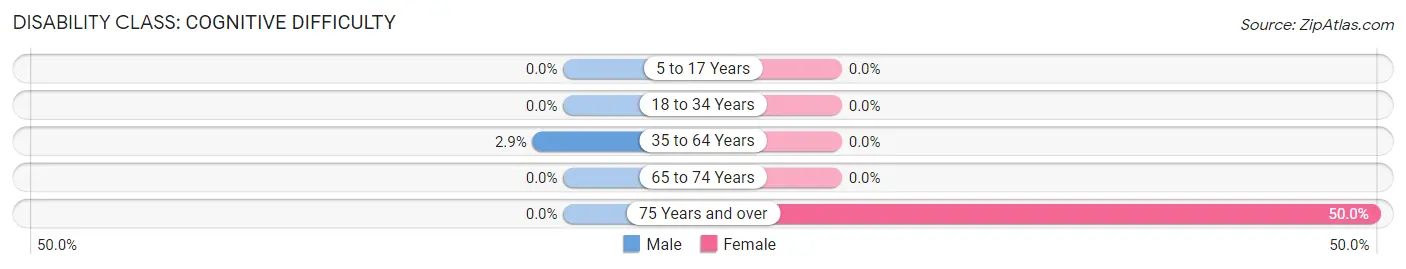
| Age Bracket | Male | Female |
| 5 to 17 Years | 0 (0.0%) | 0 (0.0%) |
| 18 to 34 Years | 0 (0.0%) | 0 (0.0%) |
| 35 to 64 Years | 1 (2.9%) | 0 (0.0%) |
| 65 to 74 Years | 0 (0.0%) | 0 (0.0%) |
| 75 Years and over | 0 (0.0%) | 2 (50.0%) |
Disability Class: Ambulatory Difficulty
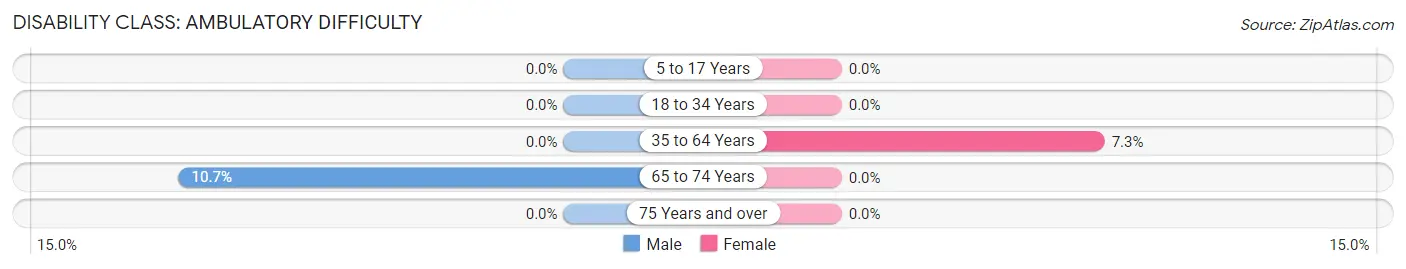
| Age Bracket | Male | Female |
| 5 to 17 Years | 0 (0.0%) | 0 (0.0%) |
| 18 to 34 Years | 0 (0.0%) | 0 (0.0%) |
| 35 to 64 Years | 0 (0.0%) | 3 (7.3%) |
| 65 to 74 Years | 3 (10.7%) | 0 (0.0%) |
| 75 Years and over | 0 (0.0%) | 0 (0.0%) |
Disability Class: Self-Care Difficulty
| Age Bracket | Male | Female |
| 5 to 17 Years | 0 (0.0%) | 0 (0.0%) |
| 18 to 34 Years | 0 (0.0%) | 0 (0.0%) |
| 35 to 64 Years | 0 (0.0%) | 0 (0.0%) |
| 65 to 74 Years | 0 (0.0%) | 0 (0.0%) |
| 75 Years and over | 0 (0.0%) | 0 (0.0%) |
Technology Access in Frontier
Computing Device Access in Frontier
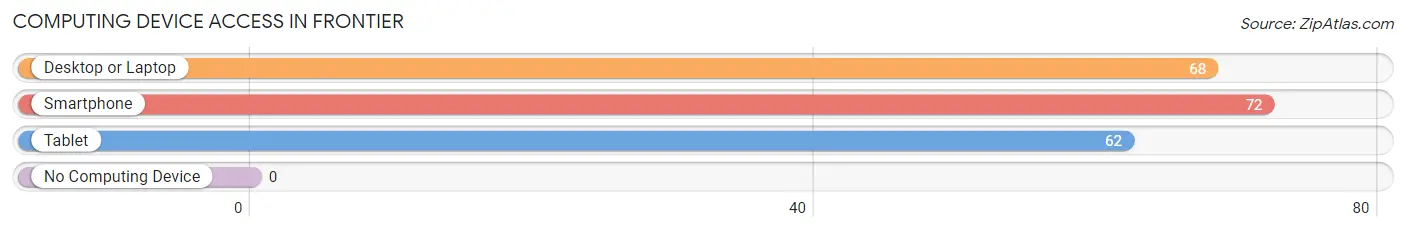
| Device Type | # Households | % Households |
| Desktop or Laptop | 68 | 94.4% |
| Smartphone | 72 | 100.0% |
| Tablet | 62 | 86.1% |
| No Computing Device | 0 | 0.0% |
| Total | 72 | 100.0% |
Internet Access in Frontier
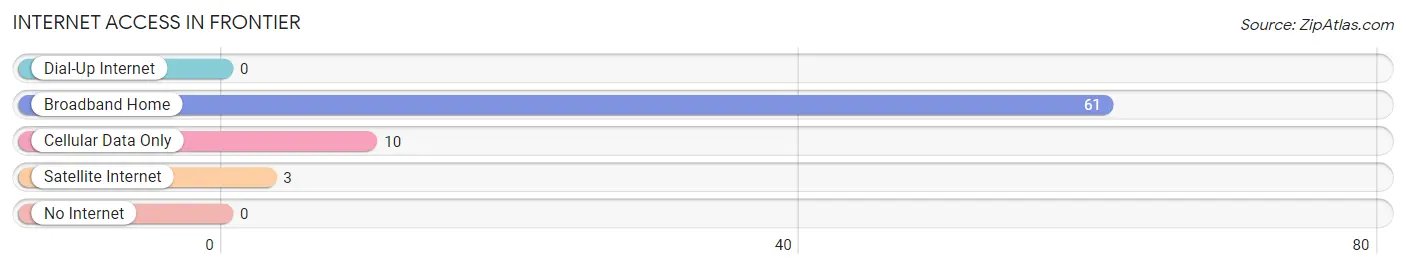
| Internet Type | # Households | % Households |
| Dial-Up Internet | 0 | 0.0% |
| Broadband Home | 61 | 84.7% |
| Cellular Data Only | 10 | 13.9% |
| Satellite Internet | 3 | 4.2% |
| No Internet | 0 | 0.0% |
| Total | 72 | 100.0% |
Frontier Summary
Frontier, North Dakota is a small town located in the southwestern corner of the state. It is situated in the heart of the Missouri Plateau, a region of rolling hills and prairies. The town is located in Divide County, which is part of the larger Williston Basin. The population of Frontier in 2000 was estimated to be around 200 people.
Geography
Frontier is located in the Missouri Plateau, a region of rolling hills and prairies. The town is situated in Divide County, which is part of the larger Williston Basin. The town is located in the extreme southwestern corner of the state, near the Montana border. The town is situated on the banks of the Missouri River, which provides a natural boundary between North Dakota and Montana. The town is surrounded by a variety of natural features, including the Little Missouri National Grassland, the Little Missouri River, and the Missouri River.
Economy
The economy of Frontier is largely based on agriculture. The town is home to a variety of farms, which produce a variety of crops, including wheat, corn, and soybeans. The town is also home to a number of small businesses, including a grocery store, a hardware store, and a gas station. The town is also home to a number of small manufacturing businesses, which produce a variety of products, including furniture, clothing, and tools.
Demographics
The population of Frontier in 2000 was estimated to be around 200 people. The town is predominantly white, with a small minority population. The median household income in 2000 was estimated to be around $30,000. The town is home to a variety of religious denominations, including Lutheran, Catholic, and Methodist.
History
Frontier was founded in 1882 by a group of settlers from Minnesota. The town was originally named “Frontier City”, but the name was later changed to “Frontier”. The town was originally a farming community, but it soon became a center for the oil and gas industry. The town was also home to a number of small businesses, including a grocery store, a hardware store, and a gas station. The town was also home to a number of small manufacturing businesses, which produced a variety of products, including furniture, clothing, and tools.
In the late 20th century, the town began to experience a decline in population. This was due to a number of factors, including the decline of the oil and gas industry, the closure of many of the town’s small businesses, and the out-migration of many of the town’s residents. Despite this decline, the town has managed to maintain its small-town charm and is still home to a number of small businesses and farms.
Conclusion
Frontier, North Dakota is a small town located in the southwestern corner of the state. It is situated in the heart of the Missouri Plateau, a region of rolling hills and prairies. The town is home to a variety of farms, small businesses, and manufacturing businesses. The population of Frontier in 2000 was estimated to be around 200 people. The town is predominantly white, with a small minority population. The town has experienced a decline in population in recent years, but it has managed to maintain its small-town charm and is still home to a number of small businesses and farms.
Common Questions
What is Per Capita Income in Frontier?
Per Capita income in Frontier is $56,857.
What is the Median Family Income in Frontier?
Median Family Income in Frontier is $122,750.
What is the Median Household income in Frontier?
Median Household Income in Frontier is $116,250.
What is Income or Wage Gap in Frontier?
Income or Wage Gap in Frontier is 45.1%.
Women in Frontier earn 54.9 cents for every dollar earned by a man.
What is Inequality or Gini Index in Frontier?
Inequality or Gini Index in Frontier is 0.33.
What is the Total Population of Frontier?
Total Population of Frontier is 175.
What is the Total Male Population of Frontier?
Total Male Population of Frontier is 84.
What is the Total Female Population of Frontier?
Total Female Population of Frontier is 91.
What is the Ratio of Males per 100 Females in Frontier?
There are 92.31 Males per 100 Females in Frontier.
What is the Ratio of Females per 100 Males in Frontier?
There are 108.33 Females per 100 Males in Frontier.
What is the Median Population Age in Frontier?
Median Population Age in Frontier is 59.0 Years.
What is the Average Family Size in Frontier
Average Family Size in Frontier is 2.5 People.
What is the Average Household Size in Frontier
Average Household Size in Frontier is 2.4 People.
How Large is the Labor Force in Frontier?
There are 109 People in the Labor Forcein in Frontier.
What is the Percentage of People in the Labor Force in Frontier?
62.3% of People are in the Labor Force in Frontier.
What is the Unemployment Rate in Frontier?
Unemployment Rate in Frontier is 6.4%.