Cavalier, ND Map & Demographics
Cavalier Map
Cavalier Overview
$42,409
PER CAPITA INCOME
$87,847
AVG FAMILY INCOME
$55,387
AVG HOUSEHOLD INCOME
39.7%
WAGE / INCOME GAP [ % ]
60.3¢/ $1
WAGE / INCOME GAP [ $ ]
0.47
INEQUALITY / GINI INDEX
1,360
TOTAL POPULATION
590
MALE POPULATION
770
FEMALE POPULATION
76.62
MALES / 100 FEMALES
130.51
FEMALES / 100 MALES
43.4
MEDIAN AGE
2.8
AVG FAMILY SIZE
2.0
AVG HOUSEHOLD SIZE
721
LABOR FORCE [ PEOPLE ]
65.0%
PERCENT IN LABOR FORCE
10.4%
UNEMPLOYMENT RATE
Cavalier Zip Codes
Cavalier Area Codes
Income in Cavalier
Income Overview in Cavalier
Per Capita Income in Cavalier is $42,409, while median incomes of families and households are $87,847 and $55,387 respectively.
| Characteristic | Number | Measure |
| Per Capita Income | 1,360 | $42,409 |
| Median Family Income | 365 | $87,847 |
| Mean Family Income | 365 | $106,114 |
| Median Household Income | 641 | $55,387 |
| Mean Household Income | 641 | $83,795 |
| Income Deficit | 365 | $0 |
| Wage / Income Gap (%) | 1,360 | 39.68% |
| Wage / Income Gap ($) | 1,360 | 60.32¢ per $1 |
| Gini / Inequality Index | 1,360 | 0.47 |
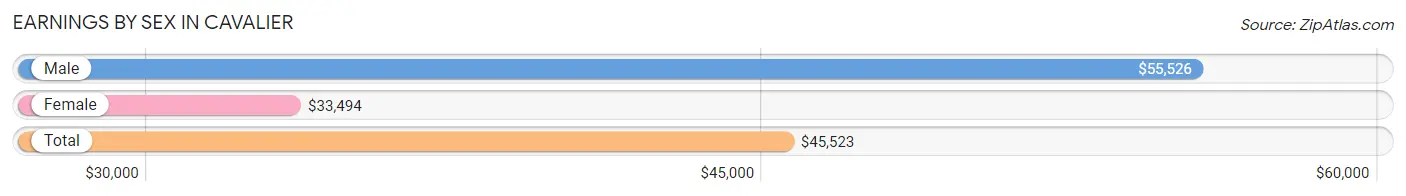
Earnings by Sex in Cavalier
Average Earnings in Cavalier are $45,523, $55,526 for men and $33,494 for women, a difference of 39.7%.
| Sex | Number | Average Earnings |
| Male | 400 (50.7%) | $55,526 |
| Female | 389 (49.3%) | $33,494 |
| Total | 789 (100.0%) | $45,523 |
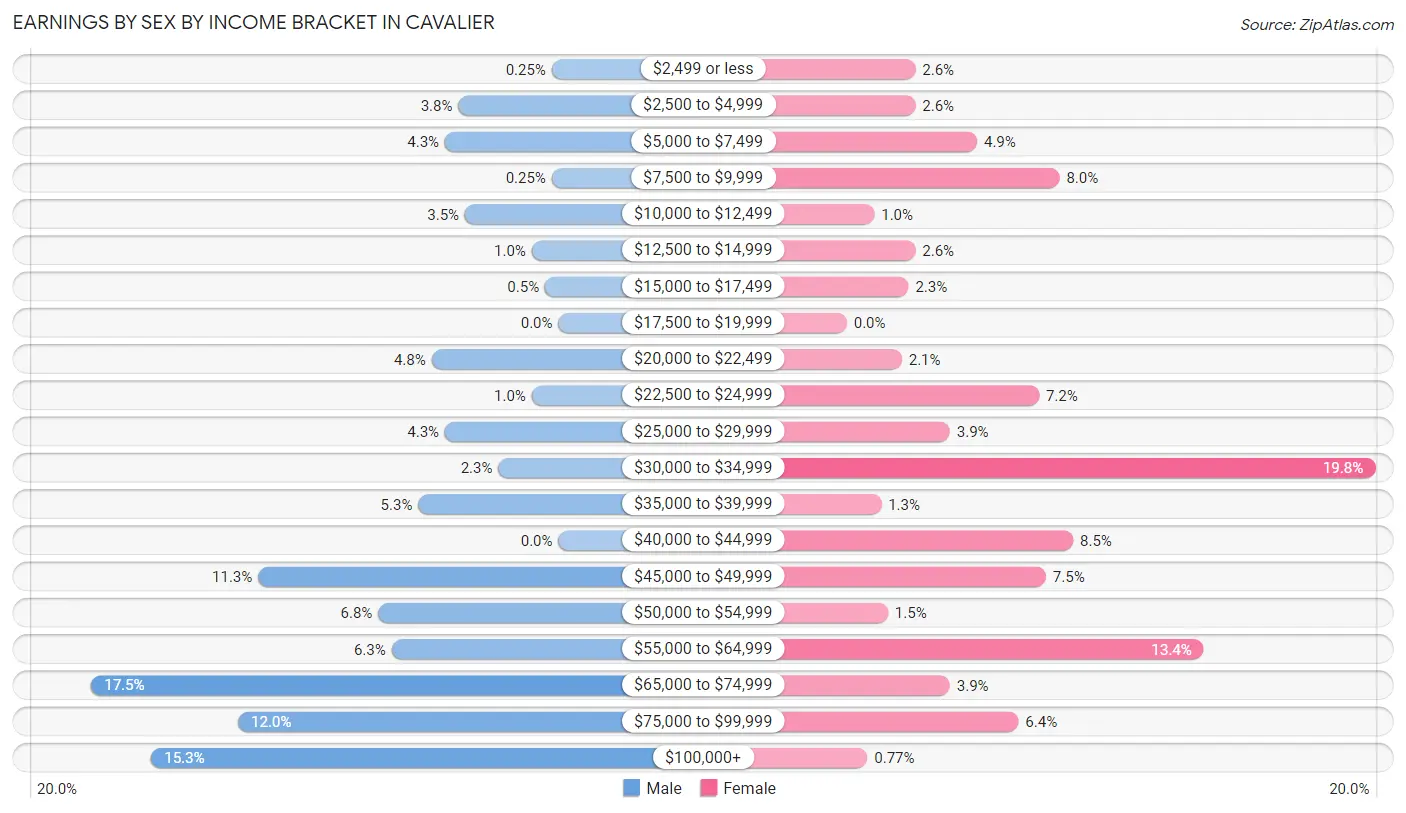
Earnings by Sex by Income Bracket in Cavalier
The most common earnings brackets in Cavalier are $65,000 to $74,999 for men (70 | 17.5%) and $30,000 to $34,999 for women (77 | 19.8%).
| Income | Male | Female |
| $2,499 or less | 1 (0.3%) | 10 (2.6%) |
| $2,500 to $4,999 | 15 (3.7%) | 10 (2.6%) |
| $5,000 to $7,499 | 17 (4.3%) | 19 (4.9%) |
| $7,500 to $9,999 | 1 (0.3%) | 31 (8.0%) |
| $10,000 to $12,499 | 14 (3.5%) | 4 (1.0%) |
| $12,500 to $14,999 | 4 (1.0%) | 10 (2.6%) |
| $15,000 to $17,499 | 2 (0.5%) | 9 (2.3%) |
| $17,500 to $19,999 | 0 (0.0%) | 0 (0.0%) |
| $20,000 to $22,499 | 19 (4.8%) | 8 (2.1%) |
| $22,500 to $24,999 | 4 (1.0%) | 28 (7.2%) |
| $25,000 to $29,999 | 17 (4.3%) | 15 (3.9%) |
| $30,000 to $34,999 | 9 (2.2%) | 77 (19.8%) |
| $35,000 to $39,999 | 21 (5.2%) | 5 (1.3%) |
| $40,000 to $44,999 | 0 (0.0%) | 33 (8.5%) |
| $45,000 to $49,999 | 45 (11.3%) | 29 (7.5%) |
| $50,000 to $54,999 | 27 (6.8%) | 6 (1.5%) |
| $55,000 to $64,999 | 25 (6.2%) | 52 (13.4%) |
| $65,000 to $74,999 | 70 (17.5%) | 15 (3.9%) |
| $75,000 to $99,999 | 48 (12.0%) | 25 (6.4%) |
| $100,000+ | 61 (15.2%) | 3 (0.8%) |
| Total | 400 (100.0%) | 389 (100.0%) |
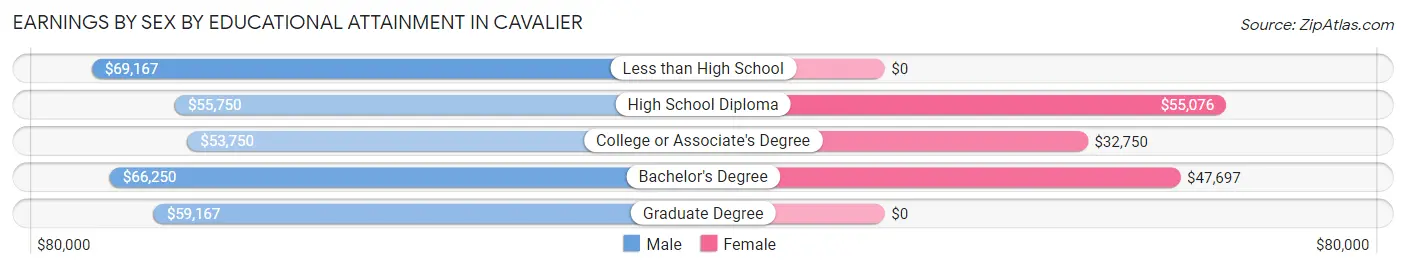
Earnings by Sex by Educational Attainment in Cavalier
Average earnings in Cavalier are $57,303 for men and $34,801 for women, a difference of 39.3%. Men with an educational attainment of less than high school enjoy the highest average annual earnings of $69,167, while those with college or associate's degree education earn the least with $53,750. Women with an educational attainment of high school diploma earn the most with the average annual earnings of $55,076, while those with college or associate's degree education have the smallest earnings of $32,750.
| Educational Attainment | Male Income | Female Income |
| Less than High School | $69,167 | $0 |
| High School Diploma | $55,750 | $55,076 |
| College or Associate's Degree | $53,750 | $32,750 |
| Bachelor's Degree | $66,250 | $47,697 |
| Graduate Degree | $59,167 | $0 |
| Total | $57,303 | $34,801 |
Family Income in Cavalier
Family Income Brackets in Cavalier
According to the Cavalier family income data, there are 66 families falling into the $75,000 to $99,999 income range, which is the most common income bracket and makes up 18.1% of all families. Conversely, the less than $10,000 income bracket is the least frequent group with only 2 families (0.5%) belonging to this category.
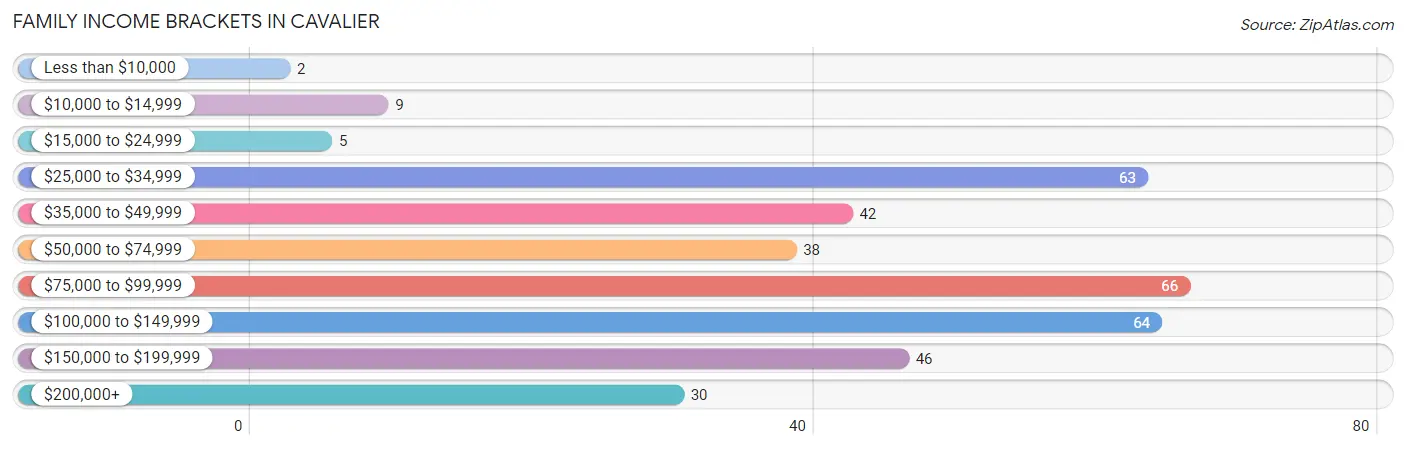
| Income Bracket | # Families | % Families |
| Less than $10,000 | 2 | 0.5% |
| $10,000 to $14,999 | 9 | 2.5% |
| $15,000 to $24,999 | 5 | 1.4% |
| $25,000 to $34,999 | 63 | 17.3% |
| $35,000 to $49,999 | 42 | 11.5% |
| $50,000 to $74,999 | 38 | 10.4% |
| $75,000 to $99,999 | 66 | 18.1% |
| $100,000 to $149,999 | 64 | 17.5% |
| $150,000 to $199,999 | 46 | 12.6% |
| $200,000+ | 30 | 8.2% |
Family Income by Famaliy Size in Cavalier
3-person families (33 | 9.0%) account for the highest median family income in Cavalier with $109,063 per family, while 2-person families (183 | 50.1%) have the highest median income of $44,375 per family member.
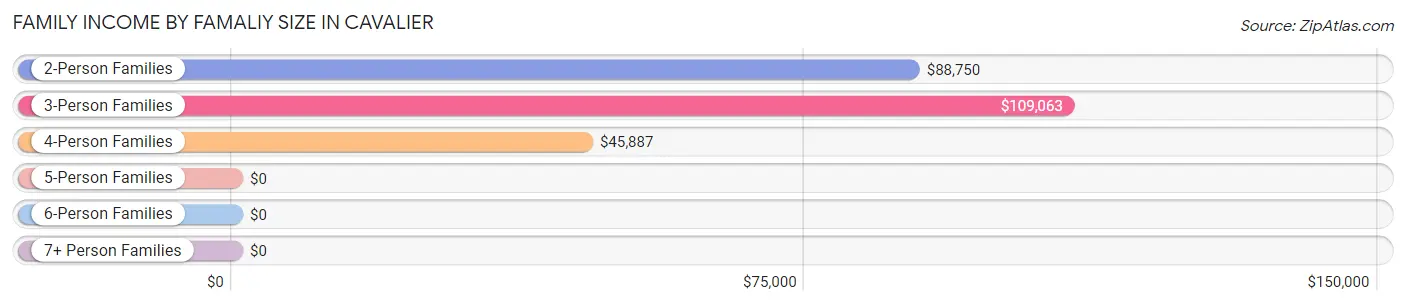
| Income Bracket | # Families | Median Income |
| 2-Person Families | 183 (50.1%) | $88,750 |
| 3-Person Families | 33 (9.0%) | $109,063 |
| 4-Person Families | 102 (28.0%) | $45,887 |
| 5-Person Families | 47 (12.9%) | $0 |
| 6-Person Families | 0 (0.0%) | $0 |
| 7+ Person Families | 0 (0.0%) | $0 |
| Total | 365 (100.0%) | $87,847 |
Family Income by Number of Earners in Cavalier
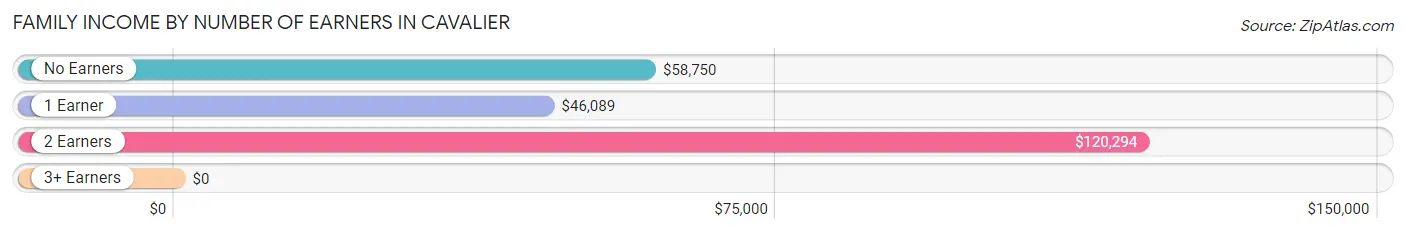
| Number of Earners | # Families | Median Income |
| No Earners | 17 (4.7%) | $58,750 |
| 1 Earner | 153 (41.9%) | $46,089 |
| 2 Earners | 190 (52.0%) | $120,294 |
| 3+ Earners | 5 (1.4%) | $0 |
| Total | 365 (100.0%) | $87,847 |
Household Income in Cavalier
Household Income Brackets in Cavalier
With 111 households falling in the category, the $50,000 to $74,999 income range is the most frequent in Cavalier, accounting for 17.3% of all households. In contrast, only 18 households (2.8%) fall into the less than $10,000 income bracket, making it the least populous group.
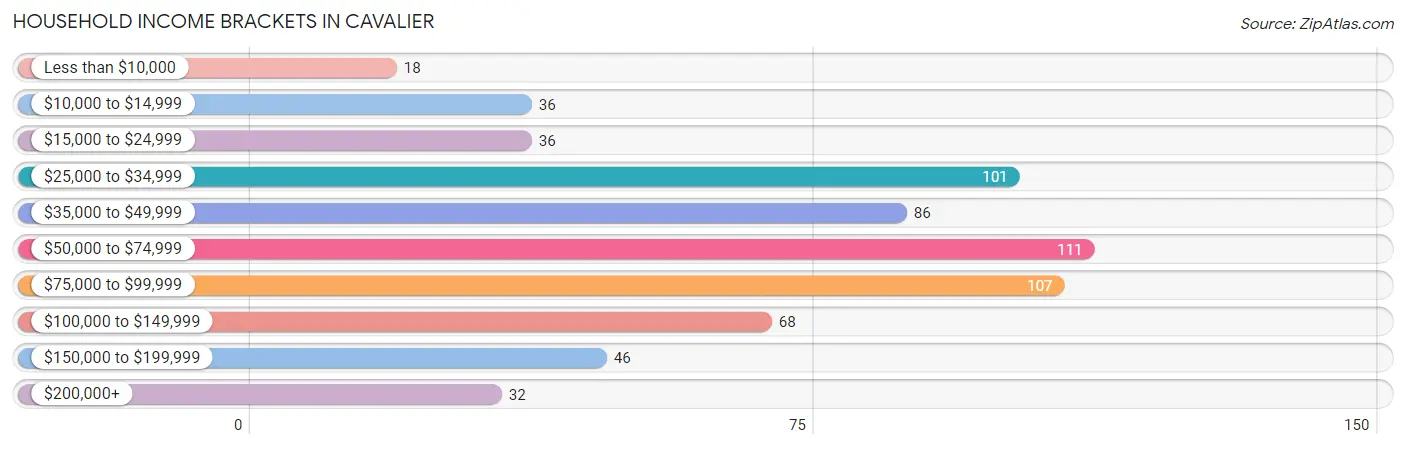
| Income Bracket | # Households | % Households |
| Less than $10,000 | 18 | 2.8% |
| $10,000 to $14,999 | 36 | 5.6% |
| $15,000 to $24,999 | 36 | 5.6% |
| $25,000 to $34,999 | 101 | 15.8% |
| $35,000 to $49,999 | 86 | 13.4% |
| $50,000 to $74,999 | 111 | 17.3% |
| $75,000 to $99,999 | 107 | 16.7% |
| $100,000 to $149,999 | 68 | 10.6% |
| $150,000 to $199,999 | 46 | 7.2% |
| $200,000+ | 32 | 5.0% |
Household Income by Householder Age in Cavalier
The median household income in Cavalier is $55,387, with the highest median household income of $63,906 found in the 25 to 44 years age bracket for the primary householder. A total of 229 households (35.7%) fall into this category. Meanwhile, the 15 to 24 years age bracket for the primary householder has the lowest median household income of $0, with 6 households (0.9%) in this group.
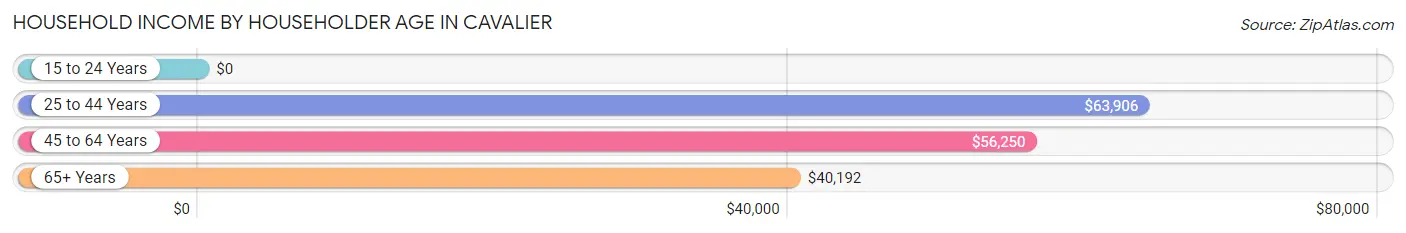
| Income Bracket | # Households | Median Income |
| 15 to 24 Years | 6 (0.9%) | $0 |
| 25 to 44 Years | 229 (35.7%) | $63,906 |
| 45 to 64 Years | 202 (31.5%) | $56,250 |
| 65+ Years | 204 (31.8%) | $40,192 |
| Total | 641 (100.0%) | $55,387 |
Poverty in Cavalier
Income Below Poverty by Sex and Age in Cavalier
With 7.1% poverty level for males and 8.8% for females among the residents of Cavalier, 25 to 34 year old males and 15 year old females are the most vulnerable to poverty, with 14 males (15.7%) and 5 females (100.0%) in their respective age groups living below the poverty level.
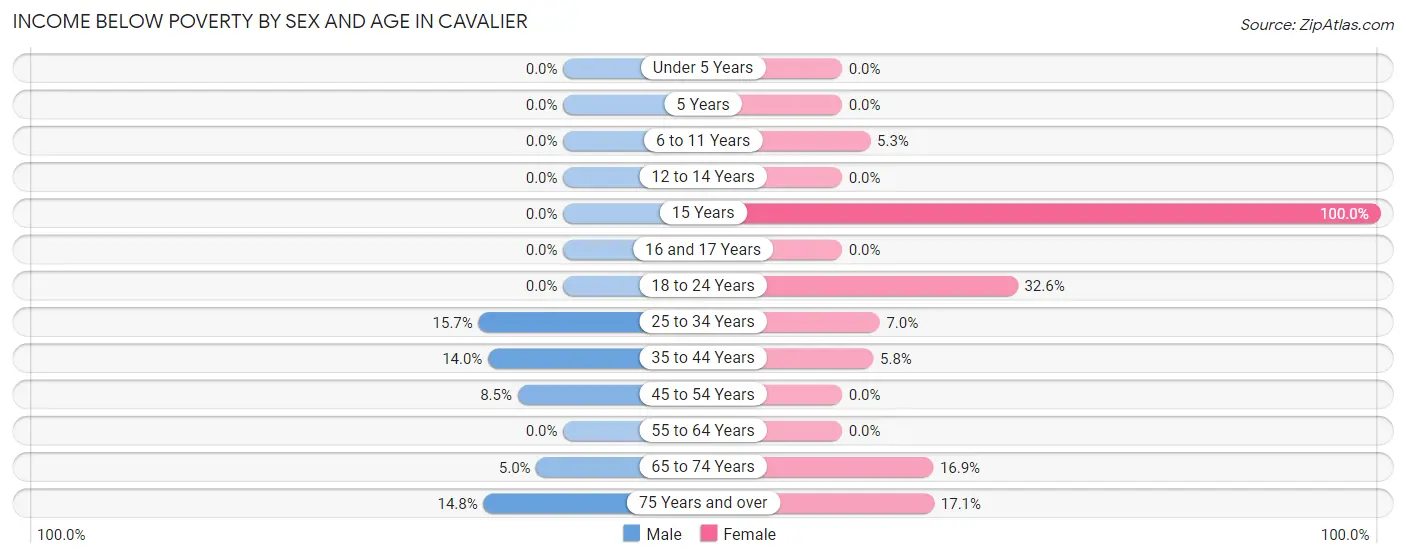
| Age Bracket | Male | Female |
| Under 5 Years | 0 (0.0%) | 0 (0.0%) |
| 5 Years | 0 (0.0%) | 0 (0.0%) |
| 6 to 11 Years | 0 (0.0%) | 3 (5.3%) |
| 12 to 14 Years | 0 (0.0%) | 0 (0.0%) |
| 15 Years | 0 (0.0%) | 5 (100.0%) |
| 16 and 17 Years | 0 (0.0%) | 0 (0.0%) |
| 18 to 24 Years | 0 (0.0%) | 15 (32.6%) |
| 25 to 34 Years | 14 (15.7%) | 7 (7.0%) |
| 35 to 44 Years | 12 (14.0%) | 5 (5.8%) |
| 45 to 54 Years | 6 (8.5%) | 0 (0.0%) |
| 55 to 64 Years | 0 (0.0%) | 0 (0.0%) |
| 65 to 74 Years | 4 (5.0%) | 11 (16.9%) |
| 75 Years and over | 4 (14.8%) | 20 (17.1%) |
| Total | 40 (7.1%) | 66 (8.8%) |
Income Above Poverty by Sex and Age in Cavalier
According to the poverty statistics in Cavalier, males aged under 5 years and females aged under 5 years are the age groups that are most secure financially, with 100.0% of males and 100.0% of females in these age groups living above the poverty line.
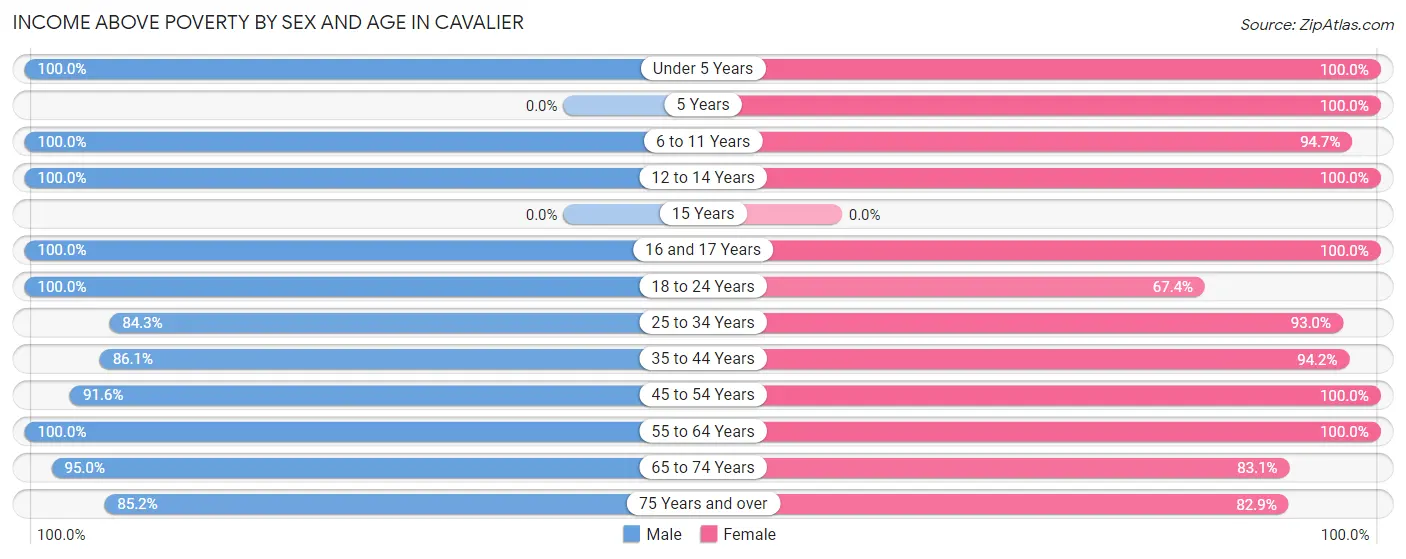
| Age Bracket | Male | Female |
| Under 5 Years | 35 (100.0%) | 60 (100.0%) |
| 5 Years | 0 (0.0%) | 18 (100.0%) |
| 6 to 11 Years | 36 (100.0%) | 54 (94.7%) |
| 12 to 14 Years | 25 (100.0%) | 15 (100.0%) |
| 15 Years | 0 (0.0%) | 0 (0.0%) |
| 16 and 17 Years | 3 (100.0%) | 11 (100.0%) |
| 18 to 24 Years | 42 (100.0%) | 31 (67.4%) |
| 25 to 34 Years | 75 (84.3%) | 93 (93.0%) |
| 35 to 44 Years | 74 (86.1%) | 81 (94.2%) |
| 45 to 54 Years | 65 (91.5%) | 62 (100.0%) |
| 55 to 64 Years | 70 (100.0%) | 109 (100.0%) |
| 65 to 74 Years | 76 (95.0%) | 54 (83.1%) |
| 75 Years and over | 23 (85.2%) | 97 (82.9%) |
| Total | 524 (92.9%) | 685 (91.2%) |
Income Below Poverty Among Married-Couple Families in Cavalier
The poverty statistics for married-couple families in Cavalier show that 3.9% or 11 of the total 283 families live below the poverty line. Families with 1 or 2 children have the highest poverty rate of 5.0%, comprising of 5 families. On the other hand, families with 3 or 4 children have the lowest poverty rate of 0.0%, which includes 0 families.
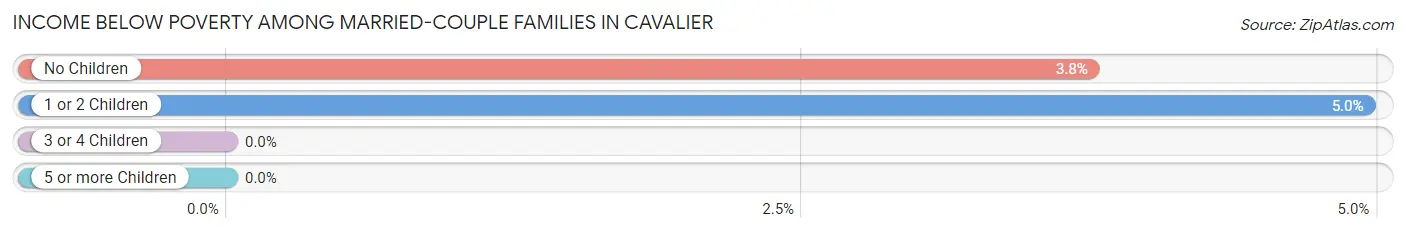
| Children | Above Poverty | Below Poverty |
| No Children | 154 (96.3%) | 6 (3.7%) |
| 1 or 2 Children | 96 (95.1%) | 5 (5.0%) |
| 3 or 4 Children | 22 (100.0%) | 0 (0.0%) |
| 5 or more Children | 0 (0.0%) | 0 (0.0%) |
| Total | 272 (96.1%) | 11 (3.9%) |
Income Below Poverty Among Single-Parent Households in Cavalier
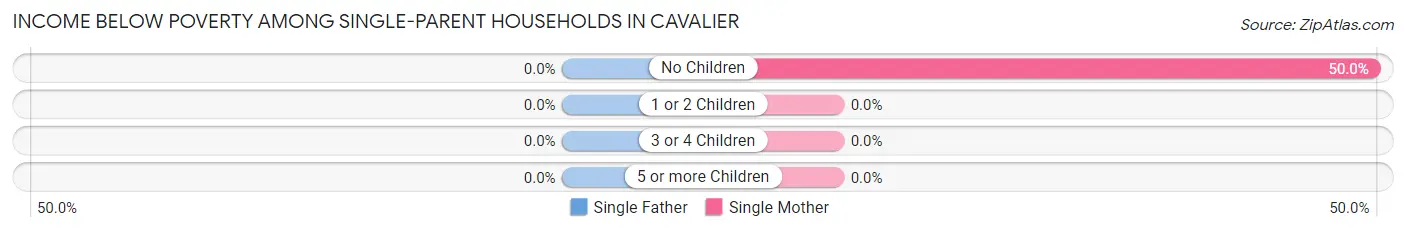
| Children | Single Father | Single Mother |
| No Children | 0 (0.0%) | 3 (50.0%) |
| 1 or 2 Children | 0 (0.0%) | 0 (0.0%) |
| 3 or 4 Children | 0 (0.0%) | 0 (0.0%) |
| 5 or more Children | 0 (0.0%) | 0 (0.0%) |
| Total | 0 (0.0%) | 3 (4.0%) |
Income Below Poverty Among Married-Couple vs Single-Parent Households in Cavalier
The poverty data for Cavalier shows that 11 of the married-couple family households (3.9%) and 3 of the single-parent households (3.7%) are living below the poverty level. Within the married-couple family households, those with 1 or 2 children have the highest poverty rate, with 5 households (5.0%) falling below the poverty line. Among the single-parent households, those with no children have the highest poverty rate, with 3 household (50.0%) living below poverty.
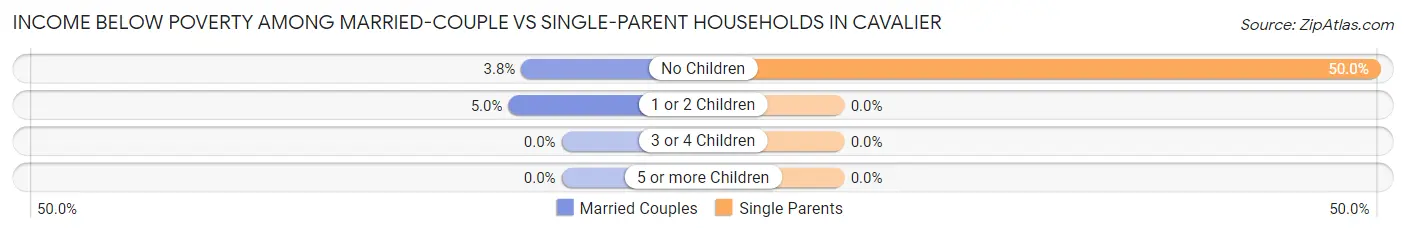
| Children | Married-Couple Families | Single-Parent Households |
| No Children | 6 (3.7%) | 3 (50.0%) |
| 1 or 2 Children | 5 (5.0%) | 0 (0.0%) |
| 3 or 4 Children | 0 (0.0%) | 0 (0.0%) |
| 5 or more Children | 0 (0.0%) | 0 (0.0%) |
| Total | 11 (3.9%) | 3 (3.7%) |
Race in Cavalier
The most populous races in Cavalier are White / Caucasian (1,233 | 90.7%), Two or more Races (67 | 4.9%), and Black / African American (39 | 2.9%).
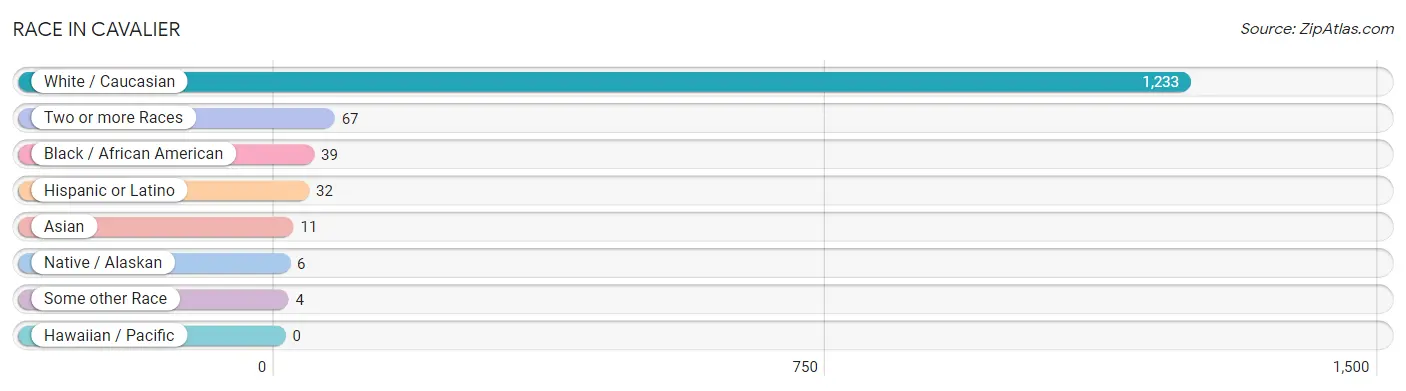
| Race | # Population | % Population |
| Asian | 11 | 0.8% |
| Black / African American | 39 | 2.9% |
| Hawaiian / Pacific | 0 | 0.0% |
| Hispanic or Latino | 32 | 2.4% |
| Native / Alaskan | 6 | 0.4% |
| White / Caucasian | 1,233 | 90.7% |
| Two or more Races | 67 | 4.9% |
| Some other Race | 4 | 0.3% |
| Total | 1,360 | 100.0% |
Ancestry in Cavalier
The most populous ancestries reported in Cavalier are German (325 | 23.9%), Norwegian (201 | 14.8%), Icelander (126 | 9.3%), French (121 | 8.9%), and Irish (69 | 5.1%), together accounting for 61.9% of all Cavalier residents.
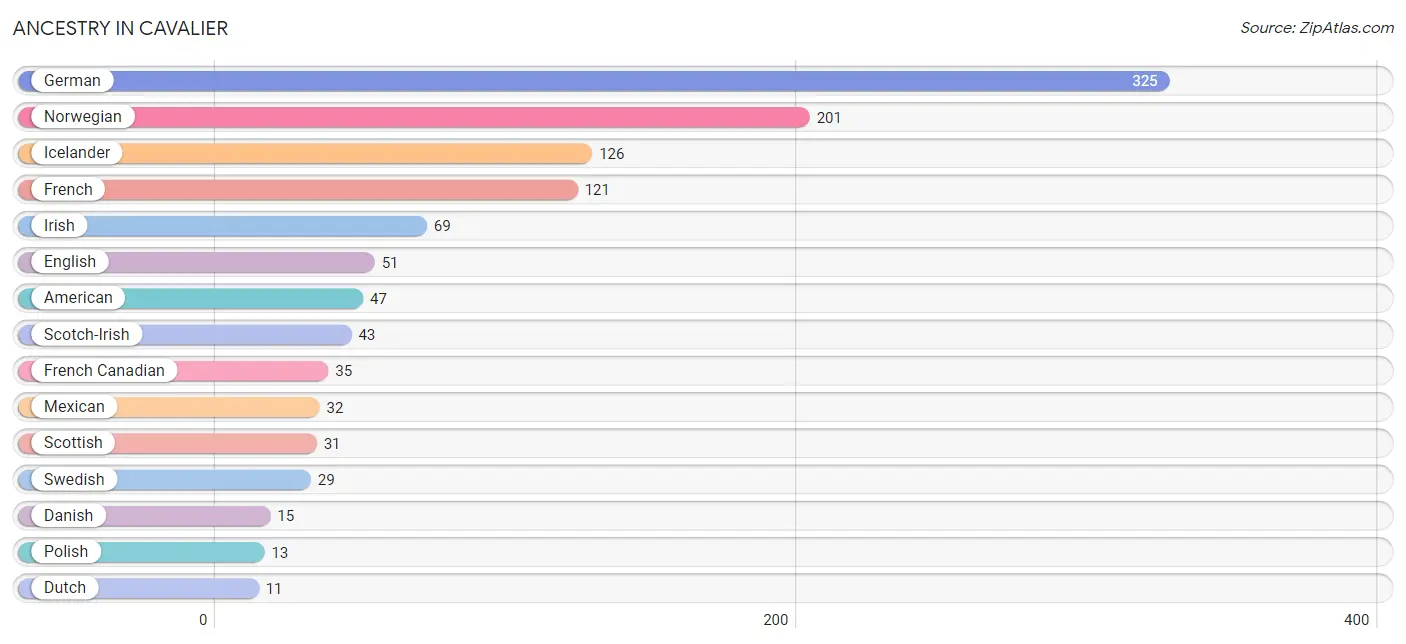
| Ancestry | # Population | % Population |
| American | 47 | 3.5% |
| Australian | 1 | 0.1% |
| Belgian | 3 | 0.2% |
| Cherokee | 4 | 0.3% |
| Chippewa | 1 | 0.1% |
| Czech | 3 | 0.2% |
| Danish | 15 | 1.1% |
| Dutch | 11 | 0.8% |
| English | 51 | 3.7% |
| French | 121 | 8.9% |
| French Canadian | 35 | 2.6% |
| German | 325 | 23.9% |
| Icelander | 126 | 9.3% |
| Irish | 69 | 5.1% |
| Italian | 5 | 0.4% |
| Mexican | 32 | 2.4% |
| Norwegian | 201 | 14.8% |
| Polish | 13 | 1.0% |
| Russian | 4 | 0.3% |
| Scandinavian | 8 | 0.6% |
| Scotch-Irish | 43 | 3.2% |
| Scottish | 31 | 2.3% |
| Sioux | 1 | 0.1% |
| Swedish | 29 | 2.1% |
| Thai | 11 | 0.8% |
| Welsh | 3 | 0.2% | View All 26 Rows |
Immigrants in Cavalier
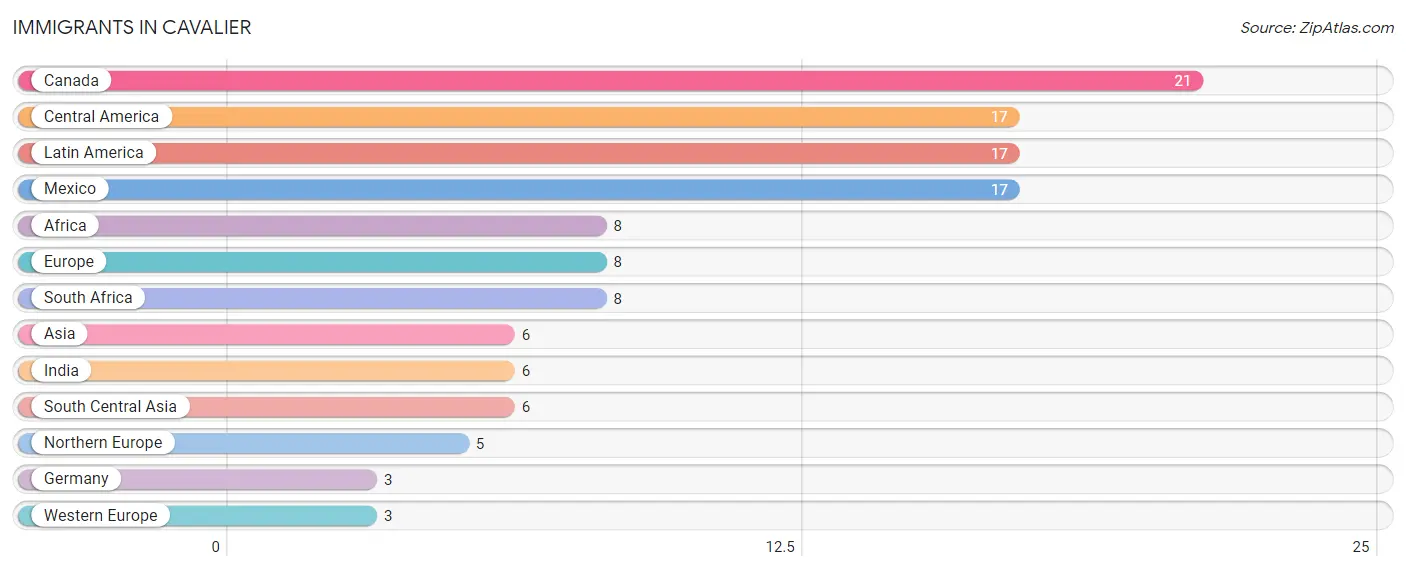
The most numerous immigrant groups reported in Cavalier came from Canada (21 | 1.5%), Central America (17 | 1.3%), Latin America (17 | 1.3%), Mexico (17 | 1.3%), and Africa (8 | 0.6%), together accounting for 5.9% of all Cavalier residents.
| Immigration Origin | # Population | % Population |
| Africa | 8 | 0.6% |
| Asia | 6 | 0.4% |
| Canada | 21 | 1.5% |
| Central America | 17 | 1.3% |
| Europe | 8 | 0.6% |
| Germany | 3 | 0.2% |
| India | 6 | 0.4% |
| Latin America | 17 | 1.3% |
| Mexico | 17 | 1.3% |
| Northern Europe | 5 | 0.4% |
| South Africa | 8 | 0.6% |
| South Central Asia | 6 | 0.4% |
| Western Europe | 3 | 0.2% | View All 13 Rows |
Sex and Age in Cavalier
Sex and Age in Cavalier
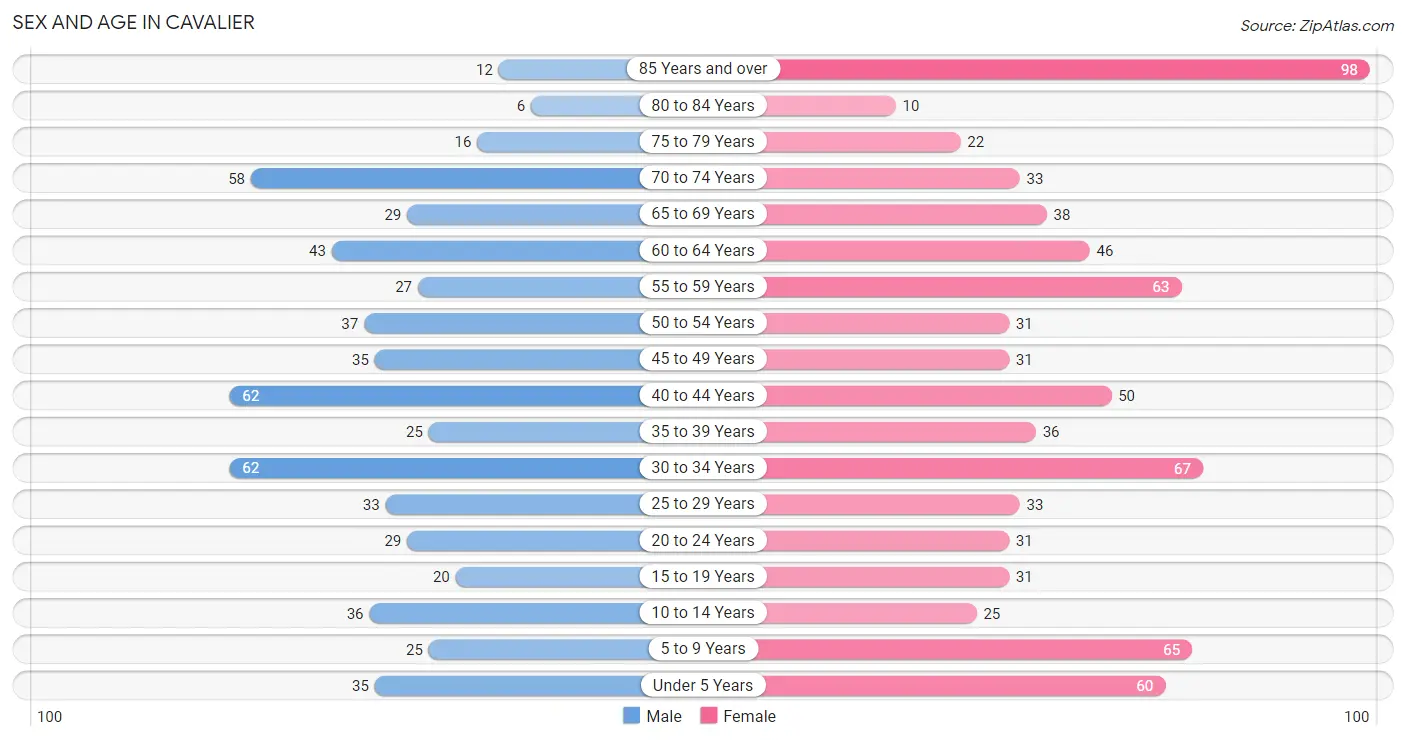
The most populous age groups in Cavalier are 30 to 34 Years (62 | 10.5%) for men and 85 Years and over (98 | 12.7%) for women.
| Age Bracket | Male | Female |
| Under 5 Years | 35 (5.9%) | 60 (7.8%) |
| 5 to 9 Years | 25 (4.2%) | 65 (8.4%) |
| 10 to 14 Years | 36 (6.1%) | 25 (3.3%) |
| 15 to 19 Years | 20 (3.4%) | 31 (4.0%) |
| 20 to 24 Years | 29 (4.9%) | 31 (4.0%) |
| 25 to 29 Years | 33 (5.6%) | 33 (4.3%) |
| 30 to 34 Years | 62 (10.5%) | 67 (8.7%) |
| 35 to 39 Years | 25 (4.2%) | 36 (4.7%) |
| 40 to 44 Years | 62 (10.5%) | 50 (6.5%) |
| 45 to 49 Years | 35 (5.9%) | 31 (4.0%) |
| 50 to 54 Years | 37 (6.3%) | 31 (4.0%) |
| 55 to 59 Years | 27 (4.6%) | 63 (8.2%) |
| 60 to 64 Years | 43 (7.3%) | 46 (6.0%) |
| 65 to 69 Years | 29 (4.9%) | 38 (4.9%) |
| 70 to 74 Years | 58 (9.8%) | 33 (4.3%) |
| 75 to 79 Years | 16 (2.7%) | 22 (2.9%) |
| 80 to 84 Years | 6 (1.0%) | 10 (1.3%) |
| 85 Years and over | 12 (2.0%) | 98 (12.7%) |
| Total | 590 (100.0%) | 770 (100.0%) |
Families and Households in Cavalier
Median Family Size in Cavalier
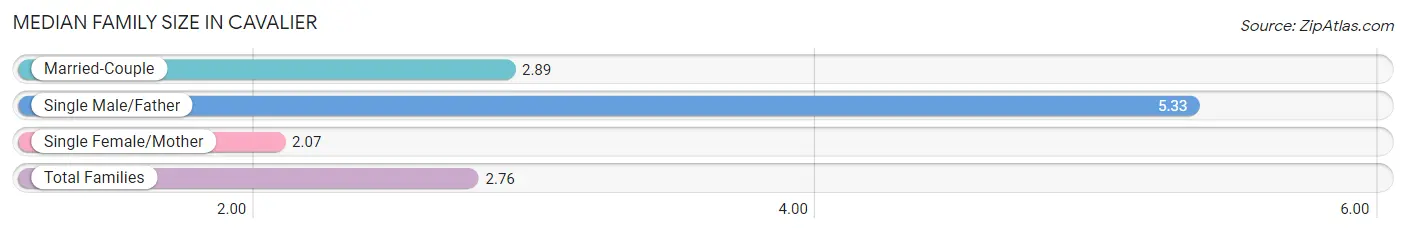
The median family size in Cavalier is 2.76 persons per family, with single male/father families (6 | 1.6%) accounting for the largest median family size of 5.33 persons per family. On the other hand, single female/mother families (76 | 20.8%) represent the smallest median family size with 2.07 persons per family.
| Family Type | # Families | Family Size |
| Married-Couple | 283 (77.5%) | 2.89 |
| Single Male/Father | 6 (1.6%) | 5.33 |
| Single Female/Mother | 76 (20.8%) | 2.07 |
| Total Families | 365 (100.0%) | 2.76 |
Median Household Size in Cavalier
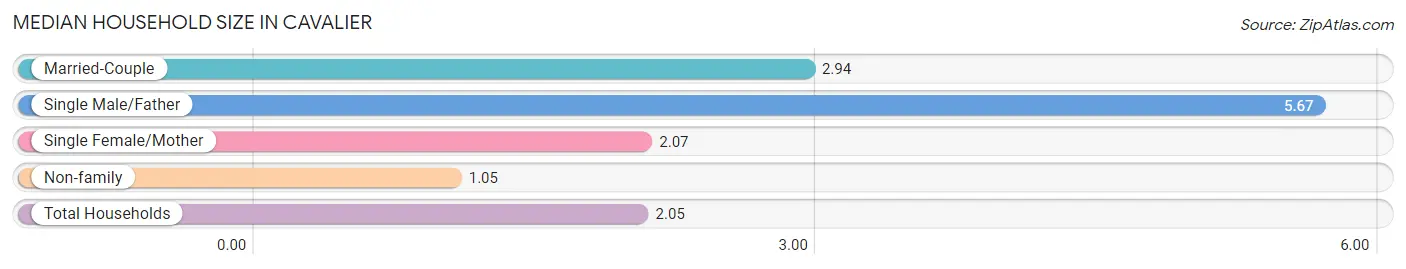
The median household size in Cavalier is 2.05 persons per household, with single male/father households (6 | 0.9%) accounting for the largest median household size of 5.67 persons per household. non-family households (276 | 43.1%) represent the smallest median household size with 1.05 persons per household.
| Household Type | # Households | Household Size |
| Married-Couple | 283 (44.2%) | 2.94 |
| Single Male/Father | 6 (0.9%) | 5.67 |
| Single Female/Mother | 76 (11.9%) | 2.07 |
| Non-family | 276 (43.1%) | 1.05 |
| Total Households | 641 (100.0%) | 2.05 |
Household Size by Marriage Status in Cavalier
Out of a total of 641 households in Cavalier, 365 (56.9%) are family households, while 276 (43.1%) are nonfamily households. The most numerous type of family households are 2-person households, comprising 183, and the most common type of nonfamily households are 1-person households, comprising 267.
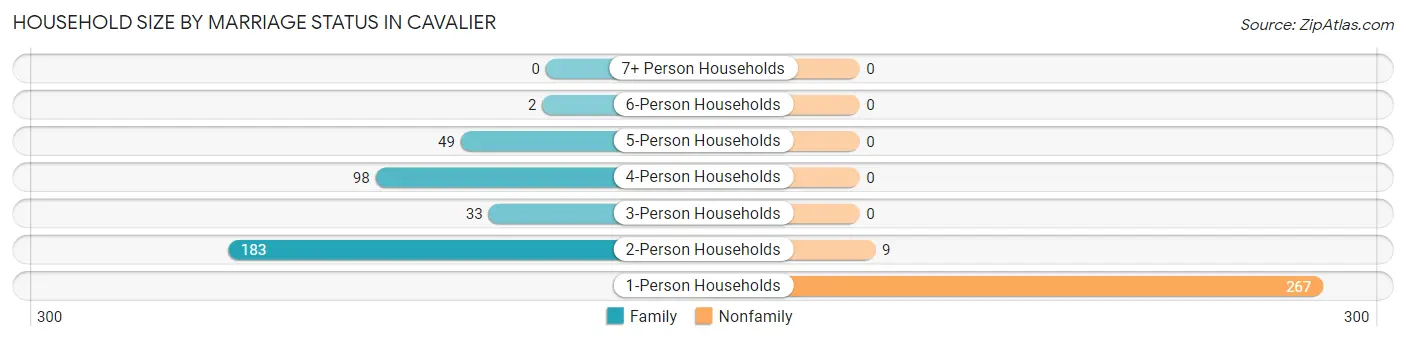
| Household Size | Family Households | Nonfamily Households |
| 1-Person Households | - | 267 (41.6%) |
| 2-Person Households | 183 (28.5%) | 9 (1.4%) |
| 3-Person Households | 33 (5.1%) | 0 (0.0%) |
| 4-Person Households | 98 (15.3%) | 0 (0.0%) |
| 5-Person Households | 49 (7.6%) | 0 (0.0%) |
| 6-Person Households | 2 (0.3%) | 0 (0.0%) |
| 7+ Person Households | 0 (0.0%) | 0 (0.0%) |
| Total | 365 (56.9%) | 276 (43.1%) |
Female Fertility in Cavalier
Fertility by Age in Cavalier
Average fertility rate in Cavalier is 54.0 births per 1,000 women. Women in the age bracket of 20 to 34 years have the highest fertility rate with 122.0 births per 1,000 women. Women in the age bracket of 20 to 34 years acount for 100.0% of all women with births.
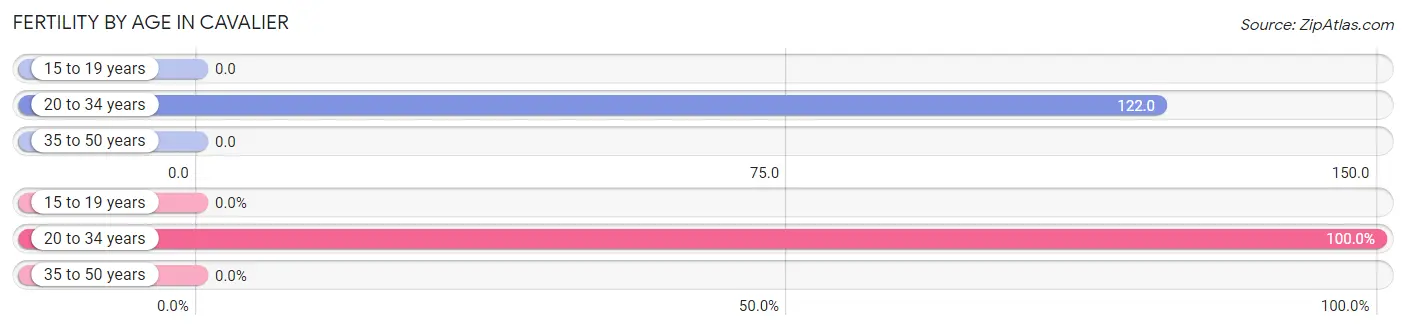
| Age Bracket | Women with Births | Births / 1,000 Women |
| 15 to 19 years | 0 (0.0%) | 0.0 |
| 20 to 34 years | 16 (100.0%) | 122.0 |
| 35 to 50 years | 0 (0.0%) | 0.0 |
| Total | 16 (100.0%) | 54.0 |
Fertility by Age by Marriage Status in Cavalier
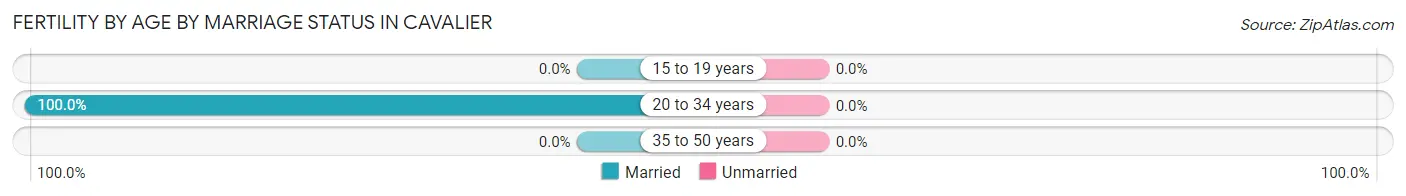
| Age Bracket | Married | Unmarried |
| 15 to 19 years | 0 (0.0%) | 0 (0.0%) |
| 20 to 34 years | 16 (100.0%) | 0 (0.0%) |
| 35 to 50 years | 0 (0.0%) | 0 (0.0%) |
| Total | 16 (100.0%) | 0 (0.0%) |
Fertility by Education in Cavalier
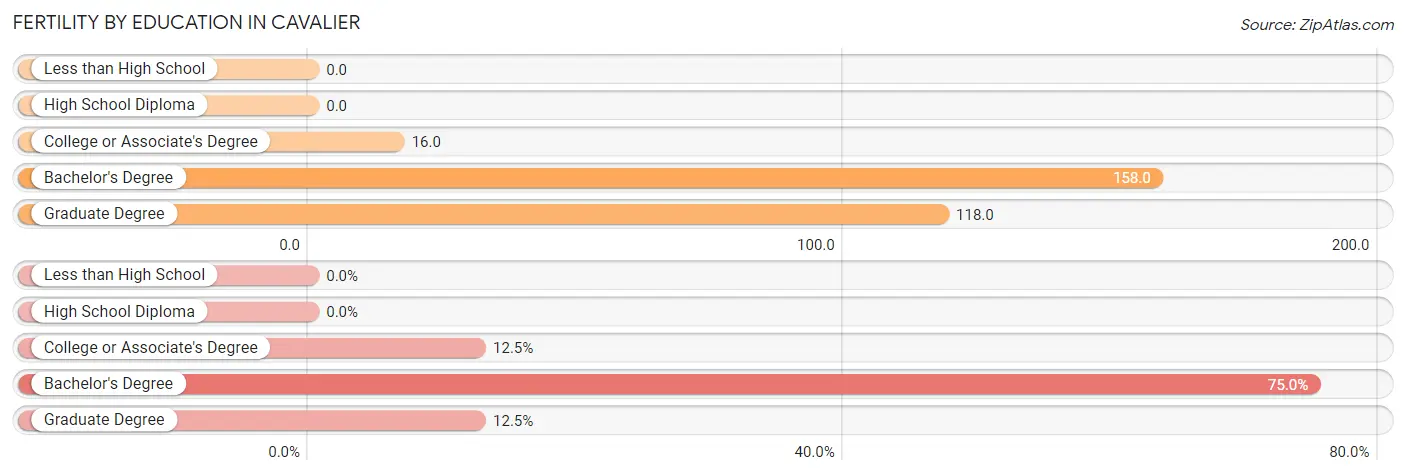
| Educational Attainment | Women with Births | Births / 1,000 Women |
| Less than High School | 0 (0.0%) | 0.0 |
| High School Diploma | 0 (0.0%) | 0.0 |
| College or Associate's Degree | 2 (12.5%) | 16.0 |
| Bachelor's Degree | 12 (75.0%) | 158.0 |
| Graduate Degree | 2 (12.5%) | 118.0 |
| Total | 16 (100.0%) | 54.0 |
Fertility by Education by Marriage Status in Cavalier
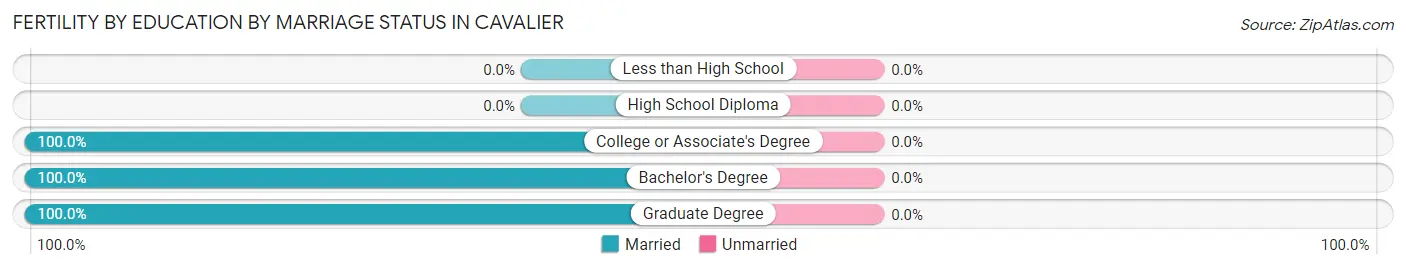
| Educational Attainment | Married | Unmarried |
| Less than High School | 0 (0.0%) | 0 (0.0%) |
| High School Diploma | 0 (0.0%) | 0 (0.0%) |
| College or Associate's Degree | 2 (100.0%) | 0 (0.0%) |
| Bachelor's Degree | 12 (100.0%) | 0 (0.0%) |
| Graduate Degree | 2 (100.0%) | 0 (0.0%) |
| Total | 16 (100.0%) | 0 (0.0%) |
Employment Characteristics in Cavalier
Employment by Class of Employer in Cavalier
Among the 646 employed individuals in Cavalier, private company employees (307 | 47.5%), self-employed (not incorporated) (116 | 18.0%), and local government employees (99 | 15.3%) make up the most common classes of employment.
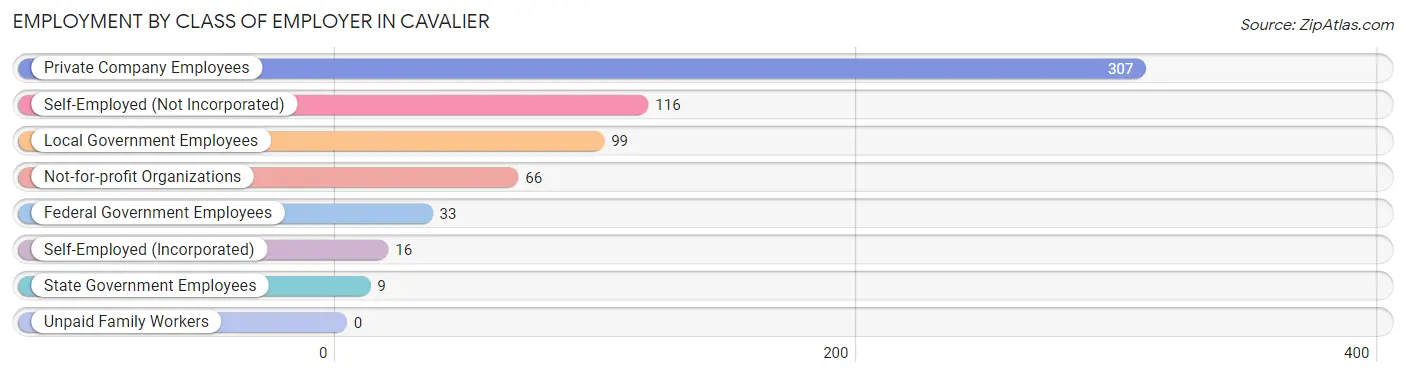
| Employer Class | # Employees | % Employees |
| Private Company Employees | 307 | 47.5% |
| Self-Employed (Incorporated) | 16 | 2.5% |
| Self-Employed (Not Incorporated) | 116 | 18.0% |
| Not-for-profit Organizations | 66 | 10.2% |
| Local Government Employees | 99 | 15.3% |
| State Government Employees | 9 | 1.4% |
| Federal Government Employees | 33 | 5.1% |
| Unpaid Family Workers | 0 | 0.0% |
| Total | 646 | 100.0% |
Employment Status by Age in Cavalier
According to the labor force statistics for Cavalier, out of the total population over 16 years of age (1,109), 65.0% or 721 individuals are in the labor force, with 10.4% or 75 of them unemployed. The age group with the highest labor force participation rate is 30 to 34 years, with 95.3% or 123 individuals in the labor force. Within the labor force, the 20 to 24 years age range has the highest percentage of unemployed individuals, with 55.4% or 31 of them being unemployed.
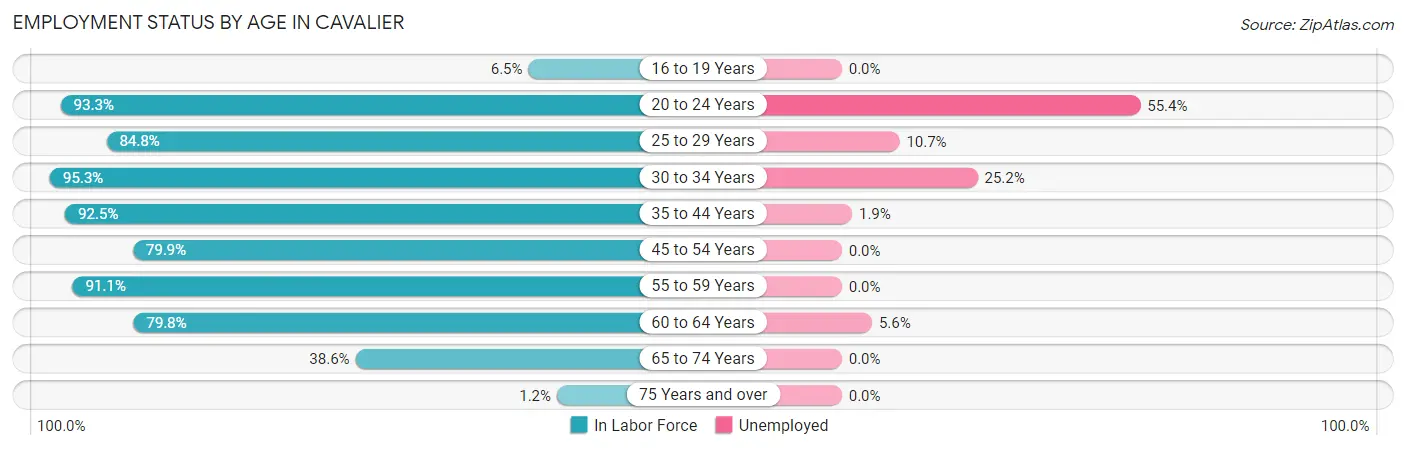
| Age Bracket | In Labor Force | Unemployed |
| 16 to 19 Years | 3 (6.5%) | 0 (0.0%) |
| 20 to 24 Years | 56 (93.3%) | 31 (55.4%) |
| 25 to 29 Years | 56 (84.8%) | 6 (10.7%) |
| 30 to 34 Years | 123 (95.3%) | 31 (25.2%) |
| 35 to 44 Years | 160 (92.5%) | 3 (1.9%) |
| 45 to 54 Years | 107 (79.9%) | 0 (0.0%) |
| 55 to 59 Years | 82 (91.1%) | 0 (0.0%) |
| 60 to 64 Years | 71 (79.8%) | 4 (5.6%) |
| 65 to 74 Years | 61 (38.6%) | 0 (0.0%) |
| 75 Years and over | 2 (1.2%) | 0 (0.0%) |
| Total | 721 (65.0%) | 75 (10.4%) |
Employment Status by Educational Attainment in Cavalier
According to labor force statistics for Cavalier, 88.0% of individuals (599) out of the total population between 25 and 64 years of age (681) are in the labor force, with 7.3% or 44 of them being unemployed. The group with the highest labor force participation rate are those with the educational attainment of high school diploma, with 94.9% or 130 individuals in the labor force. Within the labor force, individuals with college / associate degree education have the highest percentage of unemployment, with 11.0% or 31 of them being unemployed.
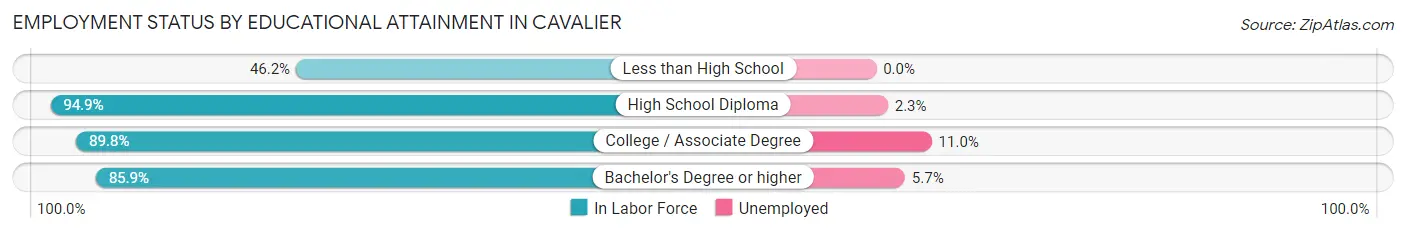
| Educational Attainment | In Labor Force | Unemployed |
| Less than High School | 12 (46.2%) | 0 (0.0%) |
| High School Diploma | 130 (94.9%) | 3 (2.3%) |
| College / Associate Degree | 281 (89.8%) | 34 (11.0%) |
| Bachelor's Degree or higher | 176 (85.9%) | 12 (5.7%) |
| Total | 599 (88.0%) | 50 (7.3%) |
Employment Occupations by Sex in Cavalier
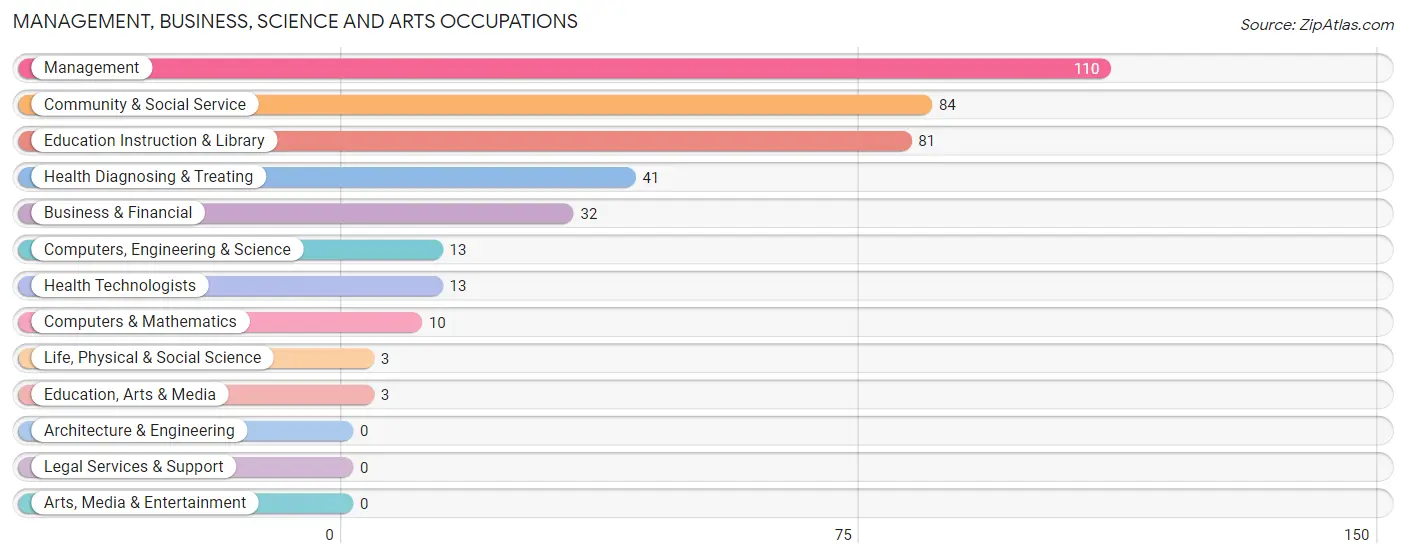
Management, Business, Science and Arts Occupations
The most common Management, Business, Science and Arts occupations in Cavalier are Management (110 | 17.0%), Community & Social Service (84 | 13.0%), Education Instruction & Library (81 | 12.5%), Health Diagnosing & Treating (41 | 6.4%), and Business & Financial (32 | 5.0%).
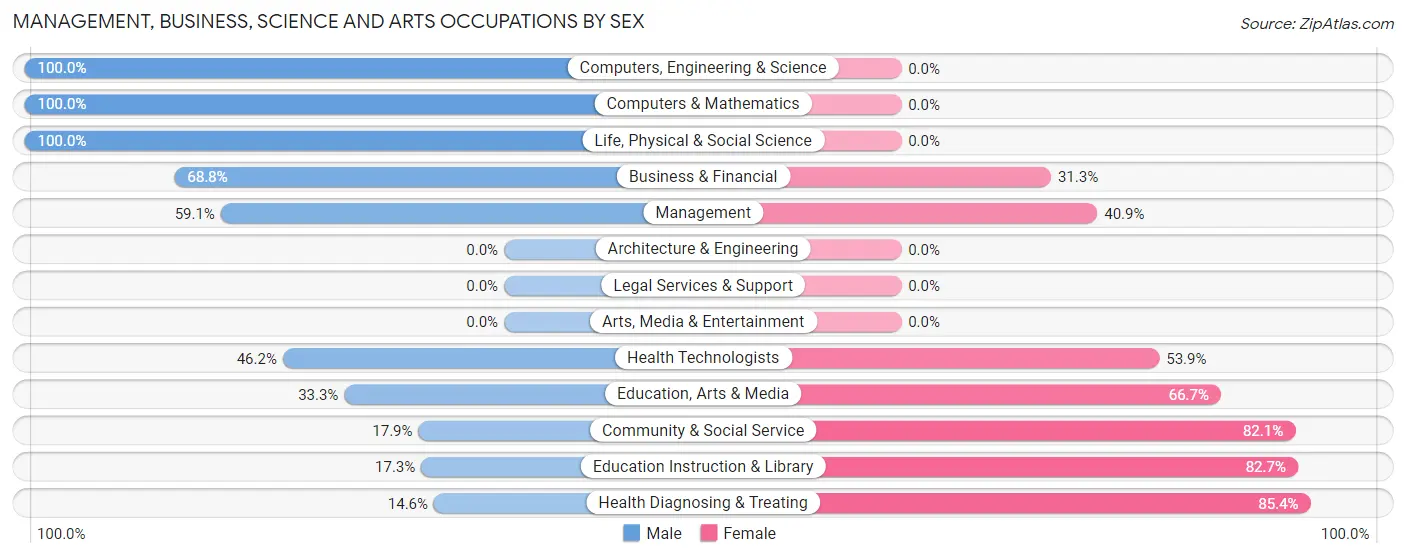
Management, Business, Science and Arts Occupations by Sex
Within the Management, Business, Science and Arts occupations in Cavalier, the most male-oriented occupations are Computers, Engineering & Science (100.0%), Computers & Mathematics (100.0%), and Life, Physical & Social Science (100.0%), while the most female-oriented occupations are Health Diagnosing & Treating (85.4%), Education Instruction & Library (82.7%), and Community & Social Service (82.1%).
| Occupation | Male | Female |
| Management | 65 (59.1%) | 45 (40.9%) |
| Business & Financial | 22 (68.8%) | 10 (31.2%) |
| Computers, Engineering & Science | 13 (100.0%) | 0 (0.0%) |
| Computers & Mathematics | 10 (100.0%) | 0 (0.0%) |
| Architecture & Engineering | 0 (0.0%) | 0 (0.0%) |
| Life, Physical & Social Science | 3 (100.0%) | 0 (0.0%) |
| Community & Social Service | 15 (17.9%) | 69 (82.1%) |
| Education, Arts & Media | 1 (33.3%) | 2 (66.7%) |
| Legal Services & Support | 0 (0.0%) | 0 (0.0%) |
| Education Instruction & Library | 14 (17.3%) | 67 (82.7%) |
| Arts, Media & Entertainment | 0 (0.0%) | 0 (0.0%) |
| Health Diagnosing & Treating | 6 (14.6%) | 35 (85.4%) |
| Health Technologists | 6 (46.2%) | 7 (53.8%) |
| Total (Category) | 121 (43.2%) | 159 (56.8%) |
| Total (Overall) | 333 (51.5%) | 313 (48.4%) |
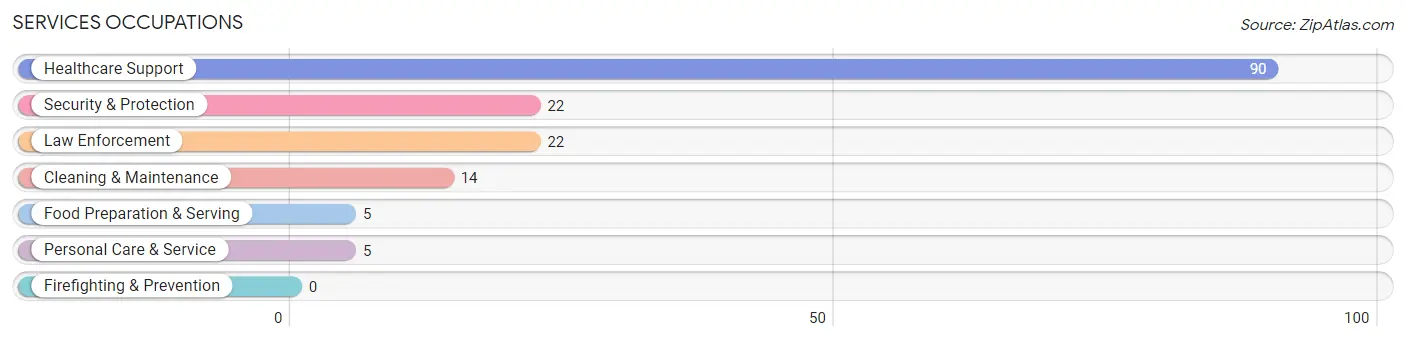
Services Occupations
The most common Services occupations in Cavalier are Healthcare Support (90 | 13.9%), Security & Protection (22 | 3.4%), Law Enforcement (22 | 3.4%), Cleaning & Maintenance (14 | 2.2%), and Food Preparation & Serving (5 | 0.8%).
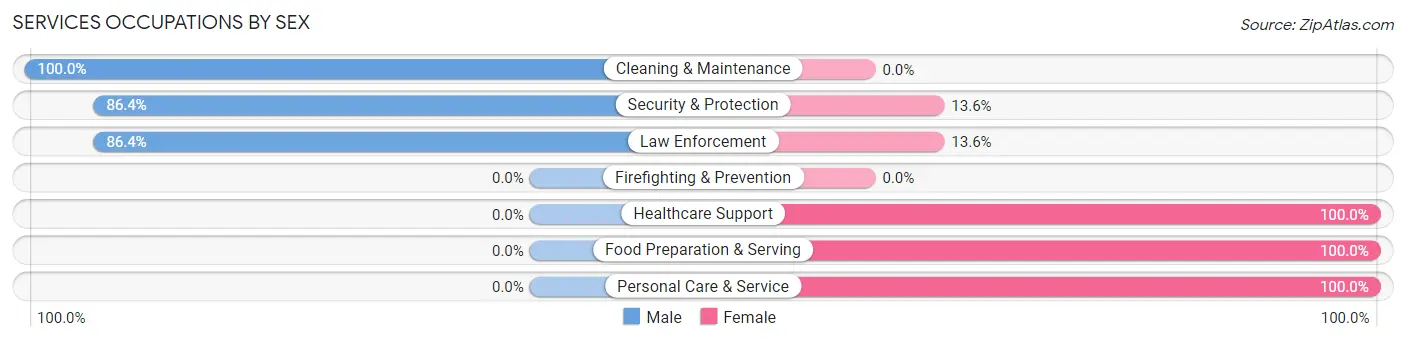
Services Occupations by Sex
Within the Services occupations in Cavalier, the most male-oriented occupations are Cleaning & Maintenance (100.0%), Security & Protection (86.4%), and Law Enforcement (86.4%), while the most female-oriented occupations are Healthcare Support (100.0%), Food Preparation & Serving (100.0%), and Personal Care & Service (100.0%).
| Occupation | Male | Female |
| Healthcare Support | 0 (0.0%) | 90 (100.0%) |
| Security & Protection | 19 (86.4%) | 3 (13.6%) |
| Firefighting & Prevention | 0 (0.0%) | 0 (0.0%) |
| Law Enforcement | 19 (86.4%) | 3 (13.6%) |
| Food Preparation & Serving | 0 (0.0%) | 5 (100.0%) |
| Cleaning & Maintenance | 14 (100.0%) | 0 (0.0%) |
| Personal Care & Service | 0 (0.0%) | 5 (100.0%) |
| Total (Category) | 33 (24.3%) | 103 (75.7%) |
| Total (Overall) | 333 (51.5%) | 313 (48.4%) |
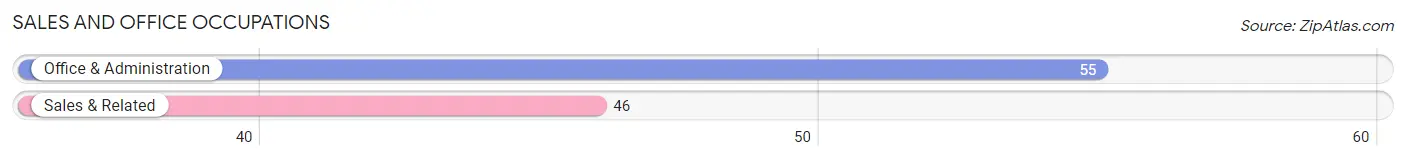
Sales and Office Occupations
The most common Sales and Office occupations in Cavalier are Office & Administration (55 | 8.5%), and Sales & Related (46 | 7.1%).
Sales and Office Occupations by Sex
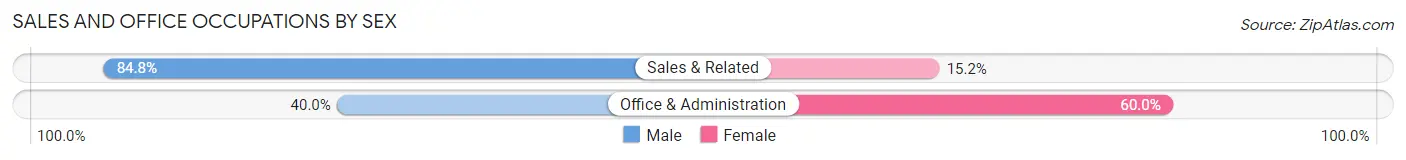
| Occupation | Male | Female |
| Sales & Related | 39 (84.8%) | 7 (15.2%) |
| Office & Administration | 22 (40.0%) | 33 (60.0%) |
| Total (Category) | 61 (60.4%) | 40 (39.6%) |
| Total (Overall) | 333 (51.5%) | 313 (48.4%) |
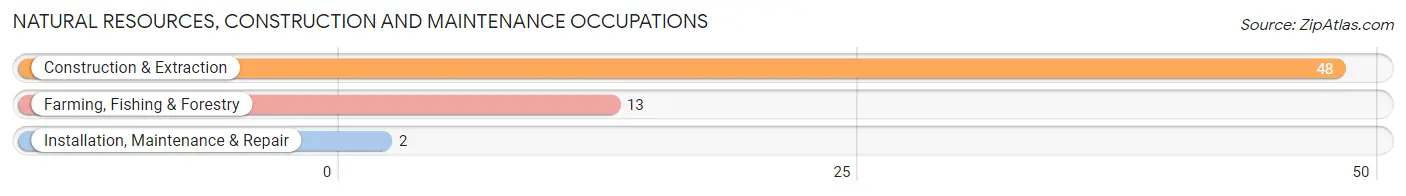
Natural Resources, Construction and Maintenance Occupations
The most common Natural Resources, Construction and Maintenance occupations in Cavalier are Construction & Extraction (48 | 7.4%), Farming, Fishing & Forestry (13 | 2.0%), and Installation, Maintenance & Repair (2 | 0.3%).
Natural Resources, Construction and Maintenance Occupations by Sex
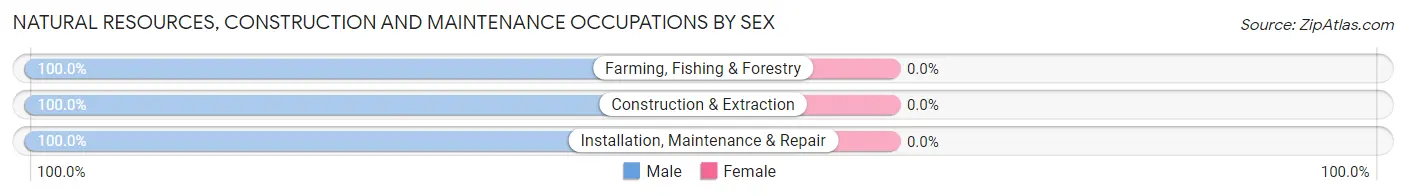
| Occupation | Male | Female |
| Farming, Fishing & Forestry | 13 (100.0%) | 0 (0.0%) |
| Construction & Extraction | 48 (100.0%) | 0 (0.0%) |
| Installation, Maintenance & Repair | 2 (100.0%) | 0 (0.0%) |
| Total (Category) | 63 (100.0%) | 0 (0.0%) |
| Total (Overall) | 333 (51.5%) | 313 (48.4%) |
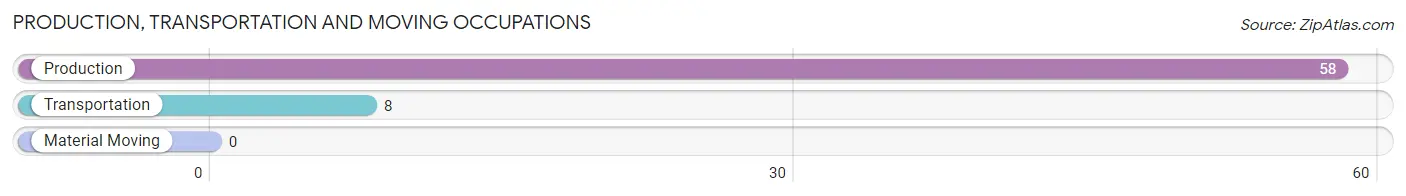
Production, Transportation and Moving Occupations
The most common Production, Transportation and Moving occupations in Cavalier are Production (58 | 9.0%), and Transportation (8 | 1.2%).
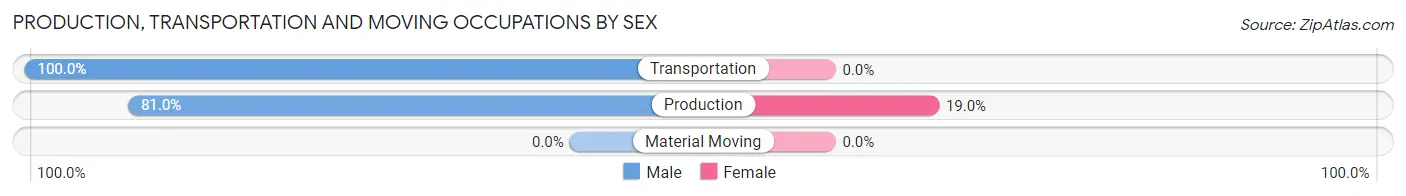
Production, Transportation and Moving Occupations by Sex
| Occupation | Male | Female |
| Production | 47 (81.0%) | 11 (19.0%) |
| Transportation | 8 (100.0%) | 0 (0.0%) |
| Material Moving | 0 (0.0%) | 0 (0.0%) |
| Total (Category) | 55 (83.3%) | 11 (16.7%) |
| Total (Overall) | 333 (51.5%) | 313 (48.4%) |
Employment Industries by Sex in Cavalier
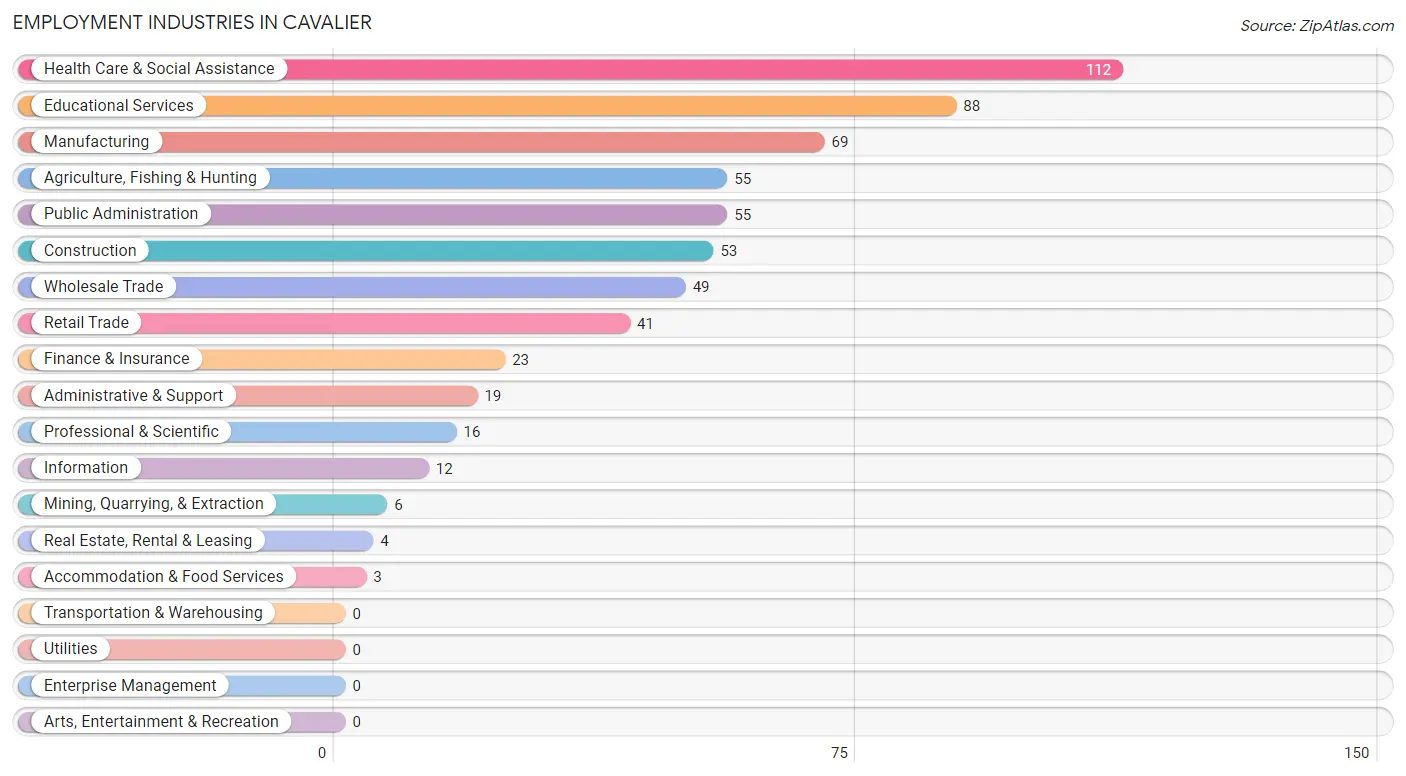
Employment Industries in Cavalier
The major employment industries in Cavalier include Health Care & Social Assistance (112 | 17.3%), Educational Services (88 | 13.6%), Manufacturing (69 | 10.7%), Agriculture, Fishing & Hunting (55 | 8.5%), and Public Administration (55 | 8.5%).
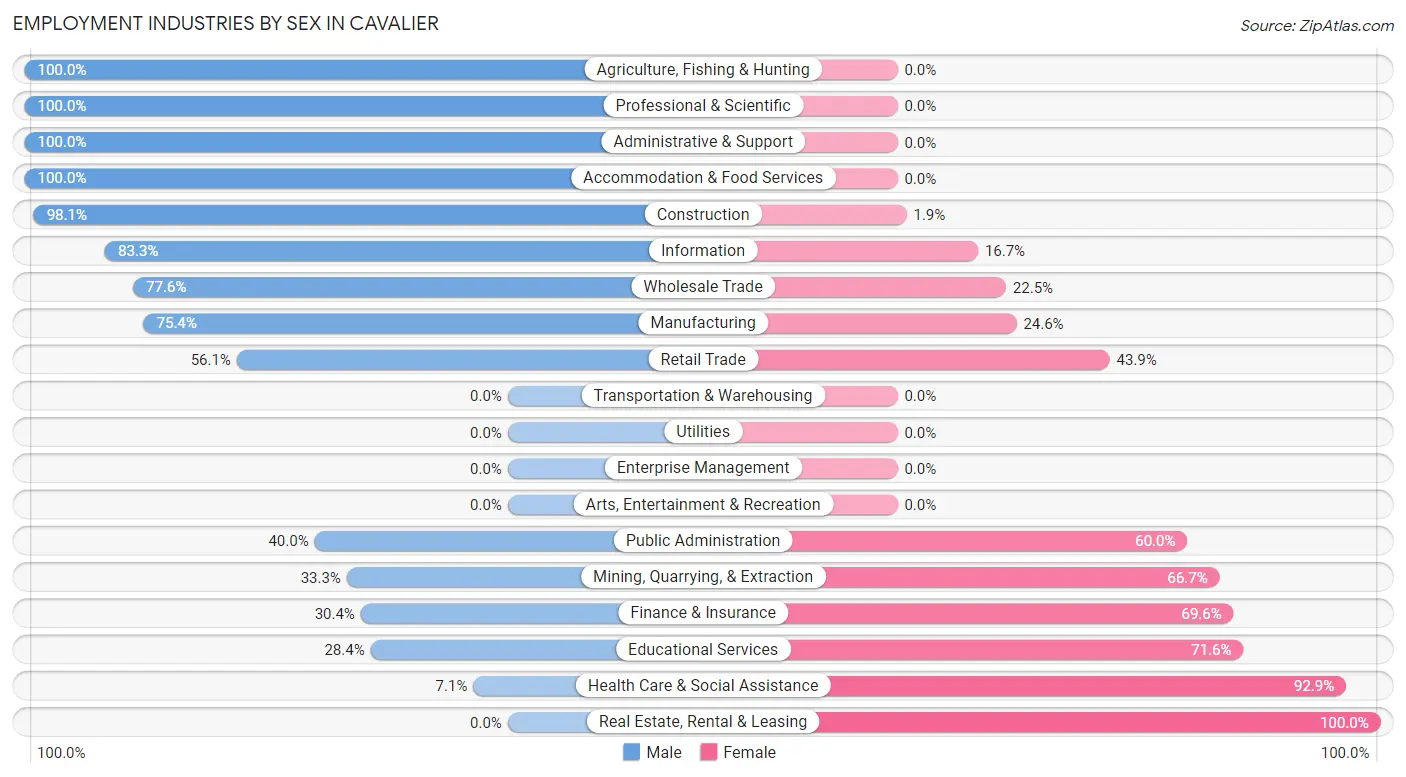
Employment Industries by Sex in Cavalier
The Cavalier industries that see more men than women are Agriculture, Fishing & Hunting (100.0%), Professional & Scientific (100.0%), and Administrative & Support (100.0%), whereas the industries that tend to have a higher number of women are Real Estate, Rental & Leasing (100.0%), Health Care & Social Assistance (92.9%), and Educational Services (71.6%).
| Industry | Male | Female |
| Agriculture, Fishing & Hunting | 55 (100.0%) | 0 (0.0%) |
| Mining, Quarrying, & Extraction | 2 (33.3%) | 4 (66.7%) |
| Construction | 52 (98.1%) | 1 (1.9%) |
| Manufacturing | 52 (75.4%) | 17 (24.6%) |
| Wholesale Trade | 38 (77.5%) | 11 (22.5%) |
| Retail Trade | 23 (56.1%) | 18 (43.9%) |
| Transportation & Warehousing | 0 (0.0%) | 0 (0.0%) |
| Utilities | 0 (0.0%) | 0 (0.0%) |
| Information | 10 (83.3%) | 2 (16.7%) |
| Finance & Insurance | 7 (30.4%) | 16 (69.6%) |
| Real Estate, Rental & Leasing | 0 (0.0%) | 4 (100.0%) |
| Professional & Scientific | 16 (100.0%) | 0 (0.0%) |
| Enterprise Management | 0 (0.0%) | 0 (0.0%) |
| Administrative & Support | 19 (100.0%) | 0 (0.0%) |
| Educational Services | 25 (28.4%) | 63 (71.6%) |
| Health Care & Social Assistance | 8 (7.1%) | 104 (92.9%) |
| Arts, Entertainment & Recreation | 0 (0.0%) | 0 (0.0%) |
| Accommodation & Food Services | 3 (100.0%) | 0 (0.0%) |
| Public Administration | 22 (40.0%) | 33 (60.0%) |
| Total | 333 (51.5%) | 313 (48.4%) |
Education in Cavalier
School Enrollment in Cavalier
The most common levels of schooling among the 246 students in Cavalier are elementary school (64 | 26.0%), high school (58 | 23.6%), and middle school (54 | 22.0%).
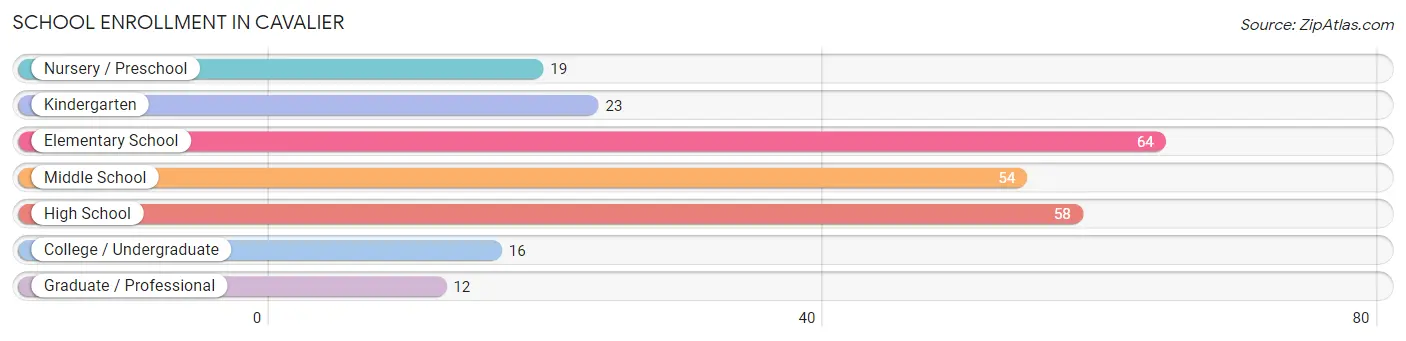
| School Level | # Students | % Students |
| Nursery / Preschool | 19 | 7.7% |
| Kindergarten | 23 | 9.3% |
| Elementary School | 64 | 26.0% |
| Middle School | 54 | 22.0% |
| High School | 58 | 23.6% |
| College / Undergraduate | 16 | 6.5% |
| Graduate / Professional | 12 | 4.9% |
| Total | 246 | 100.0% |
School Enrollment by Age by Funding Source in Cavalier
Out of a total of 246 students who are enrolled in schools in Cavalier, 6 (2.4%) attend a private institution, while the remaining 240 (97.6%) are enrolled in public schools. The age group of 5 to 9 year old has the highest likelihood of being enrolled in private schools, with 4 (4.4% in the age bracket) enrolled. Conversely, the age group of 3 to 4 year olds has the lowest likelihood of being enrolled in a private school, with 16 (100.0% in the age bracket) attending a public institution.
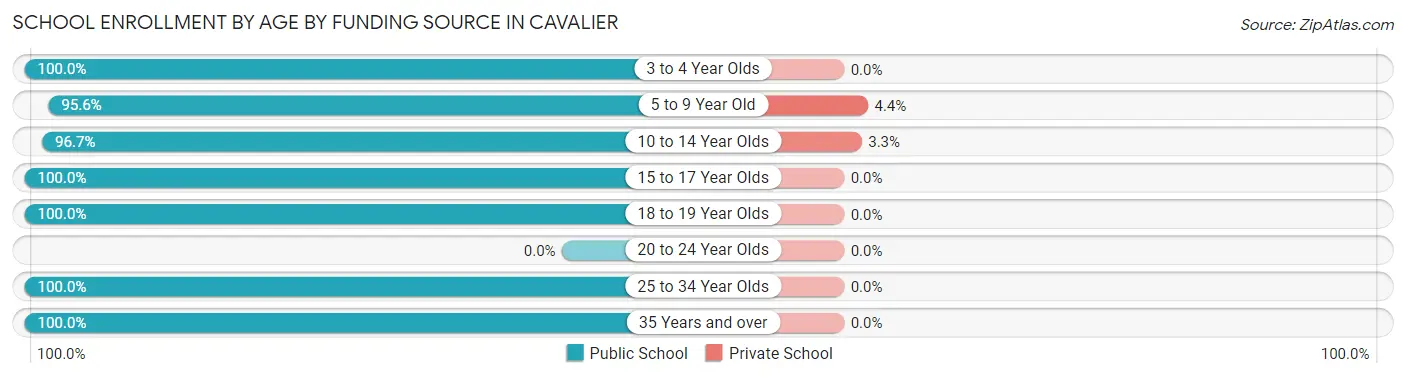
| Age Bracket | Public School | Private School |
| 3 to 4 Year Olds | 16 (100.0%) | 0 (0.0%) |
| 5 to 9 Year Old | 86 (95.6%) | 4 (4.4%) |
| 10 to 14 Year Olds | 59 (96.7%) | 2 (3.3%) |
| 15 to 17 Year Olds | 19 (100.0%) | 0 (0.0%) |
| 18 to 19 Year Olds | 32 (100.0%) | 0 (0.0%) |
| 20 to 24 Year Olds | 0 (0.0%) | 0 (0.0%) |
| 25 to 34 Year Olds | 1 (100.0%) | 0 (0.0%) |
| 35 Years and over | 27 (100.0%) | 0 (0.0%) |
| Total | 240 (97.6%) | 6 (2.4%) |
Educational Attainment by Field of Study in Cavalier
Education (121 | 39.9%), liberal arts & history (39 | 12.9%), business (33 | 10.9%), science & technology (27 | 8.9%), and arts & humanities (20 | 6.6%) are the most common fields of study among 303 individuals in Cavalier who have obtained a bachelor's degree or higher.
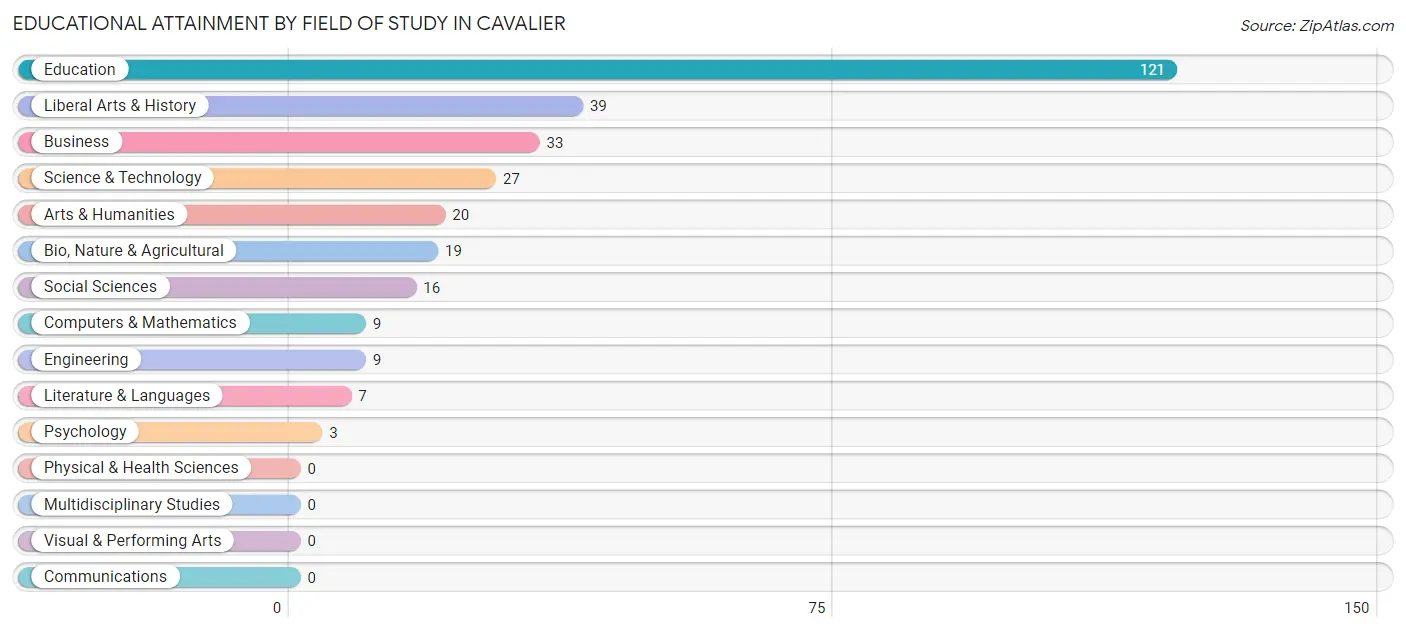
| Field of Study | # Graduates | % Graduates |
| Computers & Mathematics | 9 | 3.0% |
| Bio, Nature & Agricultural | 19 | 6.3% |
| Physical & Health Sciences | 0 | 0.0% |
| Psychology | 3 | 1.0% |
| Social Sciences | 16 | 5.3% |
| Engineering | 9 | 3.0% |
| Multidisciplinary Studies | 0 | 0.0% |
| Science & Technology | 27 | 8.9% |
| Business | 33 | 10.9% |
| Education | 121 | 39.9% |
| Literature & Languages | 7 | 2.3% |
| Liberal Arts & History | 39 | 12.9% |
| Visual & Performing Arts | 0 | 0.0% |
| Communications | 0 | 0.0% |
| Arts & Humanities | 20 | 6.6% |
| Total | 303 | 100.0% |
Transportation & Commute in Cavalier
Vehicle Availability by Sex in Cavalier
The most prevalent vehicle ownership categories in Cavalier are males with 2 vehicles (174, accounting for 52.2%) and females with 2 vehicles (120, making up 55.6%).
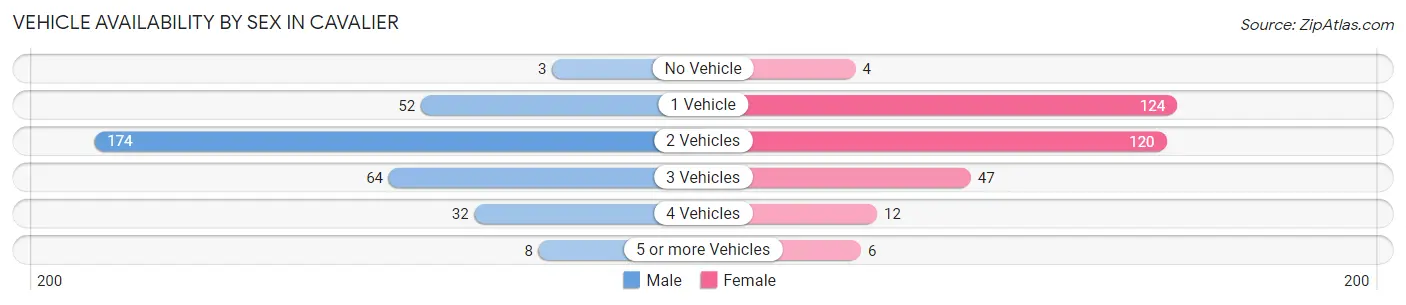
| Vehicles Available | Male | Female |
| No Vehicle | 3 (0.9%) | 4 (1.3%) |
| 1 Vehicle | 52 (15.6%) | 124 (39.6%) |
| 2 Vehicles | 174 (52.2%) | 120 (38.3%) |
| 3 Vehicles | 64 (19.2%) | 47 (15.0%) |
| 4 Vehicles | 32 (9.6%) | 12 (3.8%) |
| 5 or more Vehicles | 8 (2.4%) | 6 (1.9%) |
| Total | 333 (100.0%) | 313 (100.0%) |
Commute Time in Cavalier
The most frequently occuring commute durations in Cavalier are 5 to 9 minutes (158 commuters, 27.1%), less than 5 minutes (145 commuters, 24.9%), and 30 to 34 minutes (64 commuters, 11.0%).
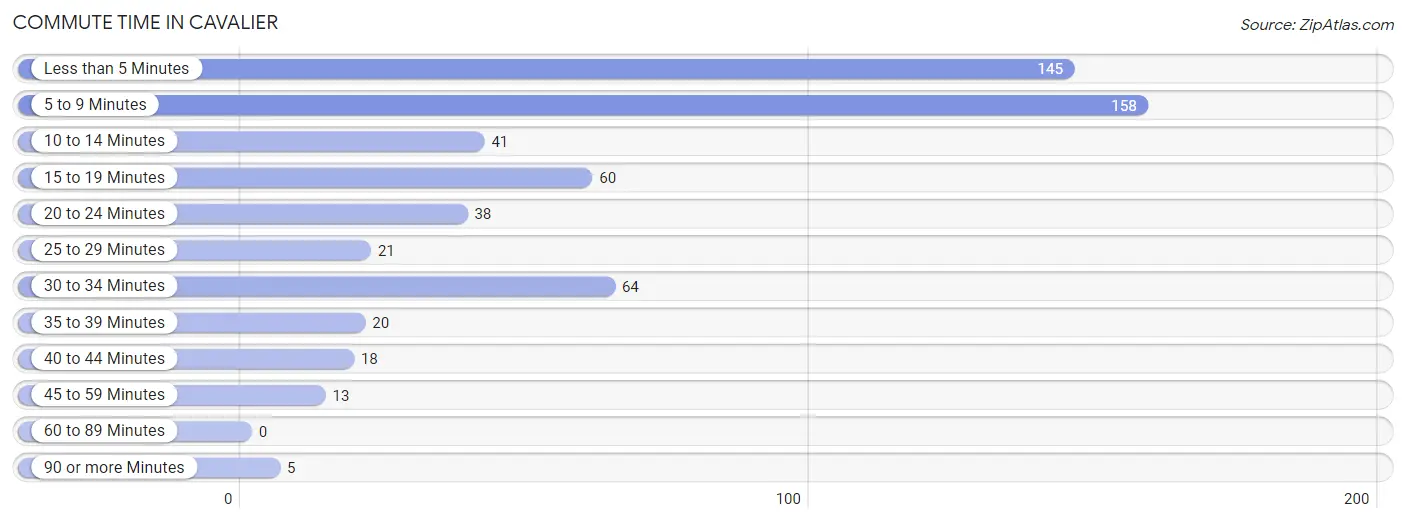
| Commute Time | # Commuters | % Commuters |
| Less than 5 Minutes | 145 | 24.9% |
| 5 to 9 Minutes | 158 | 27.1% |
| 10 to 14 Minutes | 41 | 7.0% |
| 15 to 19 Minutes | 60 | 10.3% |
| 20 to 24 Minutes | 38 | 6.5% |
| 25 to 29 Minutes | 21 | 3.6% |
| 30 to 34 Minutes | 64 | 11.0% |
| 35 to 39 Minutes | 20 | 3.4% |
| 40 to 44 Minutes | 18 | 3.1% |
| 45 to 59 Minutes | 13 | 2.2% |
| 60 to 89 Minutes | 0 | 0.0% |
| 90 or more Minutes | 5 | 0.9% |
Commute Time by Sex in Cavalier
The most common commute times in Cavalier are 5 to 9 minutes (81 commuters, 25.1%) for males and less than 5 minutes (85 commuters, 32.7%) for females.
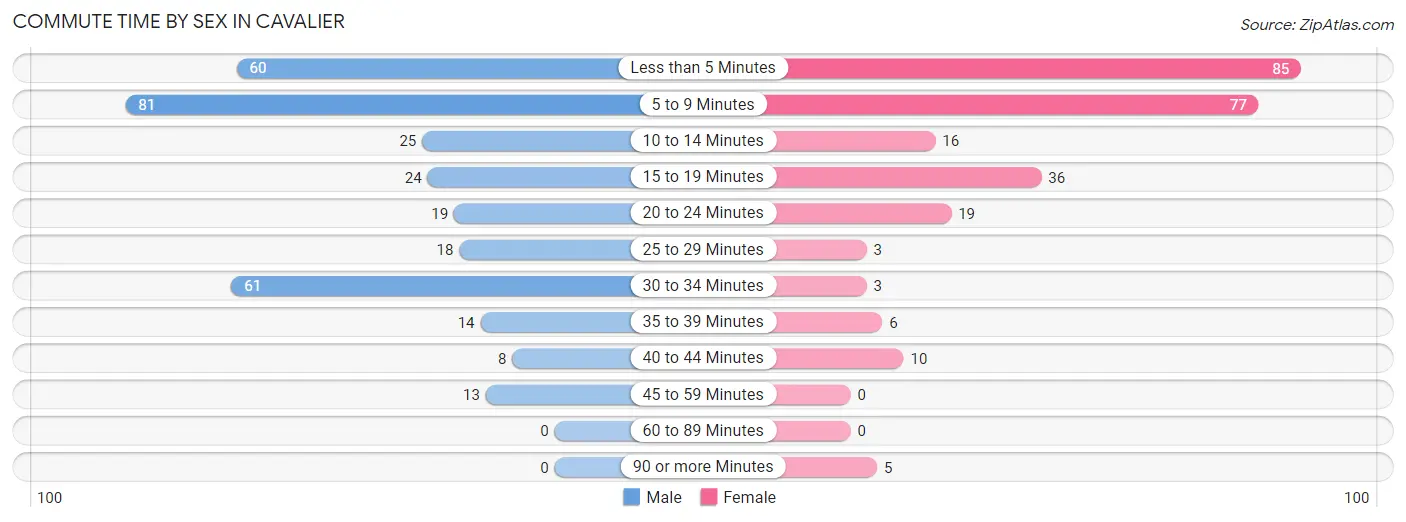
| Commute Time | Male | Female |
| Less than 5 Minutes | 60 (18.6%) | 85 (32.7%) |
| 5 to 9 Minutes | 81 (25.1%) | 77 (29.6%) |
| 10 to 14 Minutes | 25 (7.7%) | 16 (6.1%) |
| 15 to 19 Minutes | 24 (7.4%) | 36 (13.9%) |
| 20 to 24 Minutes | 19 (5.9%) | 19 (7.3%) |
| 25 to 29 Minutes | 18 (5.6%) | 3 (1.1%) |
| 30 to 34 Minutes | 61 (18.9%) | 3 (1.1%) |
| 35 to 39 Minutes | 14 (4.3%) | 6 (2.3%) |
| 40 to 44 Minutes | 8 (2.5%) | 10 (3.8%) |
| 45 to 59 Minutes | 13 (4.0%) | 0 (0.0%) |
| 60 to 89 Minutes | 0 (0.0%) | 0 (0.0%) |
| 90 or more Minutes | 0 (0.0%) | 5 (1.9%) |
Time of Departure to Work by Sex in Cavalier
The most frequent times of departure to work in Cavalier are 7:30 AM to 7:59 AM (86, 26.6%) for males and 7:00 AM to 7:29 AM (52, 20.0%) for females.
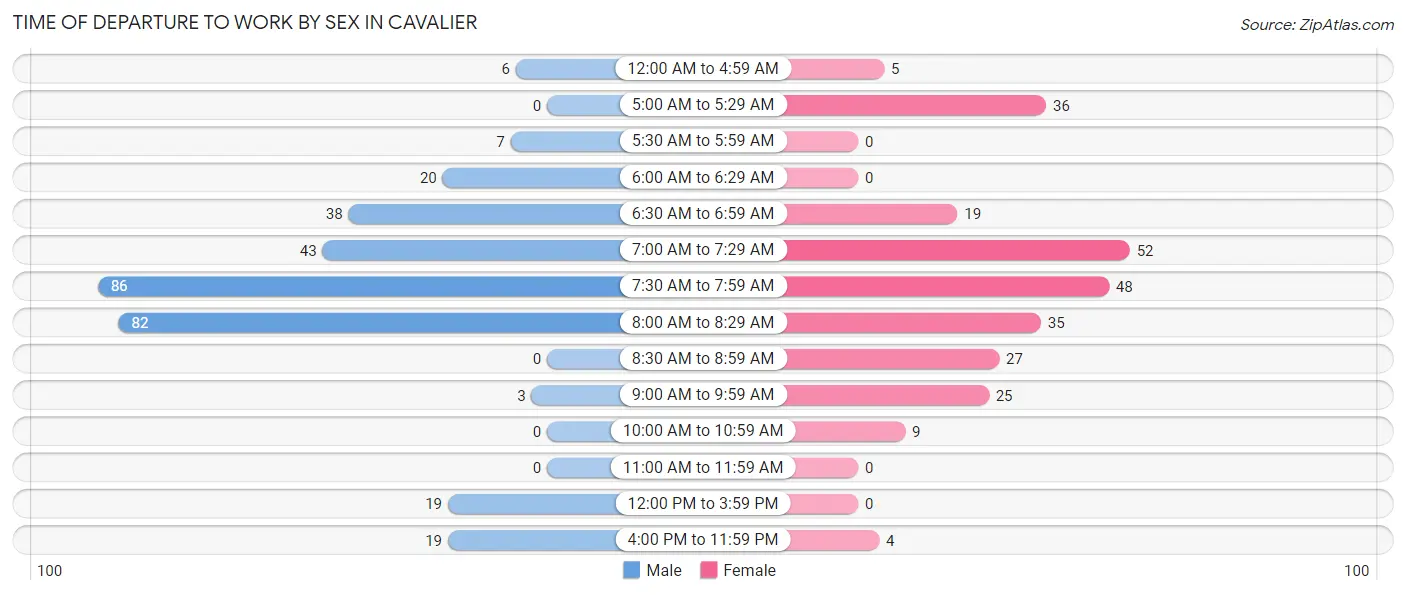
| Time of Departure | Male | Female |
| 12:00 AM to 4:59 AM | 6 (1.9%) | 5 (1.9%) |
| 5:00 AM to 5:29 AM | 0 (0.0%) | 36 (13.9%) |
| 5:30 AM to 5:59 AM | 7 (2.2%) | 0 (0.0%) |
| 6:00 AM to 6:29 AM | 20 (6.2%) | 0 (0.0%) |
| 6:30 AM to 6:59 AM | 38 (11.8%) | 19 (7.3%) |
| 7:00 AM to 7:29 AM | 43 (13.3%) | 52 (20.0%) |
| 7:30 AM to 7:59 AM | 86 (26.6%) | 48 (18.5%) |
| 8:00 AM to 8:29 AM | 82 (25.4%) | 35 (13.5%) |
| 8:30 AM to 8:59 AM | 0 (0.0%) | 27 (10.4%) |
| 9:00 AM to 9:59 AM | 3 (0.9%) | 25 (9.6%) |
| 10:00 AM to 10:59 AM | 0 (0.0%) | 9 (3.5%) |
| 11:00 AM to 11:59 AM | 0 (0.0%) | 0 (0.0%) |
| 12:00 PM to 3:59 PM | 19 (5.9%) | 0 (0.0%) |
| 4:00 PM to 11:59 PM | 19 (5.9%) | 4 (1.5%) |
| Total | 323 (100.0%) | 260 (100.0%) |
Housing Occupancy in Cavalier
Occupancy by Ownership in Cavalier
Of the total 641 dwellings in Cavalier, owner-occupied units account for 327 (51.0%), while renter-occupied units make up 314 (49.0%).
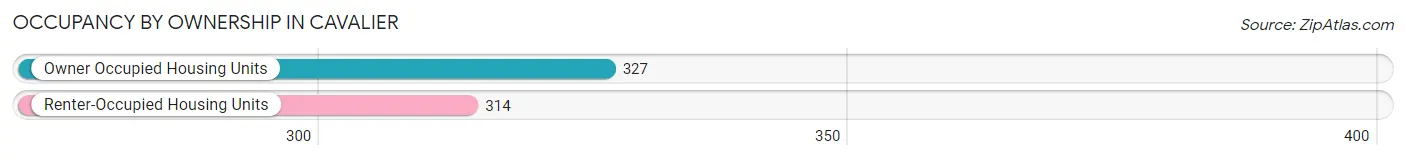
| Occupancy | # Housing Units | % Housing Units |
| Owner Occupied Housing Units | 327 | 51.0% |
| Renter-Occupied Housing Units | 314 | 49.0% |
| Total Occupied Housing Units | 641 | 100.0% |
Occupancy by Household Size in Cavalier
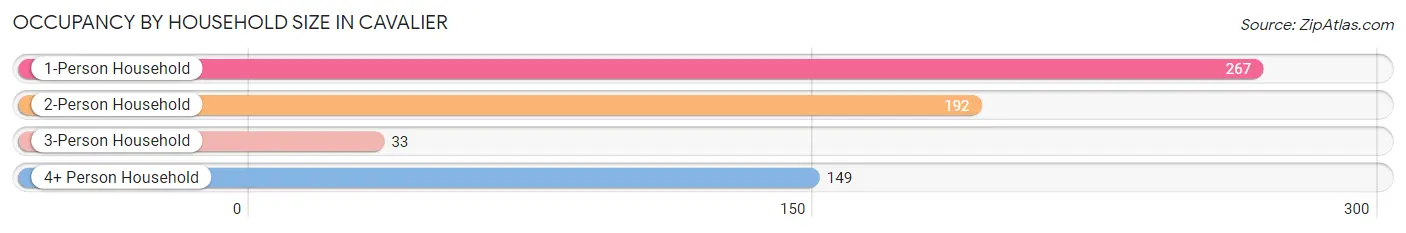
| Household Size | # Housing Units | % Housing Units |
| 1-Person Household | 267 | 41.6% |
| 2-Person Household | 192 | 29.9% |
| 3-Person Household | 33 | 5.1% |
| 4+ Person Household | 149 | 23.2% |
| Total Housing Units | 641 | 100.0% |
Occupancy by Ownership by Household Size in Cavalier
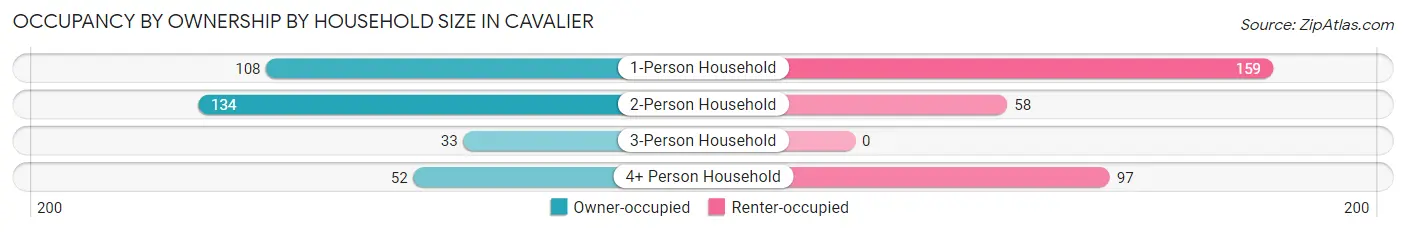
| Household Size | Owner-occupied | Renter-occupied |
| 1-Person Household | 108 (40.5%) | 159 (59.6%) |
| 2-Person Household | 134 (69.8%) | 58 (30.2%) |
| 3-Person Household | 33 (100.0%) | 0 (0.0%) |
| 4+ Person Household | 52 (34.9%) | 97 (65.1%) |
| Total Housing Units | 327 (51.0%) | 314 (49.0%) |
Occupancy by Educational Attainment in Cavalier
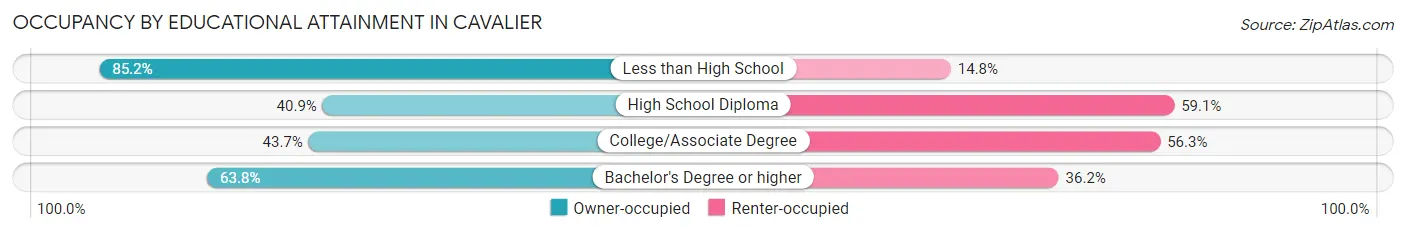
| Household Size | Owner-occupied | Renter-occupied |
| Less than High School | 23 (85.2%) | 4 (14.8%) |
| High School Diploma | 63 (40.9%) | 91 (59.1%) |
| College/Associate Degree | 114 (43.7%) | 147 (56.3%) |
| Bachelor's Degree or higher | 127 (63.8%) | 72 (36.2%) |
Occupancy by Age of Householder in Cavalier
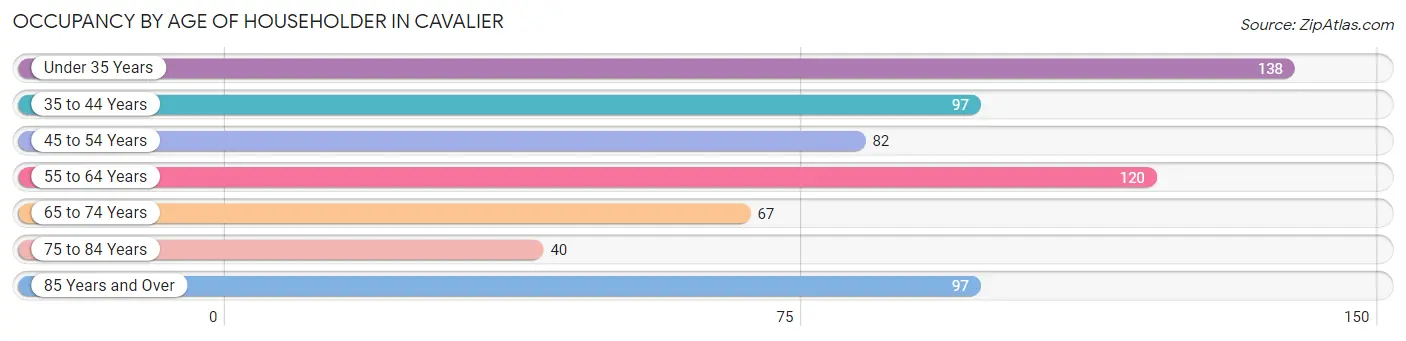
| Age Bracket | # Households | % Households |
| Under 35 Years | 138 | 21.5% |
| 35 to 44 Years | 97 | 15.1% |
| 45 to 54 Years | 82 | 12.8% |
| 55 to 64 Years | 120 | 18.7% |
| 65 to 74 Years | 67 | 10.4% |
| 75 to 84 Years | 40 | 6.2% |
| 85 Years and Over | 97 | 15.1% |
| Total | 641 | 100.0% |
Housing Finances in Cavalier
Median Income by Occupancy in Cavalier
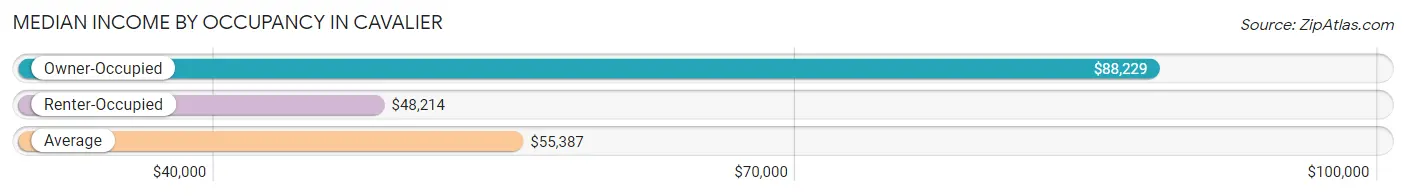
| Occupancy Type | # Households | Median Income |
| Owner-Occupied | 327 (51.0%) | $88,229 |
| Renter-Occupied | 314 (49.0%) | $48,214 |
| Average | 641 (100.0%) | $55,387 |
Occupancy by Householder Income Bracket in Cavalier
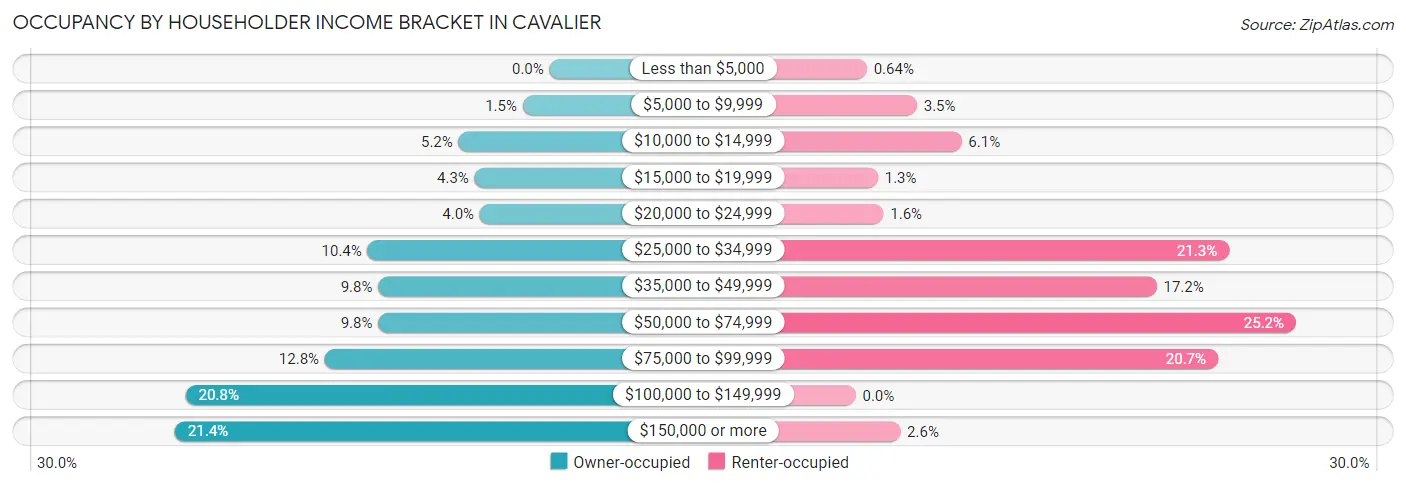
| Income Bracket | Owner-occupied | Renter-occupied |
| Less than $5,000 | 0 (0.0%) | 2 (0.6%) |
| $5,000 to $9,999 | 5 (1.5%) | 11 (3.5%) |
| $10,000 to $14,999 | 17 (5.2%) | 19 (6.0%) |
| $15,000 to $19,999 | 14 (4.3%) | 4 (1.3%) |
| $20,000 to $24,999 | 13 (4.0%) | 5 (1.6%) |
| $25,000 to $34,999 | 34 (10.4%) | 67 (21.3%) |
| $35,000 to $49,999 | 32 (9.8%) | 54 (17.2%) |
| $50,000 to $74,999 | 32 (9.8%) | 79 (25.2%) |
| $75,000 to $99,999 | 42 (12.8%) | 65 (20.7%) |
| $100,000 to $149,999 | 68 (20.8%) | 0 (0.0%) |
| $150,000 or more | 70 (21.4%) | 8 (2.5%) |
| Total | 327 (100.0%) | 314 (100.0%) |
Monthly Housing Cost Tiers in Cavalier
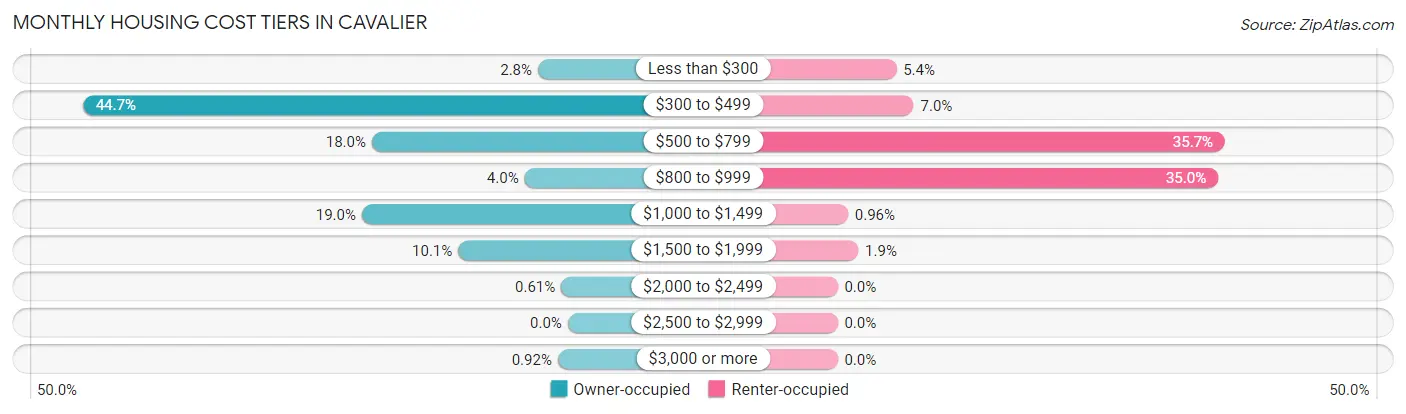
| Monthly Cost | Owner-occupied | Renter-occupied |
| Less than $300 | 9 (2.8%) | 17 (5.4%) |
| $300 to $499 | 146 (44.7%) | 22 (7.0%) |
| $500 to $799 | 59 (18.0%) | 112 (35.7%) |
| $800 to $999 | 13 (4.0%) | 110 (35.0%) |
| $1,000 to $1,499 | 62 (19.0%) | 3 (1.0%) |
| $1,500 to $1,999 | 33 (10.1%) | 6 (1.9%) |
| $2,000 to $2,499 | 2 (0.6%) | 0 (0.0%) |
| $2,500 to $2,999 | 0 (0.0%) | 0 (0.0%) |
| $3,000 or more | 3 (0.9%) | 0 (0.0%) |
| Total | 327 (100.0%) | 314 (100.0%) |
Physical Housing Characteristics in Cavalier
Housing Structures in Cavalier
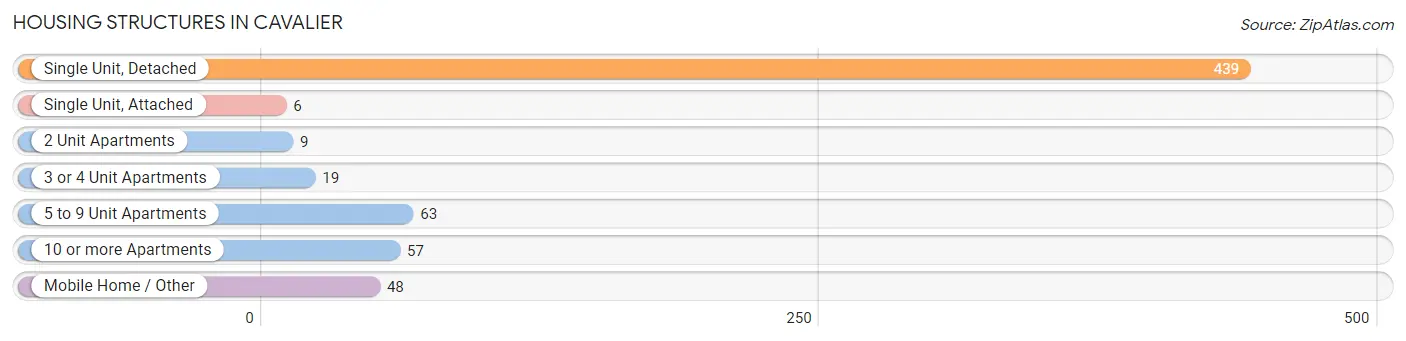
| Structure Type | # Housing Units | % Housing Units |
| Single Unit, Detached | 439 | 68.5% |
| Single Unit, Attached | 6 | 0.9% |
| 2 Unit Apartments | 9 | 1.4% |
| 3 or 4 Unit Apartments | 19 | 3.0% |
| 5 to 9 Unit Apartments | 63 | 9.8% |
| 10 or more Apartments | 57 | 8.9% |
| Mobile Home / Other | 48 | 7.5% |
| Total | 641 | 100.0% |
Housing Structures by Occupancy in Cavalier
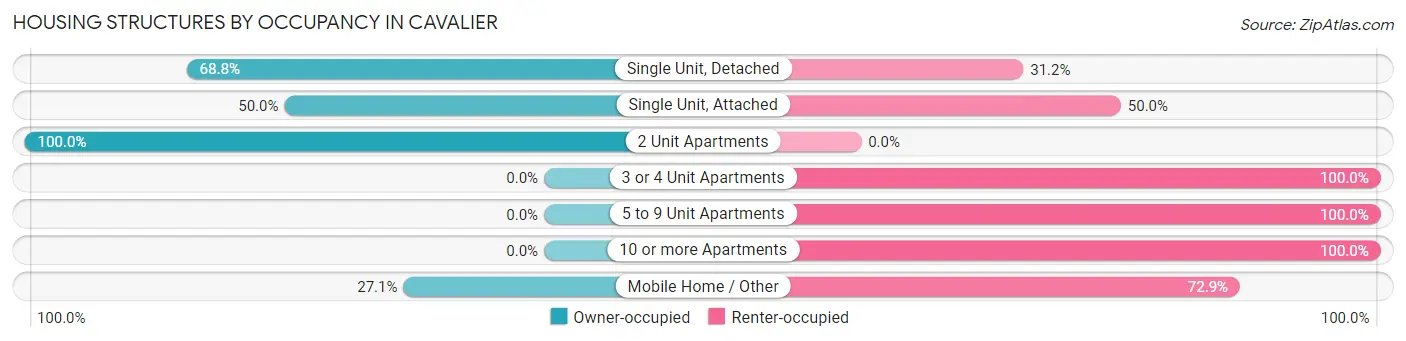
| Structure Type | Owner-occupied | Renter-occupied |
| Single Unit, Detached | 302 (68.8%) | 137 (31.2%) |
| Single Unit, Attached | 3 (50.0%) | 3 (50.0%) |
| 2 Unit Apartments | 9 (100.0%) | 0 (0.0%) |
| 3 or 4 Unit Apartments | 0 (0.0%) | 19 (100.0%) |
| 5 to 9 Unit Apartments | 0 (0.0%) | 63 (100.0%) |
| 10 or more Apartments | 0 (0.0%) | 57 (100.0%) |
| Mobile Home / Other | 13 (27.1%) | 35 (72.9%) |
| Total | 327 (51.0%) | 314 (49.0%) |
Housing Structures by Number of Rooms in Cavalier
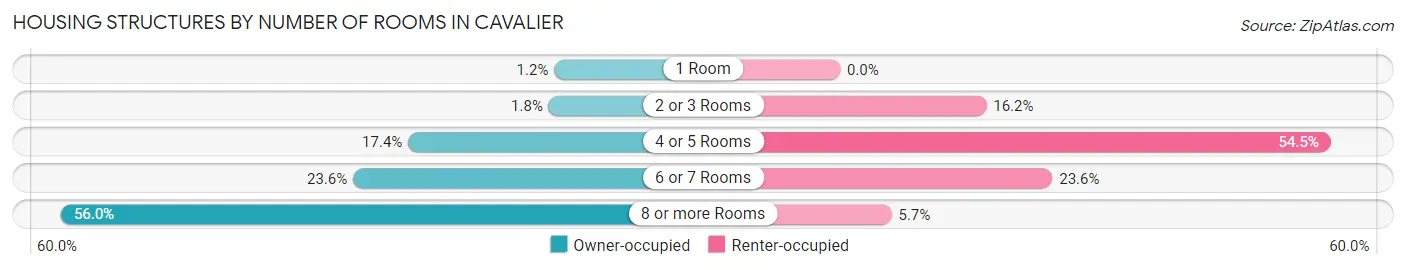
| Number of Rooms | Owner-occupied | Renter-occupied |
| 1 Room | 4 (1.2%) | 0 (0.0%) |
| 2 or 3 Rooms | 6 (1.8%) | 51 (16.2%) |
| 4 or 5 Rooms | 57 (17.4%) | 171 (54.5%) |
| 6 or 7 Rooms | 77 (23.5%) | 74 (23.6%) |
| 8 or more Rooms | 183 (56.0%) | 18 (5.7%) |
| Total | 327 (100.0%) | 314 (100.0%) |
Housing Structure by Heating Type in Cavalier
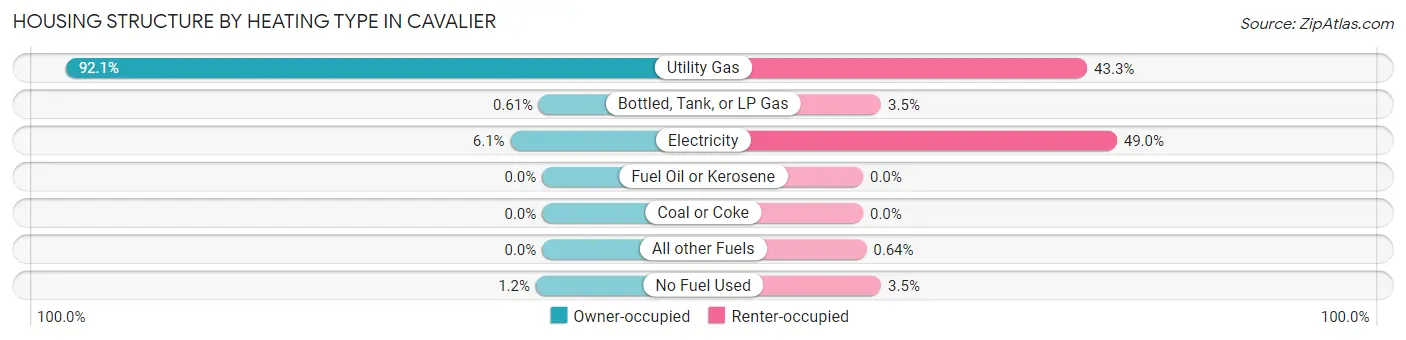
| Heating Type | Owner-occupied | Renter-occupied |
| Utility Gas | 301 (92.0%) | 136 (43.3%) |
| Bottled, Tank, or LP Gas | 2 (0.6%) | 11 (3.5%) |
| Electricity | 20 (6.1%) | 154 (49.0%) |
| Fuel Oil or Kerosene | 0 (0.0%) | 0 (0.0%) |
| Coal or Coke | 0 (0.0%) | 0 (0.0%) |
| All other Fuels | 0 (0.0%) | 2 (0.6%) |
| No Fuel Used | 4 (1.2%) | 11 (3.5%) |
| Total | 327 (100.0%) | 314 (100.0%) |
Household Vehicle Usage in Cavalier
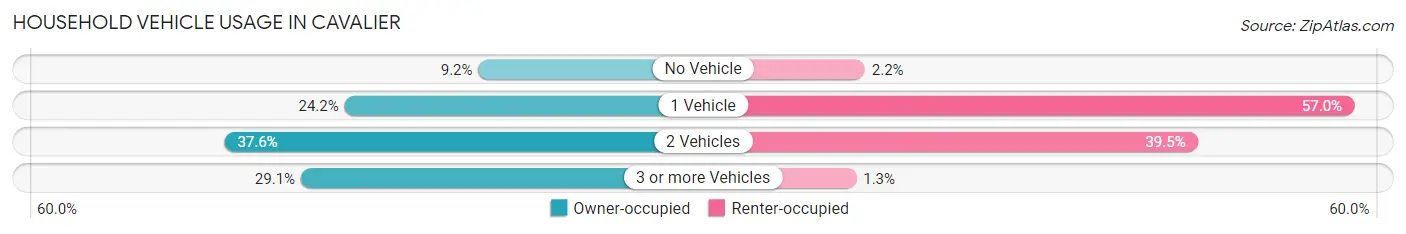
| Vehicles per Household | Owner-occupied | Renter-occupied |
| No Vehicle | 30 (9.2%) | 7 (2.2%) |
| 1 Vehicle | 79 (24.2%) | 179 (57.0%) |
| 2 Vehicles | 123 (37.6%) | 124 (39.5%) |
| 3 or more Vehicles | 95 (29.0%) | 4 (1.3%) |
| Total | 327 (100.0%) | 314 (100.0%) |
Real Estate & Mortgages in Cavalier
Real Estate and Mortgage Overview in Cavalier
| Characteristic | Without Mortgage | With Mortgage |
| Housing Units | 195 | 132 |
| Median Property Value | $118,100 | $184,600 |
| Median Household Income | $51,750 | $37 |
| Monthly Housing Costs | $412 | $3 |
| Real Estate Taxes | $1,212 | $4 |
Property Value by Mortgage Status in Cavalier
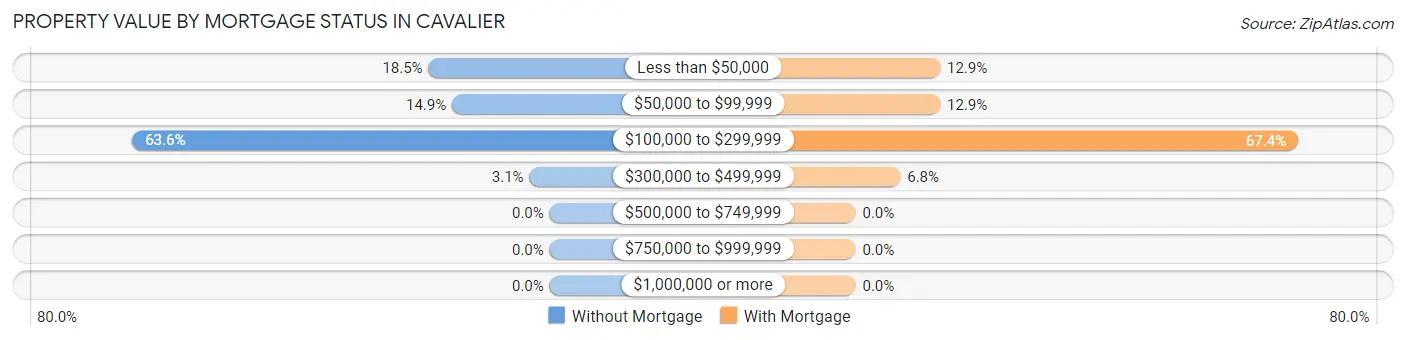
| Property Value | Without Mortgage | With Mortgage |
| Less than $50,000 | 36 (18.5%) | 17 (12.9%) |
| $50,000 to $99,999 | 29 (14.9%) | 17 (12.9%) |
| $100,000 to $299,999 | 124 (63.6%) | 89 (67.4%) |
| $300,000 to $499,999 | 6 (3.1%) | 9 (6.8%) |
| $500,000 to $749,999 | 0 (0.0%) | 0 (0.0%) |
| $750,000 to $999,999 | 0 (0.0%) | 0 (0.0%) |
| $1,000,000 or more | 0 (0.0%) | 0 (0.0%) |
| Total | 195 (100.0%) | 132 (100.0%) |
Household Income by Mortgage Status in Cavalier
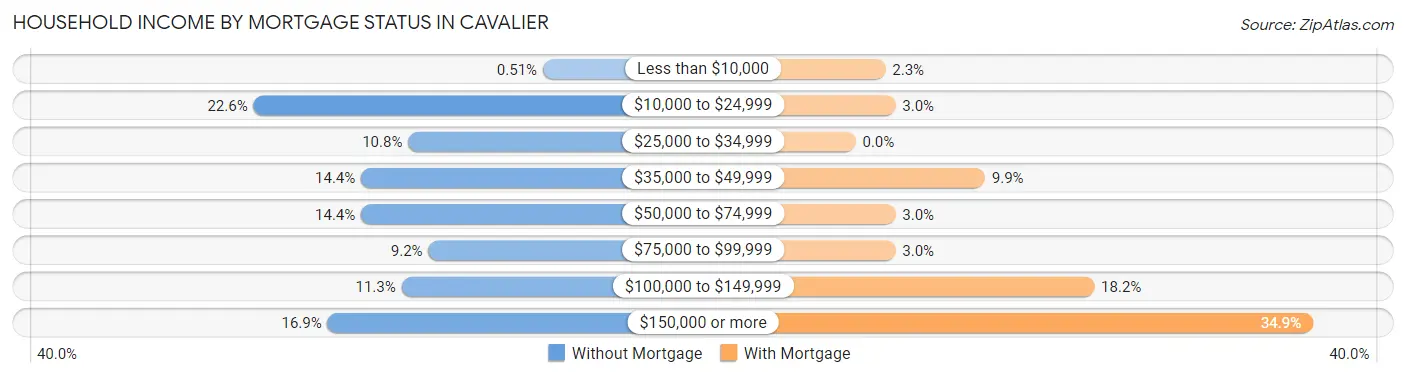
| Household Income | Without Mortgage | With Mortgage |
| Less than $10,000 | 1 (0.5%) | 3 (2.3%) |
| $10,000 to $24,999 | 44 (22.6%) | 4 (3.0%) |
| $25,000 to $34,999 | 21 (10.8%) | 0 (0.0%) |
| $35,000 to $49,999 | 28 (14.4%) | 13 (9.9%) |
| $50,000 to $74,999 | 28 (14.4%) | 4 (3.0%) |
| $75,000 to $99,999 | 18 (9.2%) | 4 (3.0%) |
| $100,000 to $149,999 | 22 (11.3%) | 24 (18.2%) |
| $150,000 or more | 33 (16.9%) | 46 (34.8%) |
| Total | 195 (100.0%) | 132 (100.0%) |
Property Value to Household Income Ratio in Cavalier
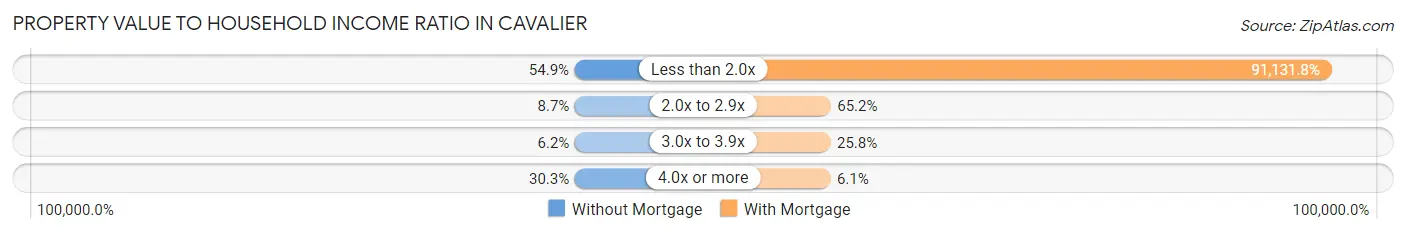
| Value-to-Income Ratio | Without Mortgage | With Mortgage |
| Less than 2.0x | 107 (54.9%) | 120,294 (91,131.8%) |
| 2.0x to 2.9x | 17 (8.7%) | 86 (65.1%) |
| 3.0x to 3.9x | 12 (6.1%) | 34 (25.8%) |
| 4.0x or more | 59 (30.3%) | 8 (6.1%) |
| Total | 195 (100.0%) | 132 (100.0%) |
Real Estate Taxes by Mortgage Status in Cavalier
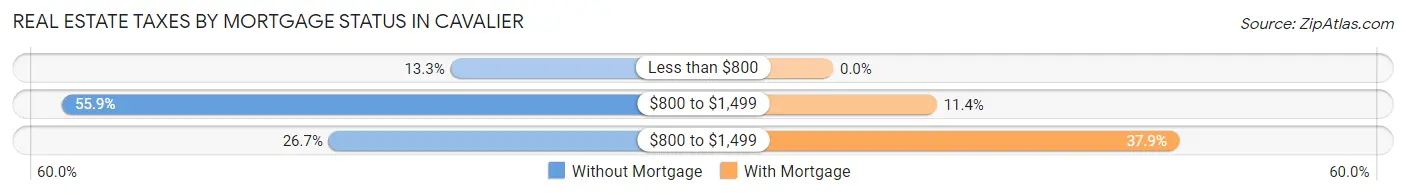
| Property Taxes | Without Mortgage | With Mortgage |
| Less than $800 | 26 (13.3%) | 0 (0.0%) |
| $800 to $1,499 | 109 (55.9%) | 15 (11.4%) |
| $800 to $1,499 | 52 (26.7%) | 50 (37.9%) |
| Total | 195 (100.0%) | 132 (100.0%) |
Health & Disability in Cavalier
Health Insurance Coverage by Age in Cavalier
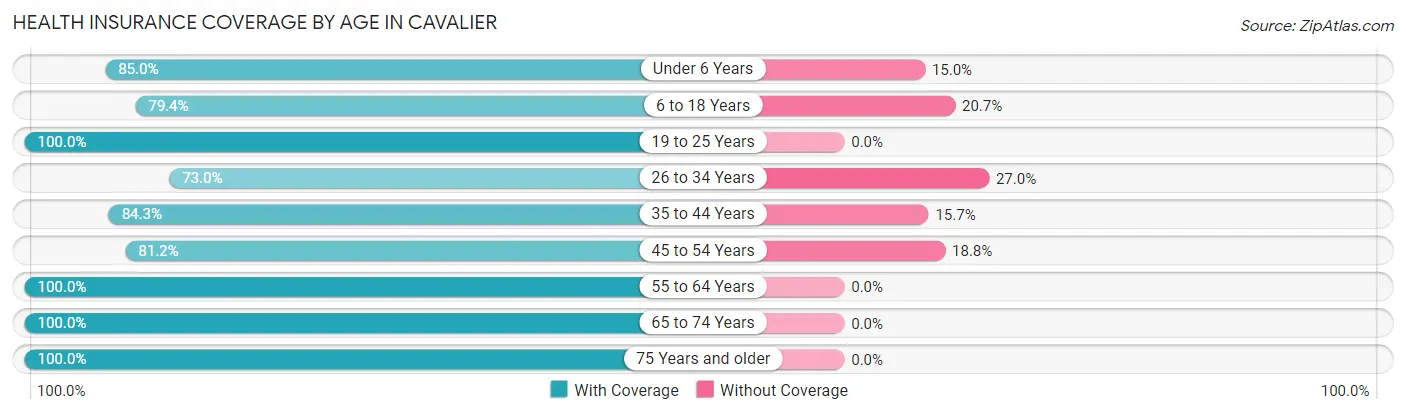
| Age Bracket | With Coverage | Without Coverage |
| Under 6 Years | 96 (85.0%) | 17 (15.0%) |
| 6 to 18 Years | 146 (79.3%) | 38 (20.6%) |
| 19 to 25 Years | 56 (100.0%) | 0 (0.0%) |
| 26 to 34 Years | 138 (73.0%) | 51 (27.0%) |
| 35 to 44 Years | 145 (84.3%) | 27 (15.7%) |
| 45 to 54 Years | 108 (81.2%) | 25 (18.8%) |
| 55 to 64 Years | 179 (100.0%) | 0 (0.0%) |
| 65 to 74 Years | 145 (100.0%) | 0 (0.0%) |
| 75 Years and older | 144 (100.0%) | 0 (0.0%) |
| Total | 1,157 (88.0%) | 158 (12.0%) |
Health Insurance Coverage by Citizenship Status in Cavalier
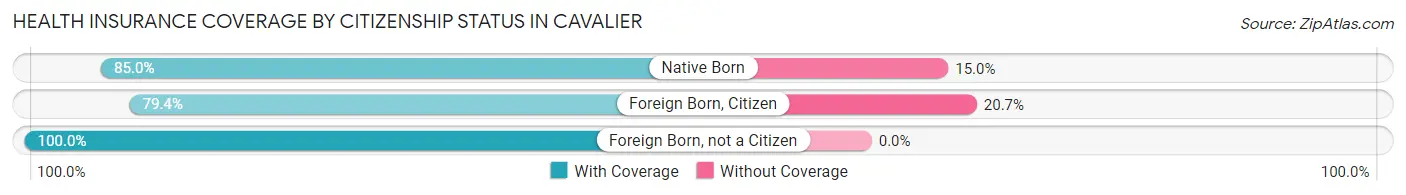
| Citizenship Status | With Coverage | Without Coverage |
| Native Born | 96 (85.0%) | 17 (15.0%) |
| Foreign Born, Citizen | 146 (79.3%) | 38 (20.6%) |
| Foreign Born, not a Citizen | 56 (100.0%) | 0 (0.0%) |
Health Insurance Coverage by Household Income in Cavalier
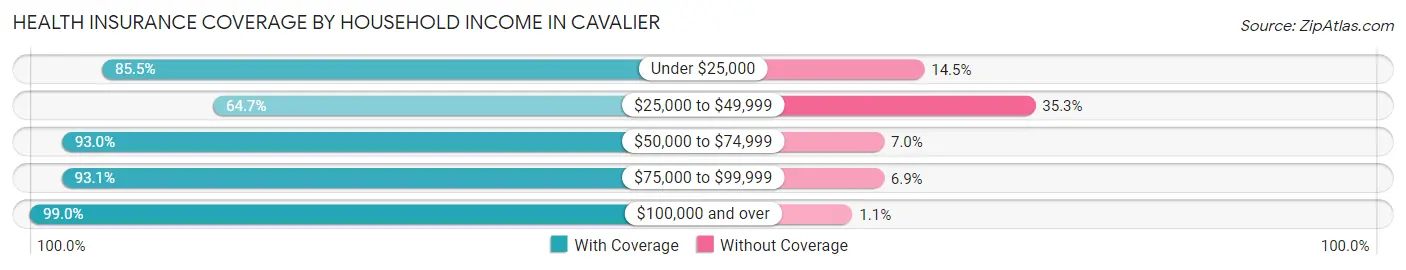
| Household Income | With Coverage | Without Coverage |
| Under $25,000 | 106 (85.5%) | 18 (14.5%) |
| $25,000 to $49,999 | 194 (64.7%) | 106 (35.3%) |
| $50,000 to $74,999 | 160 (93.0%) | 12 (7.0%) |
| $75,000 to $99,999 | 228 (93.1%) | 17 (6.9%) |
| $100,000 and over | 469 (99.0%) | 5 (1.1%) |
Public vs Private Health Insurance Coverage by Age in Cavalier
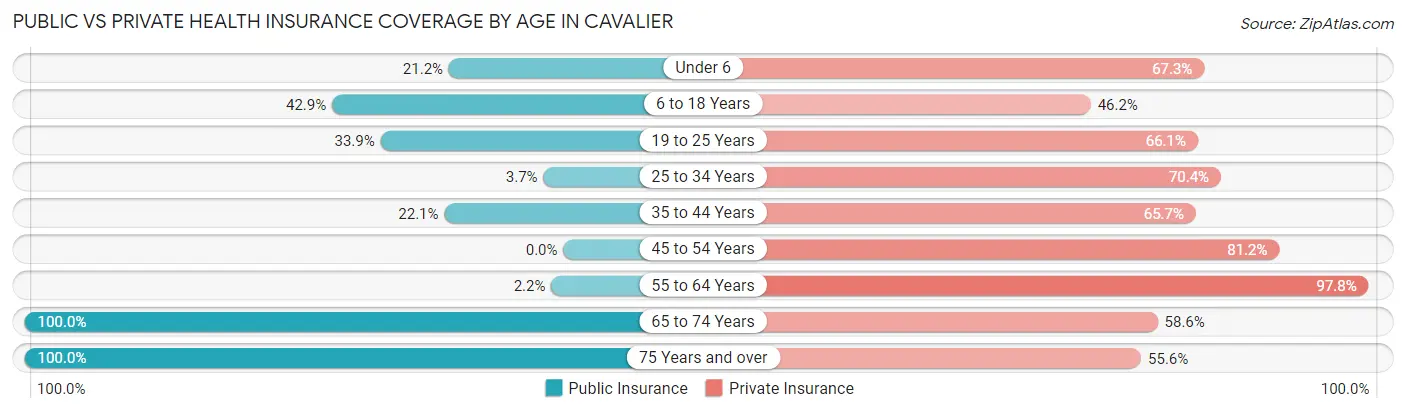
| Age Bracket | Public Insurance | Private Insurance |
| Under 6 | 24 (21.2%) | 76 (67.3%) |
| 6 to 18 Years | 79 (42.9%) | 85 (46.2%) |
| 19 to 25 Years | 19 (33.9%) | 37 (66.1%) |
| 25 to 34 Years | 7 (3.7%) | 133 (70.4%) |
| 35 to 44 Years | 38 (22.1%) | 113 (65.7%) |
| 45 to 54 Years | 0 (0.0%) | 108 (81.2%) |
| 55 to 64 Years | 4 (2.2%) | 175 (97.8%) |
| 65 to 74 Years | 145 (100.0%) | 85 (58.6%) |
| 75 Years and over | 144 (100.0%) | 80 (55.6%) |
| Total | 460 (35.0%) | 892 (67.8%) |
Disability Status by Sex by Age in Cavalier
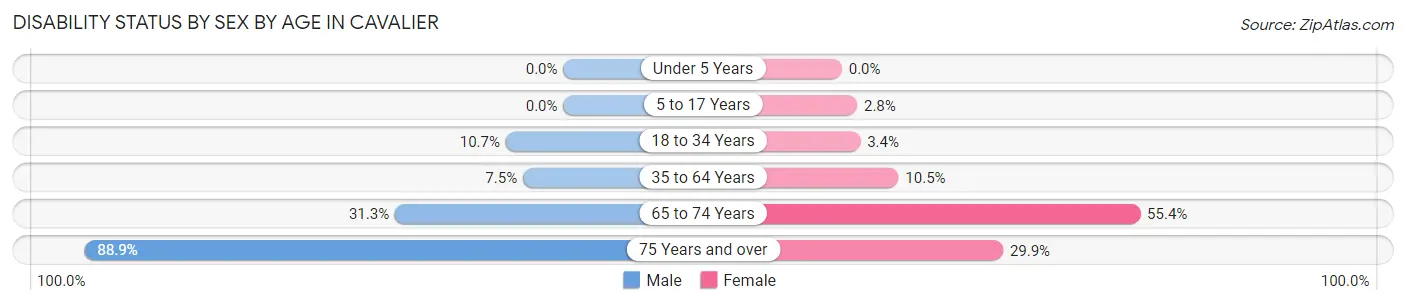
| Age Bracket | Male | Female |
| Under 5 Years | 0 (0.0%) | 0 (0.0%) |
| 5 to 17 Years | 0 (0.0%) | 3 (2.8%) |
| 18 to 34 Years | 14 (10.7%) | 5 (3.4%) |
| 35 to 64 Years | 17 (7.5%) | 27 (10.5%) |
| 65 to 74 Years | 25 (31.2%) | 36 (55.4%) |
| 75 Years and over | 24 (88.9%) | 35 (29.9%) |
Disability Class by Sex by Age in Cavalier
Disability Class: Hearing Difficulty
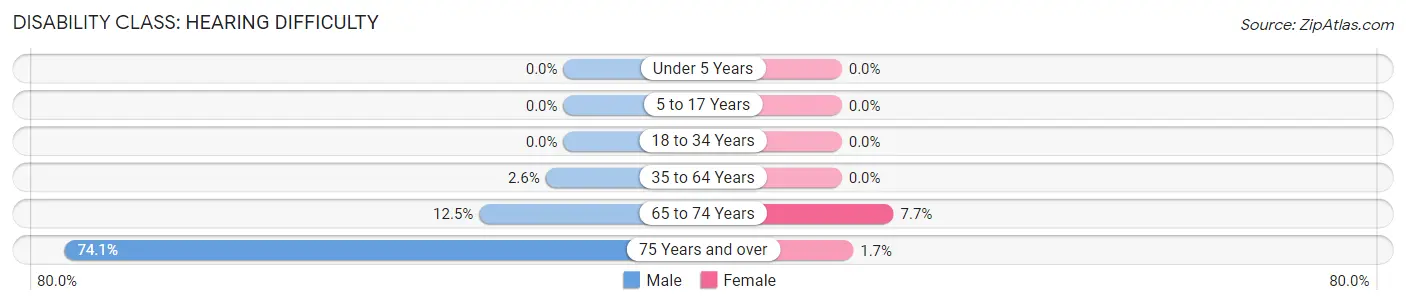
| Age Bracket | Male | Female |
| Under 5 Years | 0 (0.0%) | 0 (0.0%) |
| 5 to 17 Years | 0 (0.0%) | 0 (0.0%) |
| 18 to 34 Years | 0 (0.0%) | 0 (0.0%) |
| 35 to 64 Years | 6 (2.6%) | 0 (0.0%) |
| 65 to 74 Years | 10 (12.5%) | 5 (7.7%) |
| 75 Years and over | 20 (74.1%) | 2 (1.7%) |
Disability Class: Vision Difficulty
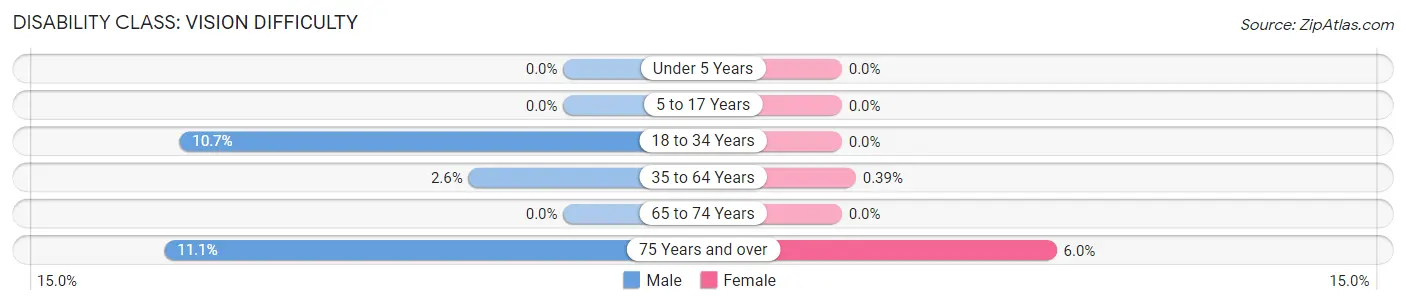
| Age Bracket | Male | Female |
| Under 5 Years | 0 (0.0%) | 0 (0.0%) |
| 5 to 17 Years | 0 (0.0%) | 0 (0.0%) |
| 18 to 34 Years | 14 (10.7%) | 0 (0.0%) |
| 35 to 64 Years | 6 (2.6%) | 1 (0.4%) |
| 65 to 74 Years | 0 (0.0%) | 0 (0.0%) |
| 75 Years and over | 3 (11.1%) | 7 (6.0%) |
Disability Class: Cognitive Difficulty
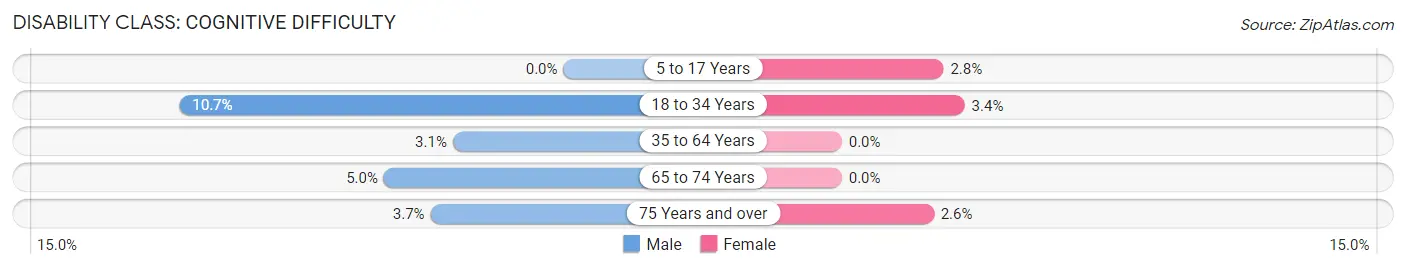
| Age Bracket | Male | Female |
| 5 to 17 Years | 0 (0.0%) | 3 (2.8%) |
| 18 to 34 Years | 14 (10.7%) | 5 (3.4%) |
| 35 to 64 Years | 7 (3.1%) | 0 (0.0%) |
| 65 to 74 Years | 4 (5.0%) | 0 (0.0%) |
| 75 Years and over | 1 (3.7%) | 3 (2.6%) |
Disability Class: Ambulatory Difficulty
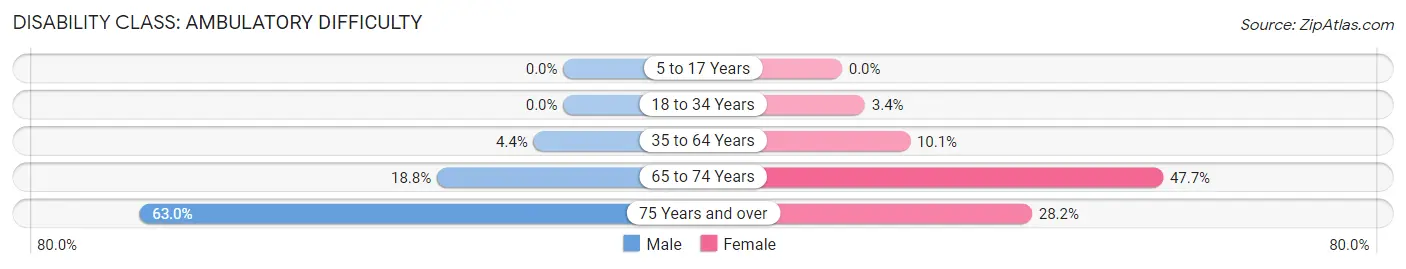
| Age Bracket | Male | Female |
| 5 to 17 Years | 0 (0.0%) | 0 (0.0%) |
| 18 to 34 Years | 0 (0.0%) | 5 (3.4%) |
| 35 to 64 Years | 10 (4.4%) | 26 (10.1%) |
| 65 to 74 Years | 15 (18.8%) | 31 (47.7%) |
| 75 Years and over | 17 (63.0%) | 33 (28.2%) |
Disability Class: Self-Care Difficulty
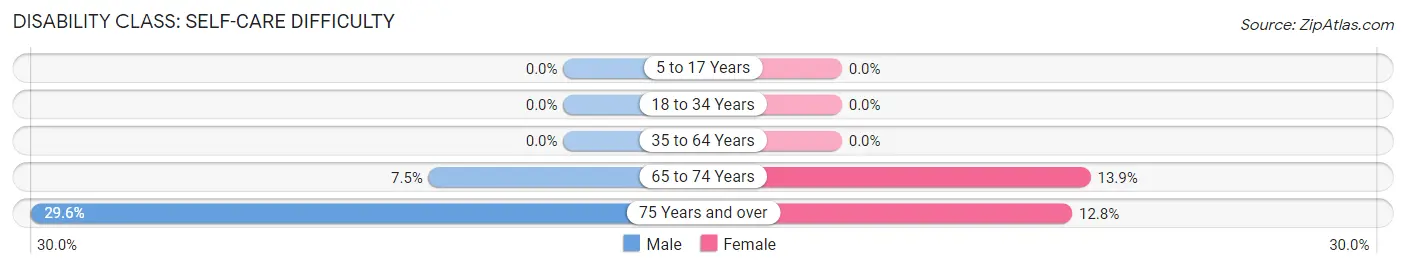
| Age Bracket | Male | Female |
| 5 to 17 Years | 0 (0.0%) | 0 (0.0%) |
| 18 to 34 Years | 0 (0.0%) | 0 (0.0%) |
| 35 to 64 Years | 0 (0.0%) | 0 (0.0%) |
| 65 to 74 Years | 6 (7.5%) | 9 (13.9%) |
| 75 Years and over | 8 (29.6%) | 15 (12.8%) |
Technology Access in Cavalier
Computing Device Access in Cavalier
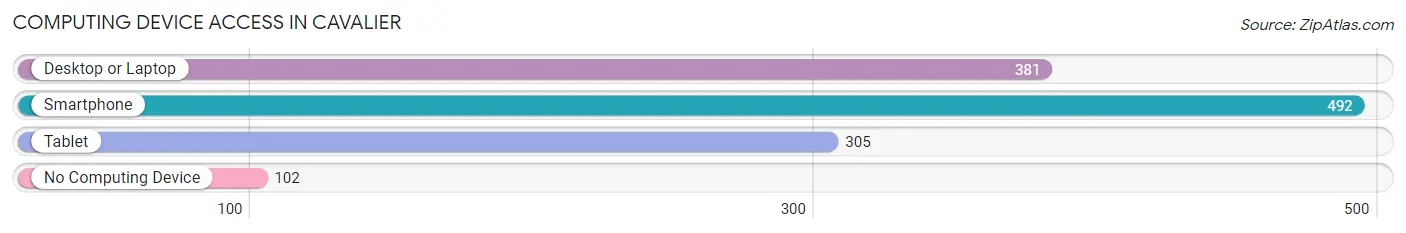
| Device Type | # Households | % Households |
| Desktop or Laptop | 381 | 59.4% |
| Smartphone | 492 | 76.8% |
| Tablet | 305 | 47.6% |
| No Computing Device | 102 | 15.9% |
| Total | 641 | 100.0% |
Internet Access in Cavalier
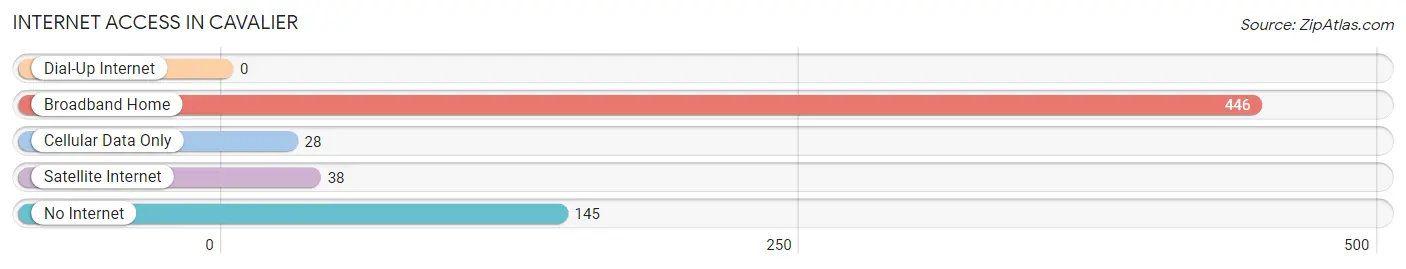
| Internet Type | # Households | % Households |
| Dial-Up Internet | 0 | 0.0% |
| Broadband Home | 446 | 69.6% |
| Cellular Data Only | 28 | 4.4% |
| Satellite Internet | 38 | 5.9% |
| No Internet | 145 | 22.6% |
| Total | 641 | 100.0% |
Cavalier Summary
Cavalier, North Dakota is a small city located in the northeastern corner of the state. It is the county seat of Cavalier County and is situated on the banks of the Pembina River. The city has a population of 1,541 as of the 2010 census.
History
Cavalier was founded in 1882 and was named after the French word for knight. The city was originally a trading post for the local Native American tribes. In 1883, the Northern Pacific Railway was built through the area, and the city quickly grew. The city was incorporated in 1884 and was the first city in the state to have electric lights.
In the early 1900s, Cavalier was a bustling city with a variety of businesses, including a bank, a hotel, a newspaper, and a variety of stores. The city was also home to a number of churches, schools, and a hospital.
In the 1950s, the city began to decline as the railroad industry began to decline. The city was hit hard by the Great Depression and the Dust Bowl. The population of the city dropped from 1,845 in 1930 to 1,541 in 2010.
Geography
Cavalier is located in the northeastern corner of North Dakota, near the Canadian border. The city is situated on the banks of the Pembina River and is surrounded by rolling hills and prairies. The city is located in the Red River Valley, which is known for its fertile soil and abundant wildlife.
The city has a total area of 1.2 square miles, all of which is land. The city has a humid continental climate, with cold winters and hot summers. The average temperature in the summer is around 75 degrees Fahrenheit, and the average temperature in the winter is around 10 degrees Fahrenheit.
Economy
Cavalier’s economy is largely based on agriculture. The city is home to a number of farms and ranches, and the surrounding area is known for its production of wheat, barley, oats, and other grains. The city is also home to a number of businesses, including a grocery store, a hardware store, and a variety of restaurants.
The city is also home to a number of manufacturing companies, including a furniture factory, a plastics factory, and a metal fabrication plant. The city is also home to a number of service-based businesses, including a hospital, a bank, and a variety of other businesses.
Demographics
As of the 2010 census, the population of Cavalier was 1,541. The racial makeup of the city was 97.3% White, 0.3% African American, 0.2% Native American, 0.2% Asian, 0.1% Pacific Islander, 0.7% from other races, and 1.3% from two or more races. Hispanic or Latino of any race were 1.7% of the population.
The median income for a household in the city was $37,917, and the median income for a family was $45,625. The per capita income for the city was $18,945. About 11.2% of families and 14.2% of the population were below the poverty line, including 18.2% of those under age 18 and 8.3% of those age 65 or over.
Cavalier is a small city with a rich history and a diverse economy. The city is home to a variety of businesses, and the surrounding area is known for its agricultural production. The city has a population of 1,541, and the median income for a household is $37,917. The city is a great place to live and work, and it is a great place to raise a family.
Common Questions
What is Per Capita Income in Cavalier?
Per Capita income in Cavalier is $42,409.
What is the Median Family Income in Cavalier?
Median Family Income in Cavalier is $87,847.
What is the Median Household income in Cavalier?
Median Household Income in Cavalier is $55,387.
What is Income or Wage Gap in Cavalier?
Income or Wage Gap in Cavalier is 39.7%.
Women in Cavalier earn 60.3 cents for every dollar earned by a man.
What is Inequality or Gini Index in Cavalier?
Inequality or Gini Index in Cavalier is 0.47.
What is the Total Population of Cavalier?
Total Population of Cavalier is 1,360.
What is the Total Male Population of Cavalier?
Total Male Population of Cavalier is 590.
What is the Total Female Population of Cavalier?
Total Female Population of Cavalier is 770.
What is the Ratio of Males per 100 Females in Cavalier?
There are 76.62 Males per 100 Females in Cavalier.
What is the Ratio of Females per 100 Males in Cavalier?
There are 130.51 Females per 100 Males in Cavalier.
What is the Median Population Age in Cavalier?
Median Population Age in Cavalier is 43.4 Years.
What is the Average Family Size in Cavalier
Average Family Size in Cavalier is 2.8 People.
What is the Average Household Size in Cavalier
Average Household Size in Cavalier is 2.0 People.
How Large is the Labor Force in Cavalier?
There are 721 People in the Labor Forcein in Cavalier.
What is the Percentage of People in the Labor Force in Cavalier?
65.0% of People are in the Labor Force in Cavalier.
What is the Unemployment Rate in Cavalier?
Unemployment Rate in Cavalier is 10.4%.