New Salem, ND Map & Demographics
New Salem Map
New Salem Overview
$29,571
PER CAPITA INCOME
$78,250
AVG FAMILY INCOME
$70,469
AVG HOUSEHOLD INCOME
55.3%
WAGE / INCOME GAP [ % ]
44.7¢/ $1
WAGE / INCOME GAP [ $ ]
0.32
INEQUALITY / GINI INDEX
939
TOTAL POPULATION
429
MALE POPULATION
510
FEMALE POPULATION
84.12
MALES / 100 FEMALES
118.88
FEMALES / 100 MALES
34.9
MEDIAN AGE
3.1
AVG FAMILY SIZE
2.5
AVG HOUSEHOLD SIZE
470
LABOR FORCE [ PEOPLE ]
62.3%
PERCENT IN LABOR FORCE
3.2%
UNEMPLOYMENT RATE
New Salem Zip Codes
New Salem Area Codes
Income in New Salem
Income Overview in New Salem
Per Capita Income in New Salem is $29,571, while median incomes of families and households are $78,250 and $70,469 respectively.
| Characteristic | Number | Measure |
| Per Capita Income | 939 | $29,571 |
| Median Family Income | 207 | $78,250 |
| Mean Family Income | 207 | $86,747 |
| Median Household Income | 336 | $70,469 |
| Mean Household Income | 336 | $73,928 |
| Income Deficit | 207 | $0 |
| Wage / Income Gap (%) | 939 | 55.32% |
| Wage / Income Gap ($) | 939 | 44.68¢ per $1 |
| Gini / Inequality Index | 939 | 0.32 |
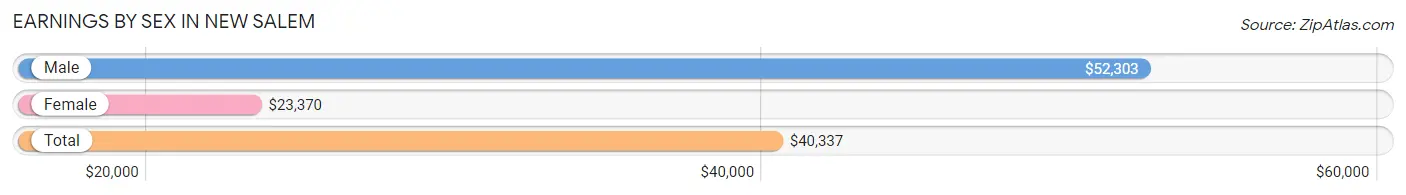
Earnings by Sex in New Salem
Average Earnings in New Salem are $40,337, $52,303 for men and $23,370 for women, a difference of 55.3%.
| Sex | Number | Average Earnings |
| Male | 231 (46.9%) | $52,303 |
| Female | 262 (53.1%) | $23,370 |
| Total | 493 (100.0%) | $40,337 |
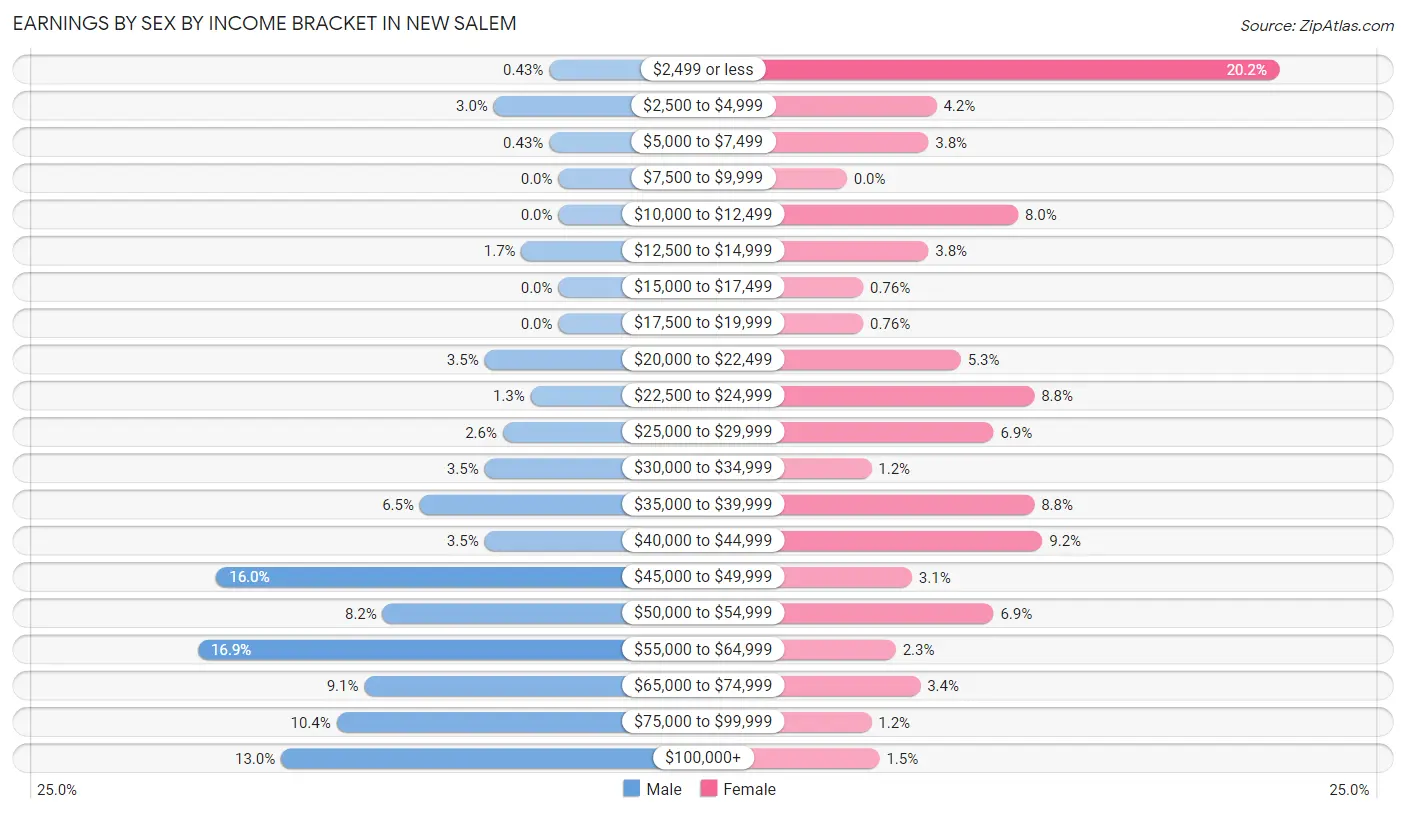
Earnings by Sex by Income Bracket in New Salem
The most common earnings brackets in New Salem are $55,000 to $64,999 for men (39 | 16.9%) and $2,499 or less for women (53 | 20.2%).
| Income | Male | Female |
| $2,499 or less | 1 (0.4%) | 53 (20.2%) |
| $2,500 to $4,999 | 7 (3.0%) | 11 (4.2%) |
| $5,000 to $7,499 | 1 (0.4%) | 10 (3.8%) |
| $7,500 to $9,999 | 0 (0.0%) | 0 (0.0%) |
| $10,000 to $12,499 | 0 (0.0%) | 21 (8.0%) |
| $12,500 to $14,999 | 4 (1.7%) | 10 (3.8%) |
| $15,000 to $17,499 | 0 (0.0%) | 2 (0.8%) |
| $17,500 to $19,999 | 0 (0.0%) | 2 (0.8%) |
| $20,000 to $22,499 | 8 (3.5%) | 14 (5.3%) |
| $22,500 to $24,999 | 3 (1.3%) | 23 (8.8%) |
| $25,000 to $29,999 | 6 (2.6%) | 18 (6.9%) |
| $30,000 to $34,999 | 8 (3.5%) | 3 (1.1%) |
| $35,000 to $39,999 | 15 (6.5%) | 23 (8.8%) |
| $40,000 to $44,999 | 8 (3.5%) | 24 (9.2%) |
| $45,000 to $49,999 | 37 (16.0%) | 8 (3.0%) |
| $50,000 to $54,999 | 19 (8.2%) | 18 (6.9%) |
| $55,000 to $64,999 | 39 (16.9%) | 6 (2.3%) |
| $65,000 to $74,999 | 21 (9.1%) | 9 (3.4%) |
| $75,000 to $99,999 | 24 (10.4%) | 3 (1.1%) |
| $100,000+ | 30 (13.0%) | 4 (1.5%) |
| Total | 231 (100.0%) | 262 (100.0%) |
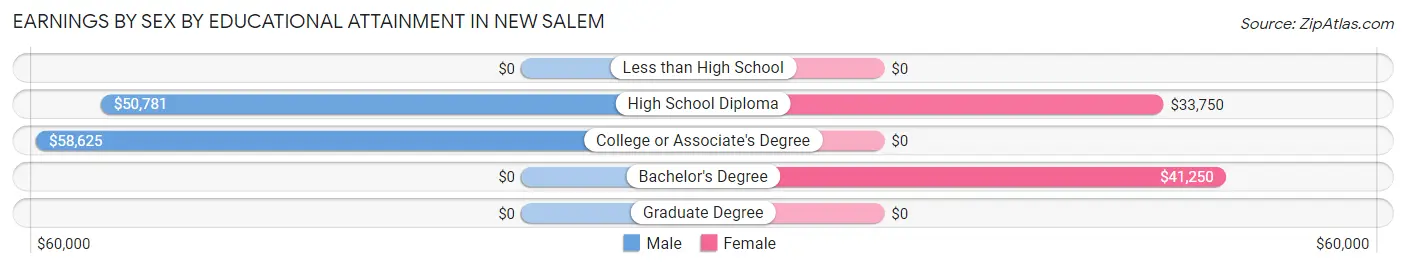
Earnings by Sex by Educational Attainment in New Salem
Average earnings in New Salem are $55,341 for men and $24,837 for women, a difference of 55.1%. Men with an educational attainment of college or associate's degree enjoy the highest average annual earnings of $58,625, while those with high school diploma education earn the least with $50,781. Women with an educational attainment of bachelor's degree earn the most with the average annual earnings of $41,250, while those with high school diploma education have the smallest earnings of $33,750.
| Educational Attainment | Male Income | Female Income |
| Less than High School | - | - |
| High School Diploma | $50,781 | $33,750 |
| College or Associate's Degree | $58,625 | $0 |
| Bachelor's Degree | - | - |
| Graduate Degree | - | - |
| Total | $55,341 | $24,837 |
Family Income in New Salem
Family Income Brackets in New Salem
According to the New Salem family income data, there are 76 families falling into the $100,000 to $149,999 income range, which is the most common income bracket and makes up 36.7% of all families. Conversely, the less than $10,000 income bracket is the least frequent group with only 1 families (0.5%) belonging to this category.
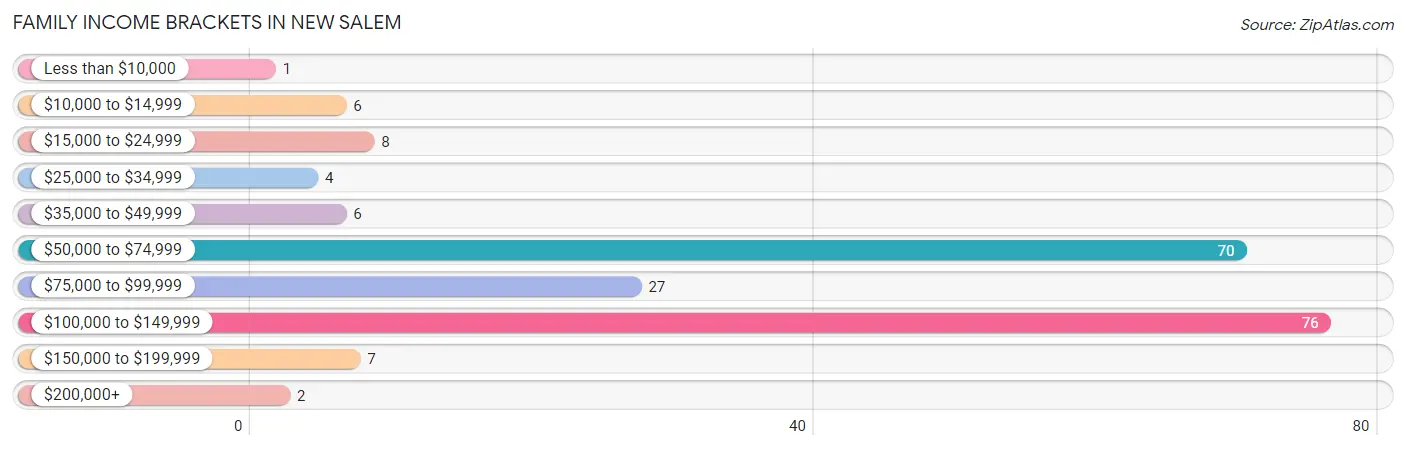
| Income Bracket | # Families | % Families |
| Less than $10,000 | 1 | 0.5% |
| $10,000 to $14,999 | 6 | 2.9% |
| $15,000 to $24,999 | 8 | 3.9% |
| $25,000 to $34,999 | 4 | 1.9% |
| $35,000 to $49,999 | 6 | 2.9% |
| $50,000 to $74,999 | 70 | 33.8% |
| $75,000 to $99,999 | 27 | 13.0% |
| $100,000 to $149,999 | 76 | 36.7% |
| $150,000 to $199,999 | 7 | 3.4% |
| $200,000+ | 2 | 1.0% |
Family Income by Famaliy Size in New Salem
3-person families (63 | 30.4%) account for the highest median family income in New Salem with $101,563 per family, while 3-person families (63 | 30.4%) have the highest median income of $33,854 per family member.
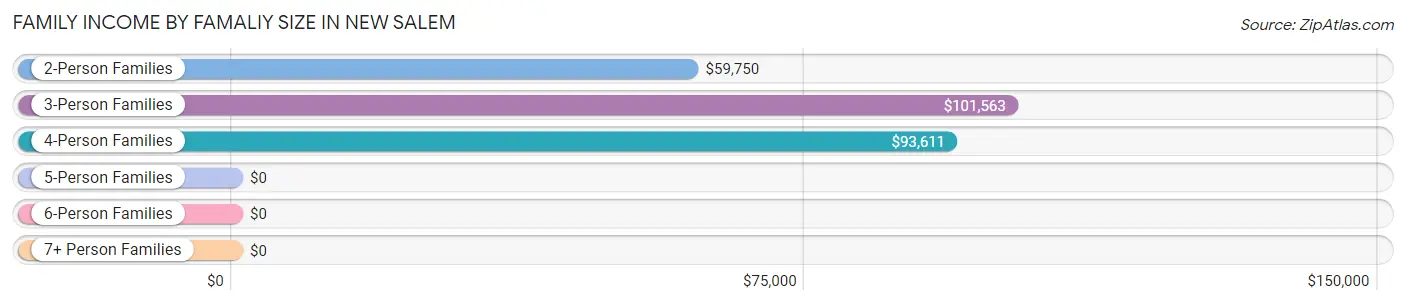
| Income Bracket | # Families | Median Income |
| 2-Person Families | 77 (37.2%) | $59,750 |
| 3-Person Families | 63 (30.4%) | $101,563 |
| 4-Person Families | 62 (29.9%) | $93,611 |
| 5-Person Families | 1 (0.5%) | $0 |
| 6-Person Families | 4 (1.9%) | $0 |
| 7+ Person Families | 0 (0.0%) | $0 |
| Total | 207 (100.0%) | $78,250 |
Family Income by Number of Earners in New Salem
The median family income in New Salem is $78,250, with families comprising 3+ earners (32) having the highest median family income of $103,333, while families with no earners (28) have the lowest median family income of $50,938, accounting for 15.5% and 13.5% of families, respectively.
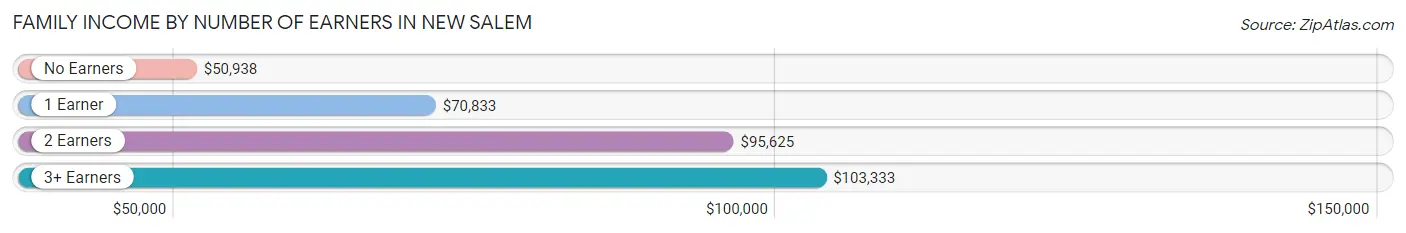
| Number of Earners | # Families | Median Income |
| No Earners | 28 (13.5%) | $50,938 |
| 1 Earner | 56 (27.1%) | $70,833 |
| 2 Earners | 91 (44.0%) | $95,625 |
| 3+ Earners | 32 (15.5%) | $103,333 |
| Total | 207 (100.0%) | $78,250 |
Household Income in New Salem
Household Income Brackets in New Salem
With 86 households falling in the category, the $50,000 to $74,999 income range is the most frequent in New Salem, accounting for 25.6% of all households.
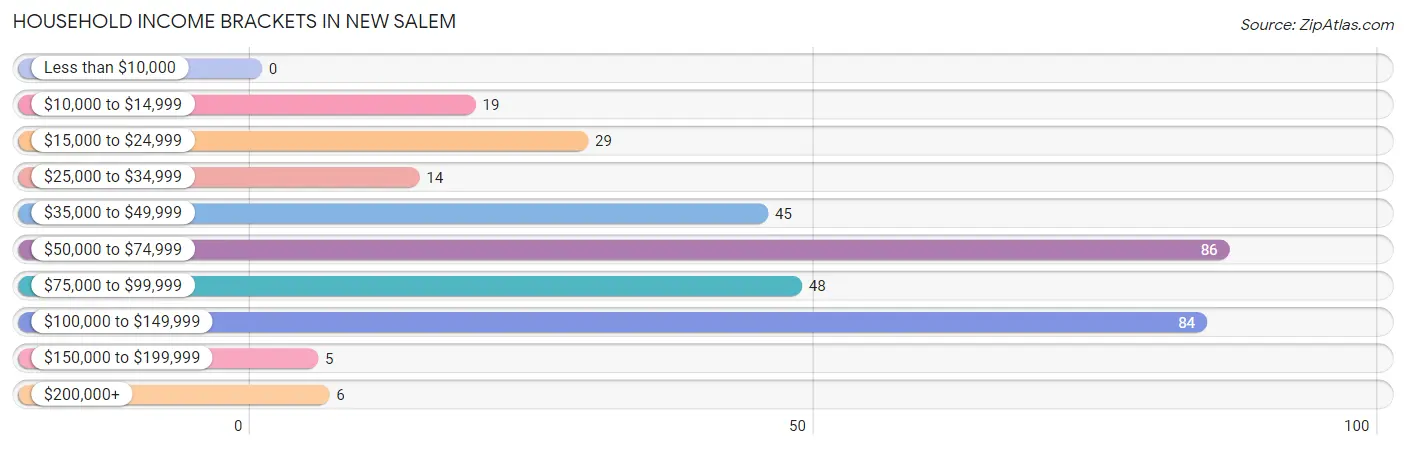
| Income Bracket | # Households | % Households |
| Less than $10,000 | 0 | 0.0% |
| $10,000 to $14,999 | 19 | 5.7% |
| $15,000 to $24,999 | 29 | 8.6% |
| $25,000 to $34,999 | 14 | 4.2% |
| $35,000 to $49,999 | 45 | 13.4% |
| $50,000 to $74,999 | 86 | 25.6% |
| $75,000 to $99,999 | 48 | 14.3% |
| $100,000 to $149,999 | 84 | 25.0% |
| $150,000 to $199,999 | 5 | 1.5% |
| $200,000+ | 6 | 1.8% |
Household Income by Householder Age in New Salem
The median household income in New Salem is $70,469, with the highest median household income of $78,393 found in the 25 to 44 years age bracket for the primary householder. A total of 156 households (46.4%) fall into this category. Meanwhile, the 15 to 24 years age bracket for the primary householder has the lowest median household income of $0, with 7 households (2.1%) in this group.
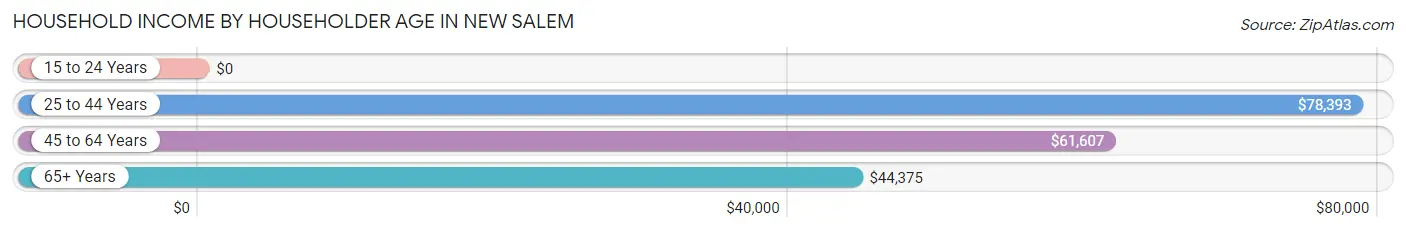
| Income Bracket | # Households | Median Income |
| 15 to 24 Years | 7 (2.1%) | $0 |
| 25 to 44 Years | 156 (46.4%) | $78,393 |
| 45 to 64 Years | 65 (19.4%) | $61,607 |
| 65+ Years | 108 (32.1%) | $44,375 |
| Total | 336 (100.0%) | $70,469 |
Poverty in New Salem
Income Below Poverty by Sex and Age in New Salem
With 5.2% poverty level for males and 8.0% for females among the residents of New Salem, 15 year old males and 65 to 74 year old females are the most vulnerable to poverty, with 1 males (33.3%) and 11 females (29.7%) in their respective age groups living below the poverty level.
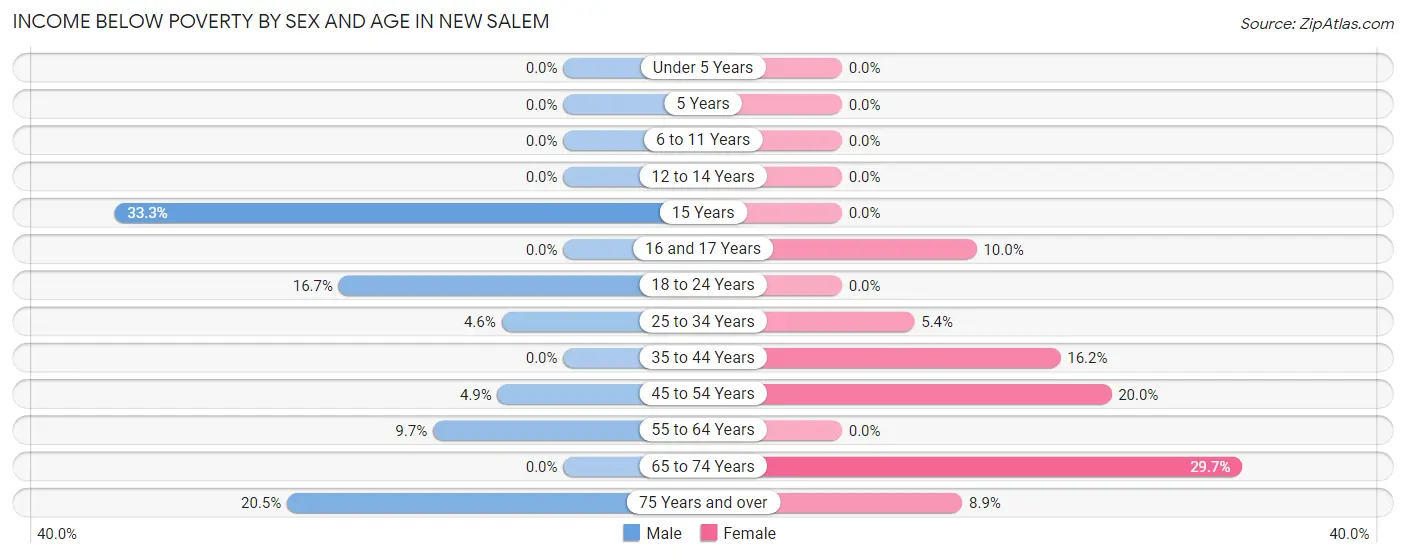
| Age Bracket | Male | Female |
| Under 5 Years | 0 (0.0%) | 0 (0.0%) |
| 5 Years | 0 (0.0%) | 0 (0.0%) |
| 6 to 11 Years | 0 (0.0%) | 0 (0.0%) |
| 12 to 14 Years | 0 (0.0%) | 0 (0.0%) |
| 15 Years | 1 (33.3%) | 0 (0.0%) |
| 16 and 17 Years | 0 (0.0%) | 2 (10.0%) |
| 18 to 24 Years | 1 (16.7%) | 0 (0.0%) |
| 25 to 34 Years | 5 (4.6%) | 7 (5.4%) |
| 35 to 44 Years | 0 (0.0%) | 6 (16.2%) |
| 45 to 54 Years | 2 (4.9%) | 4 (20.0%) |
| 55 to 64 Years | 3 (9.7%) | 0 (0.0%) |
| 65 to 74 Years | 0 (0.0%) | 11 (29.7%) |
| 75 Years and over | 8 (20.5%) | 5 (8.9%) |
| Total | 20 (5.2%) | 35 (8.0%) |
Income Above Poverty by Sex and Age in New Salem
According to the poverty statistics in New Salem, males aged under 5 years and females aged under 5 years are the age groups that are most secure financially, with 100.0% of males and 100.0% of females in these age groups living above the poverty line.
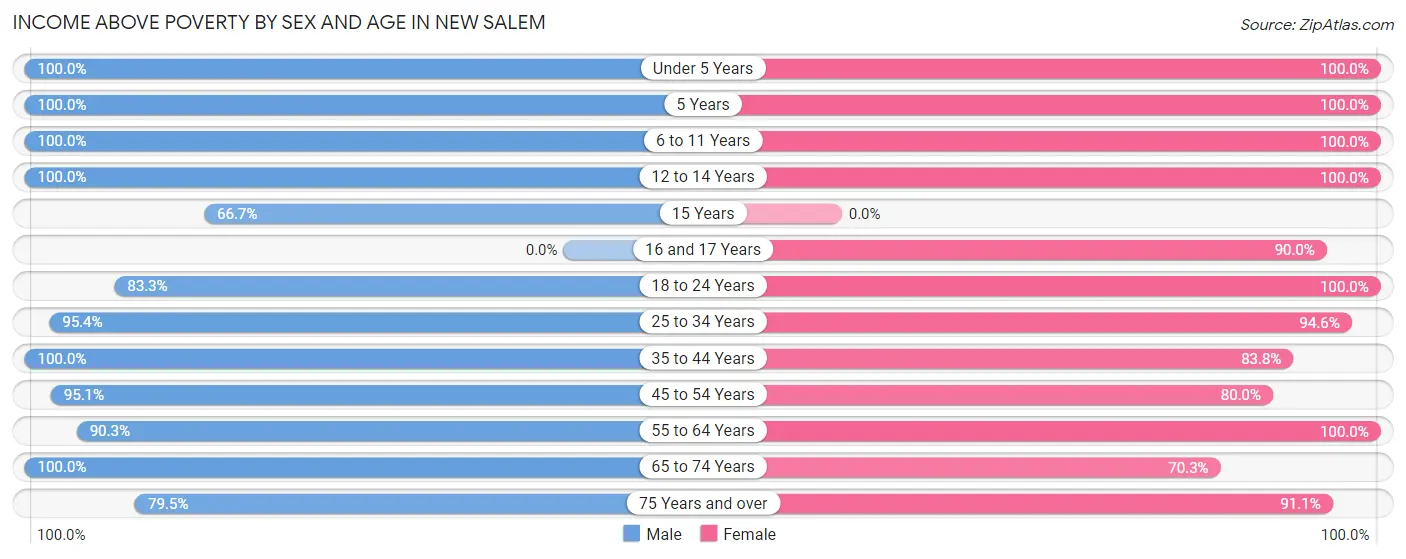
| Age Bracket | Male | Female |
| Under 5 Years | 49 (100.0%) | 9 (100.0%) |
| 5 Years | 16 (100.0%) | 8 (100.0%) |
| 6 to 11 Years | 19 (100.0%) | 48 (100.0%) |
| 12 to 14 Years | 2 (100.0%) | 9 (100.0%) |
| 15 Years | 2 (66.7%) | 0 (0.0%) |
| 16 and 17 Years | 0 (0.0%) | 18 (90.0%) |
| 18 to 24 Years | 5 (83.3%) | 23 (100.0%) |
| 25 to 34 Years | 104 (95.4%) | 123 (94.6%) |
| 35 to 44 Years | 45 (100.0%) | 31 (83.8%) |
| 45 to 54 Years | 39 (95.1%) | 16 (80.0%) |
| 55 to 64 Years | 28 (90.3%) | 39 (100.0%) |
| 65 to 74 Years | 24 (100.0%) | 26 (70.3%) |
| 75 Years and over | 31 (79.5%) | 51 (91.1%) |
| Total | 364 (94.8%) | 401 (92.0%) |
Income Below Poverty Among Married-Couple Families in New Salem
The poverty statistics for married-couple families in New Salem show that 6.1% or 9 of the total 148 families live below the poverty line. Families with no children have the highest poverty rate of 13.1%, comprising of 8 families. On the other hand, families with 3 or 4 children have the lowest poverty rate of 0.0%, which includes 0 families.
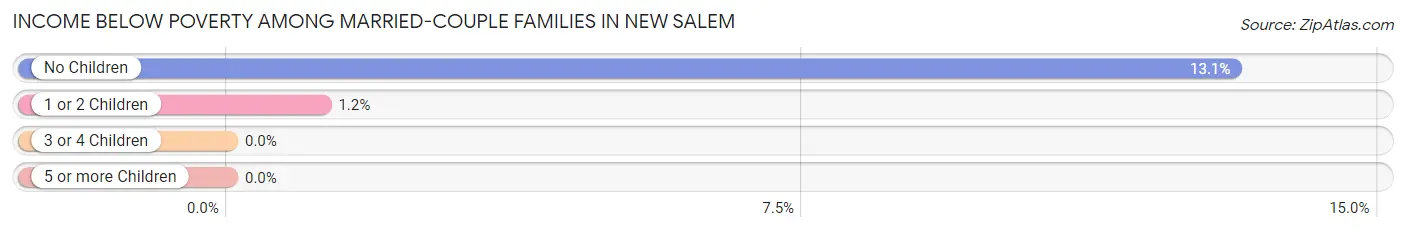
| Children | Above Poverty | Below Poverty |
| No Children | 53 (86.9%) | 8 (13.1%) |
| 1 or 2 Children | 81 (98.8%) | 1 (1.2%) |
| 3 or 4 Children | 5 (100.0%) | 0 (0.0%) |
| 5 or more Children | 0 (0.0%) | 0 (0.0%) |
| Total | 139 (93.9%) | 9 (6.1%) |
Income Below Poverty Among Single-Parent Households in New Salem
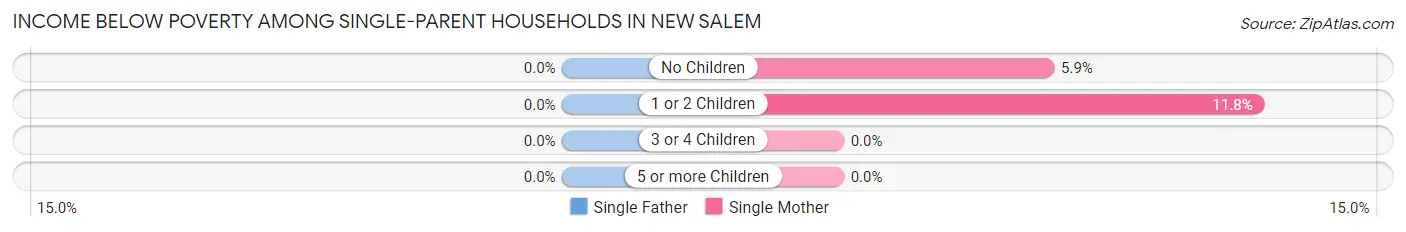
| Children | Single Father | Single Mother |
| No Children | 0 (0.0%) | 1 (5.9%) |
| 1 or 2 Children | 0 (0.0%) | 2 (11.8%) |
| 3 or 4 Children | 0 (0.0%) | 0 (0.0%) |
| 5 or more Children | 0 (0.0%) | 0 (0.0%) |
| Total | 0 (0.0%) | 3 (8.3%) |
Income Below Poverty Among Married-Couple vs Single-Parent Households in New Salem
The poverty data for New Salem shows that 9 of the married-couple family households (6.1%) and 3 of the single-parent households (5.1%) are living below the poverty level. Within the married-couple family households, those with no children have the highest poverty rate, with 8 households (13.1%) falling below the poverty line. Among the single-parent households, those with no children have the highest poverty rate, with 1 household (5.6%) living below poverty.
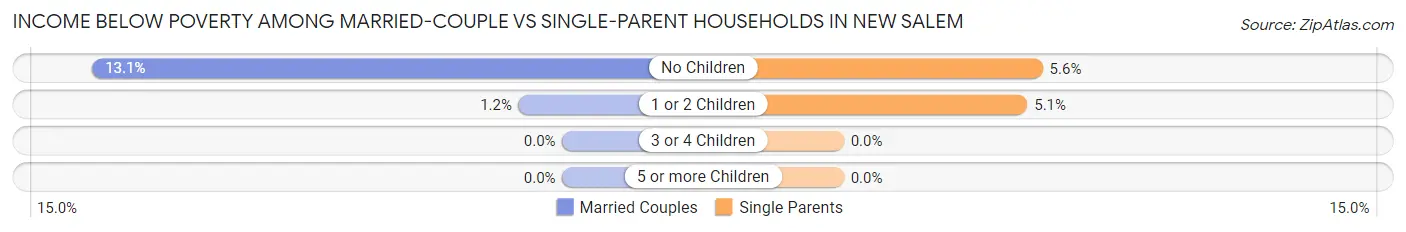
| Children | Married-Couple Families | Single-Parent Households |
| No Children | 8 (13.1%) | 1 (5.6%) |
| 1 or 2 Children | 1 (1.2%) | 2 (5.1%) |
| 3 or 4 Children | 0 (0.0%) | 0 (0.0%) |
| 5 or more Children | 0 (0.0%) | 0 (0.0%) |
| Total | 9 (6.1%) | 3 (5.1%) |
Race in New Salem
The most populous races in New Salem are White / Caucasian (935 | 99.6%), Hispanic or Latino (12 | 1.3%), and Native / Alaskan (2 | 0.2%).
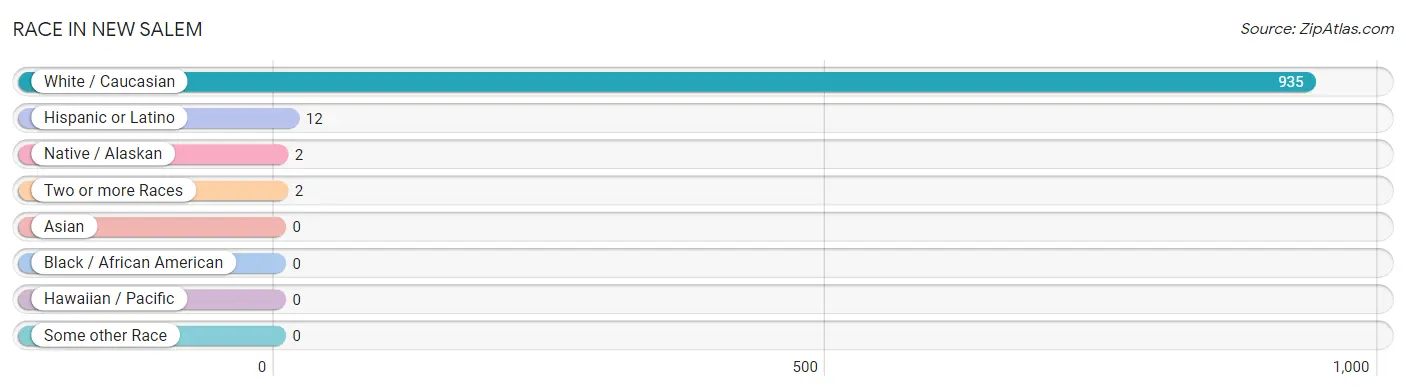
| Race | # Population | % Population |
| Asian | 0 | 0.0% |
| Black / African American | 0 | 0.0% |
| Hawaiian / Pacific | 0 | 0.0% |
| Hispanic or Latino | 12 | 1.3% |
| Native / Alaskan | 2 | 0.2% |
| White / Caucasian | 935 | 99.6% |
| Two or more Races | 2 | 0.2% |
| Some other Race | 0 | 0.0% |
| Total | 939 | 100.0% |
Ancestry in New Salem
The most populous ancestries reported in New Salem are German (660 | 70.3%), Norwegian (120 | 12.8%), English (84 | 8.9%), Russian (70 | 7.4%), and American (43 | 4.6%), together accounting for 104.0% of all New Salem residents.
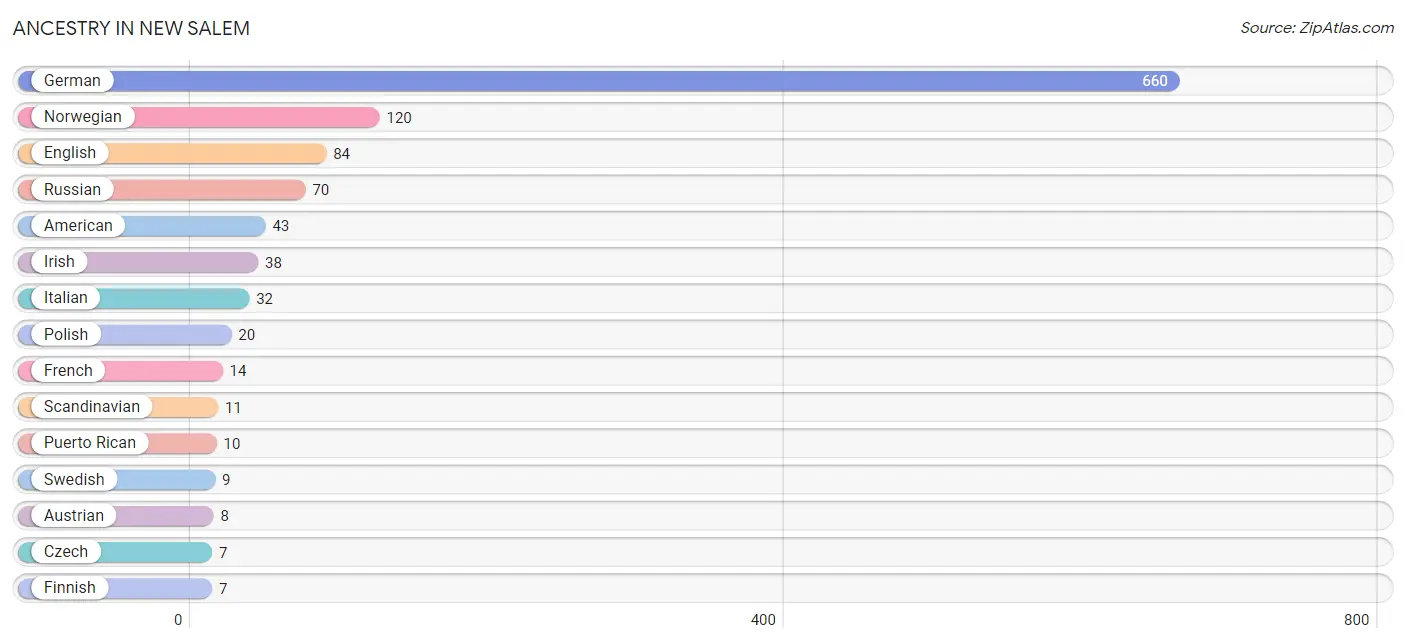
| Ancestry | # Population | % Population |
| American | 43 | 4.6% |
| Argentinean | 2 | 0.2% |
| Austrian | 8 | 0.9% |
| Croatian | 2 | 0.2% |
| Czech | 7 | 0.7% |
| Danish | 1 | 0.1% |
| Dutch | 5 | 0.5% |
| English | 84 | 8.9% |
| European | 3 | 0.3% |
| Finnish | 7 | 0.7% |
| French | 14 | 1.5% |
| French Canadian | 3 | 0.3% |
| German | 660 | 70.3% |
| German Russian | 5 | 0.5% |
| Greek | 1 | 0.1% |
| Irish | 38 | 4.1% |
| Italian | 32 | 3.4% |
| Norwegian | 120 | 12.8% |
| Polish | 20 | 2.1% |
| Puerto Rican | 10 | 1.1% |
| Russian | 70 | 7.4% |
| Scandinavian | 11 | 1.2% |
| Scotch-Irish | 6 | 0.6% |
| South American | 2 | 0.2% |
| Swedish | 9 | 1.0% | View All 25 Rows |
Immigrants in New Salem
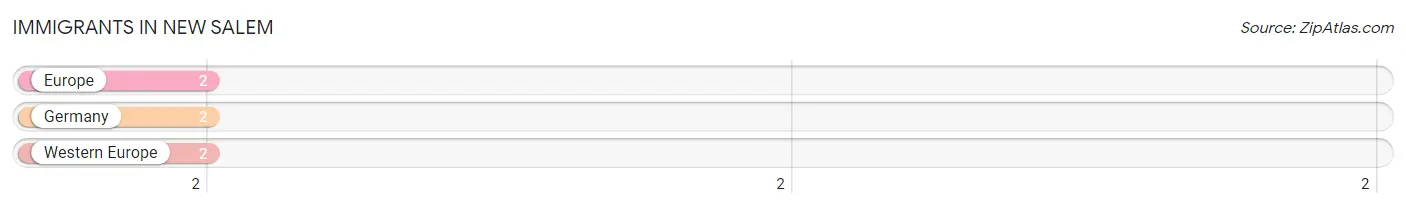
The most numerous immigrant groups reported in New Salem came from Europe (2 | 0.2%), Germany (2 | 0.2%), and Western Europe (2 | 0.2%), together accounting for 0.6% of all New Salem residents.
| Immigration Origin | # Population | % Population |
| Europe | 2 | 0.2% |
| Germany | 2 | 0.2% |
| Western Europe | 2 | 0.2% | View All 3 Rows |
Sex and Age in New Salem
Sex and Age in New Salem
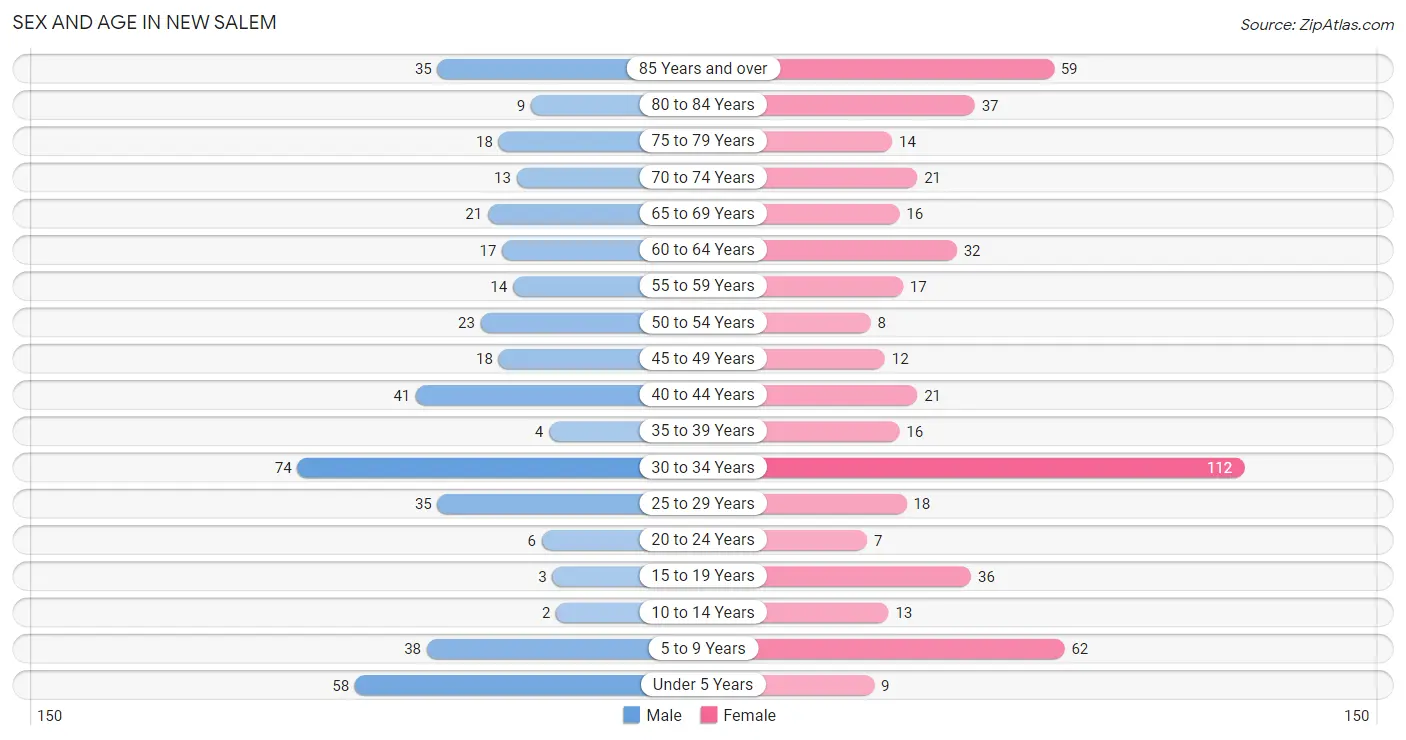
The most populous age groups in New Salem are 30 to 34 Years (74 | 17.2%) for men and 30 to 34 Years (112 | 22.0%) for women.
| Age Bracket | Male | Female |
| Under 5 Years | 58 (13.5%) | 9 (1.8%) |
| 5 to 9 Years | 38 (8.9%) | 62 (12.2%) |
| 10 to 14 Years | 2 (0.5%) | 13 (2.5%) |
| 15 to 19 Years | 3 (0.7%) | 36 (7.1%) |
| 20 to 24 Years | 6 (1.4%) | 7 (1.4%) |
| 25 to 29 Years | 35 (8.2%) | 18 (3.5%) |
| 30 to 34 Years | 74 (17.2%) | 112 (22.0%) |
| 35 to 39 Years | 4 (0.9%) | 16 (3.1%) |
| 40 to 44 Years | 41 (9.6%) | 21 (4.1%) |
| 45 to 49 Years | 18 (4.2%) | 12 (2.4%) |
| 50 to 54 Years | 23 (5.4%) | 8 (1.6%) |
| 55 to 59 Years | 14 (3.3%) | 17 (3.3%) |
| 60 to 64 Years | 17 (4.0%) | 32 (6.3%) |
| 65 to 69 Years | 21 (4.9%) | 16 (3.1%) |
| 70 to 74 Years | 13 (3.0%) | 21 (4.1%) |
| 75 to 79 Years | 18 (4.2%) | 14 (2.8%) |
| 80 to 84 Years | 9 (2.1%) | 37 (7.2%) |
| 85 Years and over | 35 (8.2%) | 59 (11.6%) |
| Total | 429 (100.0%) | 510 (100.0%) |
Families and Households in New Salem
Median Family Size in New Salem
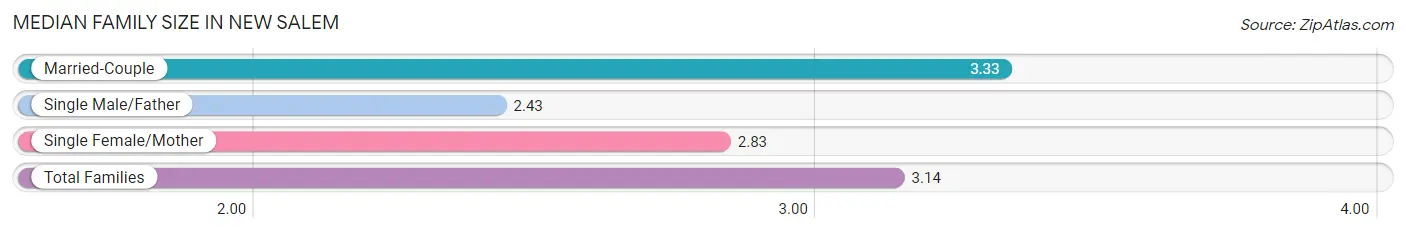
The median family size in New Salem is 3.14 persons per family, with married-couple families (148 | 71.5%) accounting for the largest median family size of 3.33 persons per family. On the other hand, single male/father families (23 | 11.1%) represent the smallest median family size with 2.43 persons per family.
| Family Type | # Families | Family Size |
| Married-Couple | 148 (71.5%) | 3.33 |
| Single Male/Father | 23 (11.1%) | 2.43 |
| Single Female/Mother | 36 (17.4%) | 2.83 |
| Total Families | 207 (100.0%) | 3.14 |
Median Household Size in New Salem
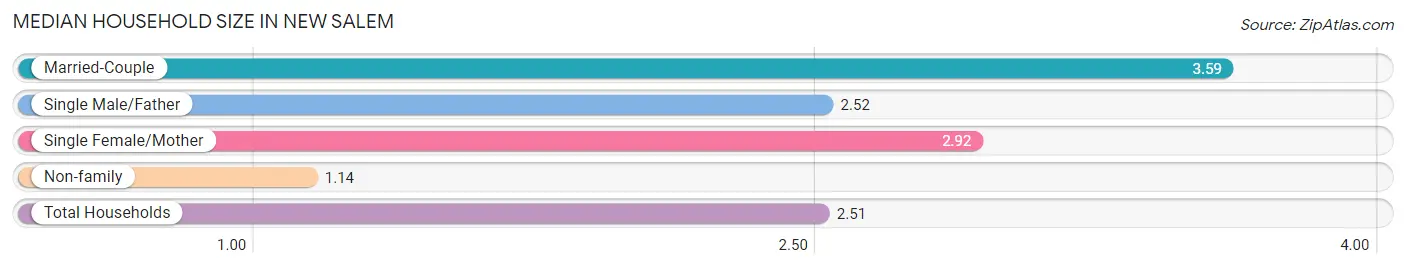
The median household size in New Salem is 2.51 persons per household, with married-couple households (148 | 44.1%) accounting for the largest median household size of 3.59 persons per household. non-family households (129 | 38.4%) represent the smallest median household size with 1.14 persons per household.
| Household Type | # Households | Household Size |
| Married-Couple | 148 (44.1%) | 3.59 |
| Single Male/Father | 23 (6.9%) | 2.52 |
| Single Female/Mother | 36 (10.7%) | 2.92 |
| Non-family | 129 (38.4%) | 1.14 |
| Total Households | 336 (100.0%) | 2.51 |
Household Size by Marriage Status in New Salem
Out of a total of 336 households in New Salem, 207 (61.6%) are family households, while 129 (38.4%) are nonfamily households. The most numerous type of family households are 3-person households, comprising 69, and the most common type of nonfamily households are 1-person households, comprising 119.
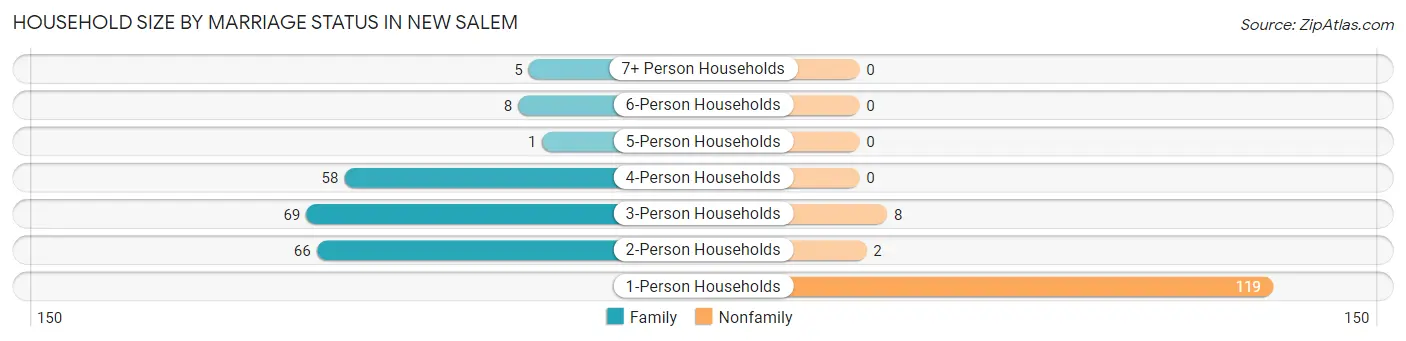
| Household Size | Family Households | Nonfamily Households |
| 1-Person Households | - | 119 (35.4%) |
| 2-Person Households | 66 (19.6%) | 2 (0.6%) |
| 3-Person Households | 69 (20.5%) | 8 (2.4%) |
| 4-Person Households | 58 (17.3%) | 0 (0.0%) |
| 5-Person Households | 1 (0.3%) | 0 (0.0%) |
| 6-Person Households | 8 (2.4%) | 0 (0.0%) |
| 7+ Person Households | 5 (1.5%) | 0 (0.0%) |
| Total | 207 (61.6%) | 129 (38.4%) |
Female Fertility in New Salem
Fertility by Age in New Salem
Average fertility rate in New Salem is 75.0 births per 1,000 women. Women in the age bracket of 20 to 34 years have the highest fertility rate with 109.0 births per 1,000 women. Women in the age bracket of 20 to 34 years acount for 88.2% of all women with births.
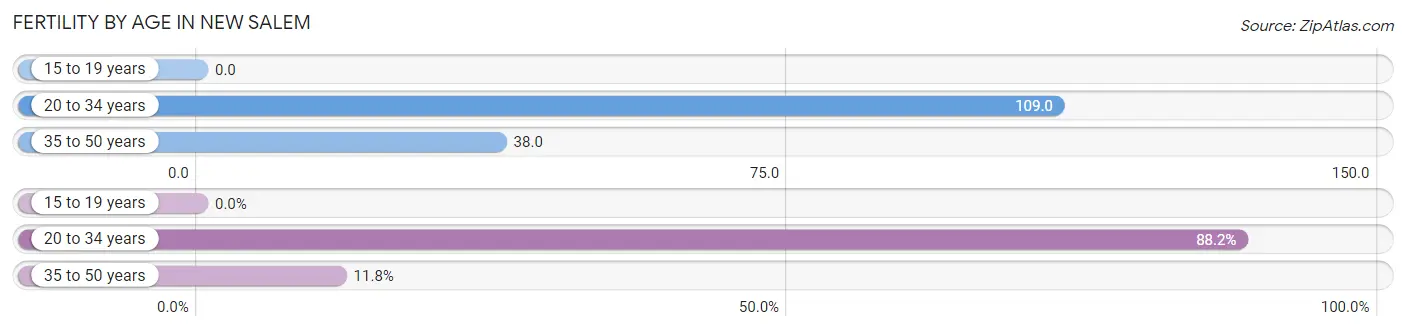
| Age Bracket | Women with Births | Births / 1,000 Women |
| 15 to 19 years | 0 (0.0%) | 0.0 |
| 20 to 34 years | 15 (88.2%) | 109.0 |
| 35 to 50 years | 2 (11.8%) | 38.0 |
| Total | 17 (100.0%) | 75.0 |
Fertility by Age by Marriage Status in New Salem
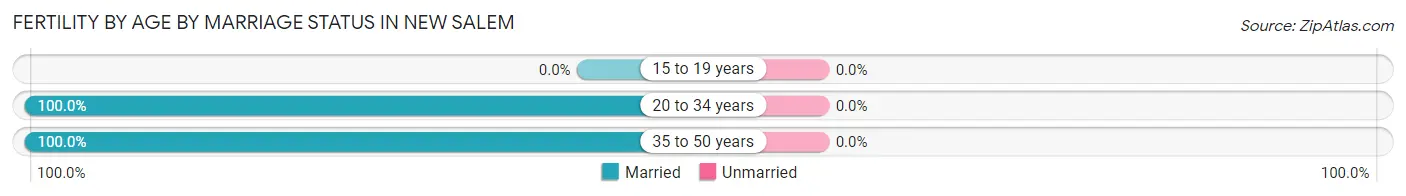
| Age Bracket | Married | Unmarried |
| 15 to 19 years | 0 (0.0%) | 0 (0.0%) |
| 20 to 34 years | 15 (100.0%) | 0 (0.0%) |
| 35 to 50 years | 2 (100.0%) | 0 (0.0%) |
| Total | 17 (100.0%) | 0 (0.0%) |
Fertility by Education in New Salem
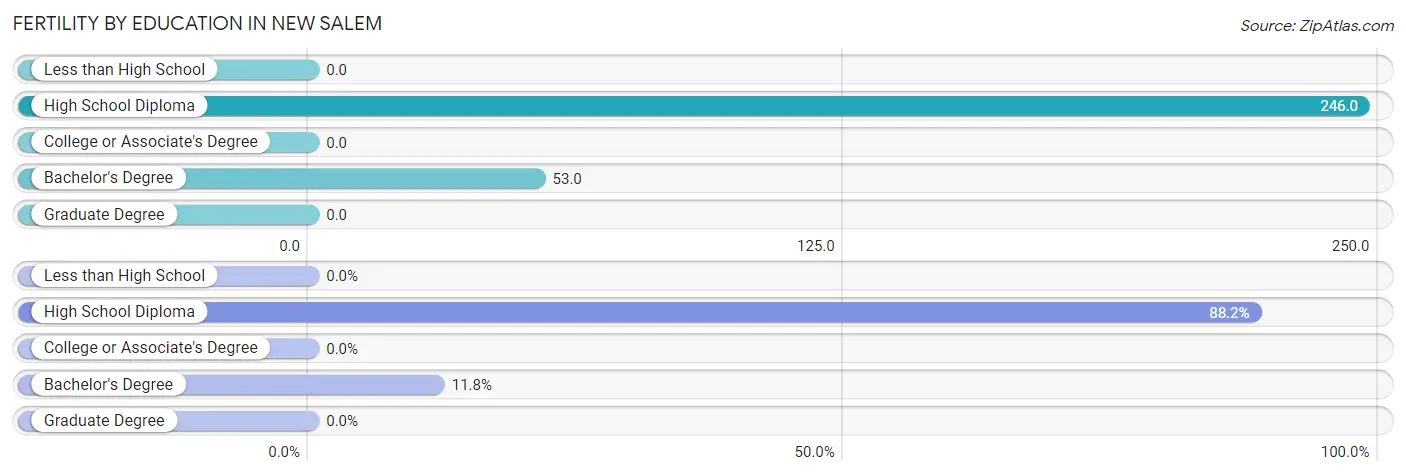
| Educational Attainment | Women with Births | Births / 1,000 Women |
| Less than High School | 0 (0.0%) | 0.0 |
| High School Diploma | 15 (88.2%) | 246.0 |
| College or Associate's Degree | 0 (0.0%) | 0.0 |
| Bachelor's Degree | 2 (11.8%) | 53.0 |
| Graduate Degree | 0 (0.0%) | 0.0 |
| Total | 17 (100.0%) | 75.0 |
Fertility by Education by Marriage Status in New Salem
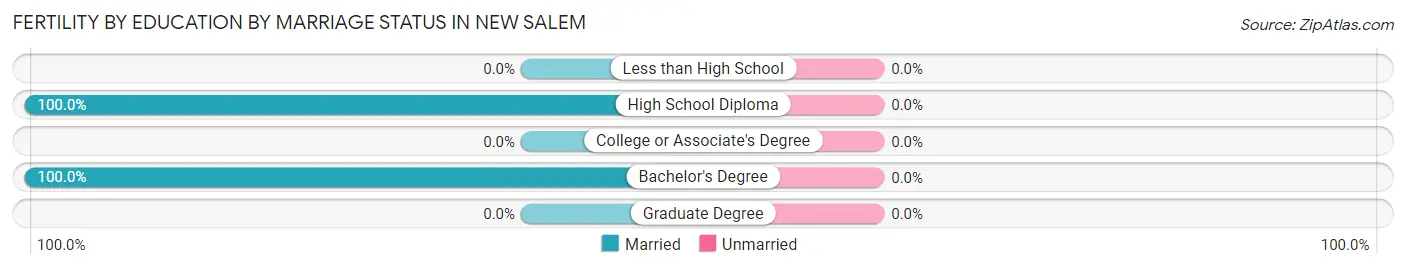
| Educational Attainment | Married | Unmarried |
| Less than High School | 0 (0.0%) | 0 (0.0%) |
| High School Diploma | 15 (100.0%) | 0 (0.0%) |
| College or Associate's Degree | 0 (0.0%) | 0 (0.0%) |
| Bachelor's Degree | 2 (100.0%) | 0 (0.0%) |
| Graduate Degree | 0 (0.0%) | 0 (0.0%) |
| Total | 17 (100.0%) | 0 (0.0%) |
Employment Characteristics in New Salem
Employment by Class of Employer in New Salem
Among the 451 employed individuals in New Salem, private company employees (291 | 64.5%), self-employed (not incorporated) (39 | 8.6%), and not-for-profit organizations (39 | 8.6%) make up the most common classes of employment.
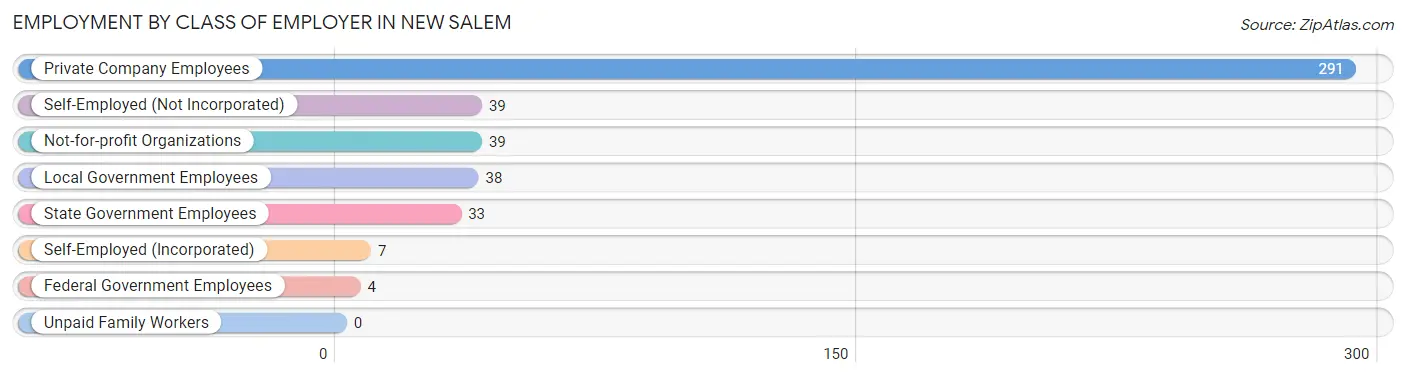
| Employer Class | # Employees | % Employees |
| Private Company Employees | 291 | 64.5% |
| Self-Employed (Incorporated) | 7 | 1.5% |
| Self-Employed (Not Incorporated) | 39 | 8.6% |
| Not-for-profit Organizations | 39 | 8.6% |
| Local Government Employees | 38 | 8.4% |
| State Government Employees | 33 | 7.3% |
| Federal Government Employees | 4 | 0.9% |
| Unpaid Family Workers | 0 | 0.0% |
| Total | 451 | 100.0% |
Employment Status by Age in New Salem
According to the labor force statistics for New Salem, out of the total population over 16 years of age (754), 62.3% or 470 individuals are in the labor force, with 3.2% or 15 of them unemployed. The age group with the highest labor force participation rate is 20 to 24 years, with 100.0% or 13 individuals in the labor force. Within the labor force, the 16 to 19 years age range has the highest percentage of unemployed individuals, with 40.0% or 6 of them being unemployed.
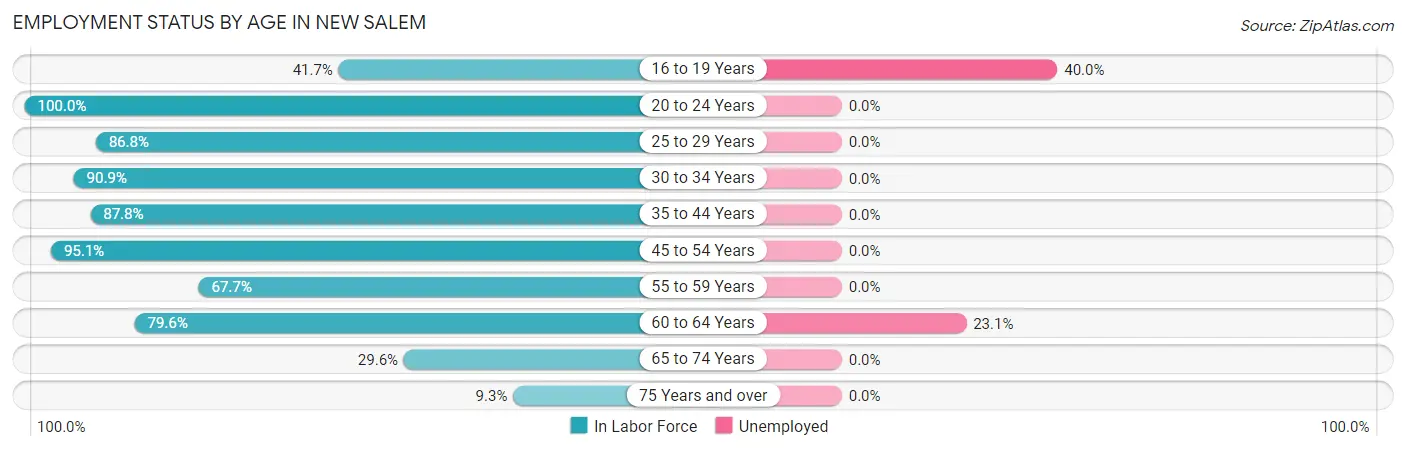
| Age Bracket | In Labor Force | Unemployed |
| 16 to 19 Years | 15 (41.7%) | 6 (40.0%) |
| 20 to 24 Years | 13 (100.0%) | 0 (0.0%) |
| 25 to 29 Years | 46 (86.8%) | 0 (0.0%) |
| 30 to 34 Years | 169 (90.9%) | 0 (0.0%) |
| 35 to 44 Years | 72 (87.8%) | 0 (0.0%) |
| 45 to 54 Years | 58 (95.1%) | 0 (0.0%) |
| 55 to 59 Years | 21 (67.7%) | 0 (0.0%) |
| 60 to 64 Years | 39 (79.6%) | 9 (23.1%) |
| 65 to 74 Years | 21 (29.6%) | 0 (0.0%) |
| 75 Years and over | 16 (9.3%) | 0 (0.0%) |
| Total | 470 (62.3%) | 15 (3.2%) |
Employment Status by Educational Attainment in New Salem
According to labor force statistics for New Salem, 87.7% of individuals (405) out of the total population between 25 and 64 years of age (462) are in the labor force, with 2.2% or 9 of them being unemployed. The group with the highest labor force participation rate are those with the educational attainment of less than high school, with 100.0% or 17 individuals in the labor force. Within the labor force, individuals with high school diploma education have the highest percentage of unemployment, with 6.9% or 9 of them being unemployed.
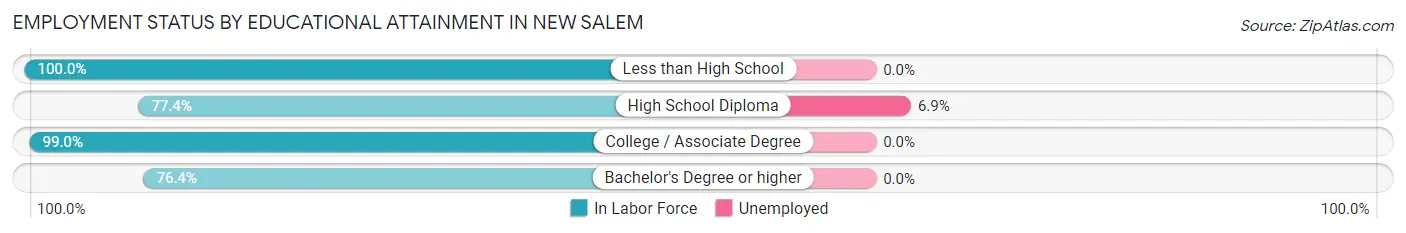
| Educational Attainment | In Labor Force | Unemployed |
| Less than High School | 17 (100.0%) | 0 (0.0%) |
| High School Diploma | 130 (77.4%) | 12 (6.9%) |
| College / Associate Degree | 203 (99.0%) | 0 (0.0%) |
| Bachelor's Degree or higher | 55 (76.4%) | 0 (0.0%) |
| Total | 405 (87.7%) | 10 (2.2%) |
Employment Occupations by Sex in New Salem
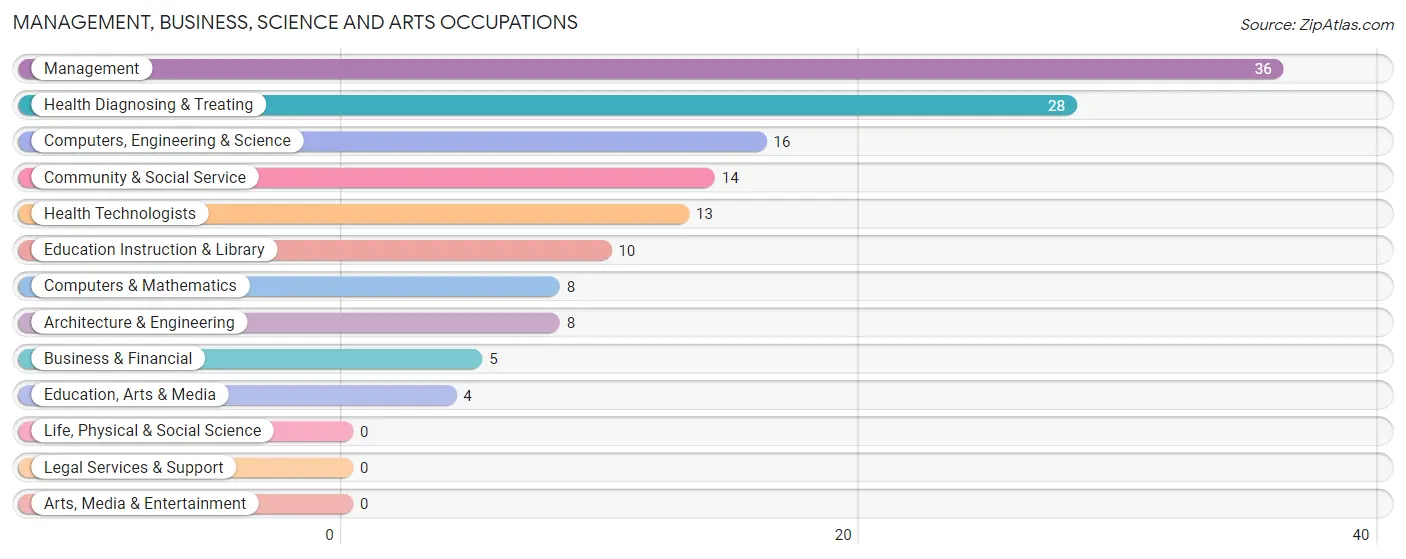
Management, Business, Science and Arts Occupations
The most common Management, Business, Science and Arts occupations in New Salem are Management (36 | 7.9%), Health Diagnosing & Treating (28 | 6.1%), Computers, Engineering & Science (16 | 3.5%), Community & Social Service (14 | 3.1%), and Health Technologists (13 | 2.9%).
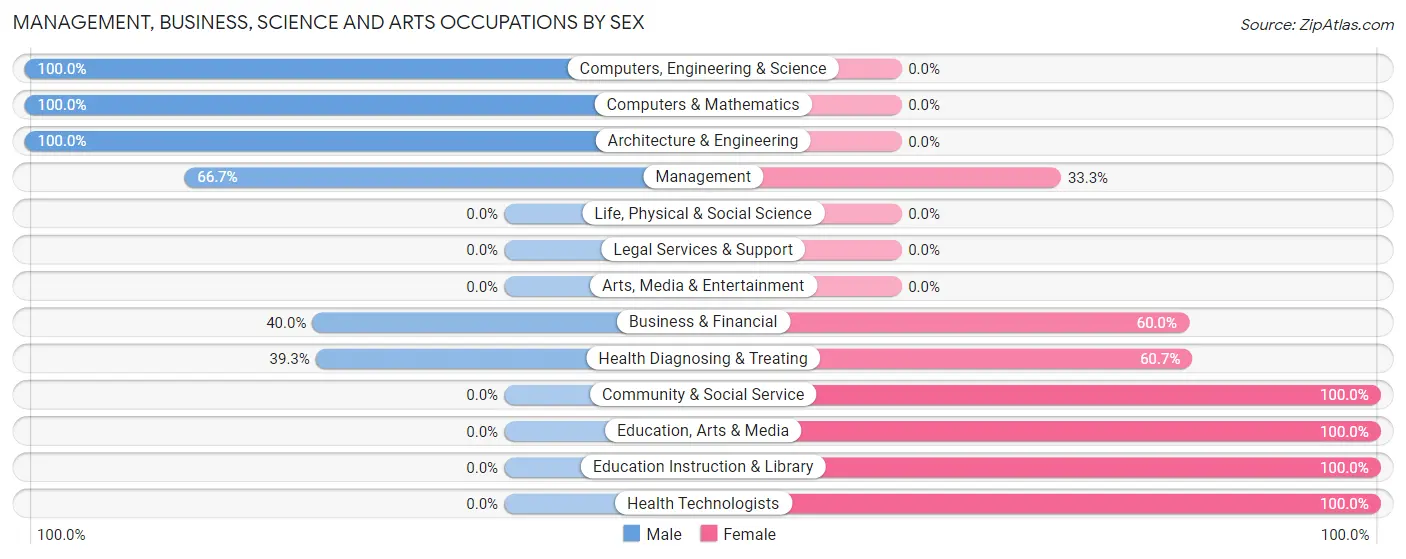
Management, Business, Science and Arts Occupations by Sex
Within the Management, Business, Science and Arts occupations in New Salem, the most male-oriented occupations are Computers, Engineering & Science (100.0%), Computers & Mathematics (100.0%), and Architecture & Engineering (100.0%), while the most female-oriented occupations are Community & Social Service (100.0%), Education, Arts & Media (100.0%), and Education Instruction & Library (100.0%).
| Occupation | Male | Female |
| Management | 24 (66.7%) | 12 (33.3%) |
| Business & Financial | 2 (40.0%) | 3 (60.0%) |
| Computers, Engineering & Science | 16 (100.0%) | 0 (0.0%) |
| Computers & Mathematics | 8 (100.0%) | 0 (0.0%) |
| Architecture & Engineering | 8 (100.0%) | 0 (0.0%) |
| Life, Physical & Social Science | 0 (0.0%) | 0 (0.0%) |
| Community & Social Service | 0 (0.0%) | 14 (100.0%) |
| Education, Arts & Media | 0 (0.0%) | 4 (100.0%) |
| Legal Services & Support | 0 (0.0%) | 0 (0.0%) |
| Education Instruction & Library | 0 (0.0%) | 10 (100.0%) |
| Arts, Media & Entertainment | 0 (0.0%) | 0 (0.0%) |
| Health Diagnosing & Treating | 11 (39.3%) | 17 (60.7%) |
| Health Technologists | 0 (0.0%) | 13 (100.0%) |
| Total (Category) | 53 (53.5%) | 46 (46.5%) |
| Total (Overall) | 223 (49.0%) | 232 (51.0%) |
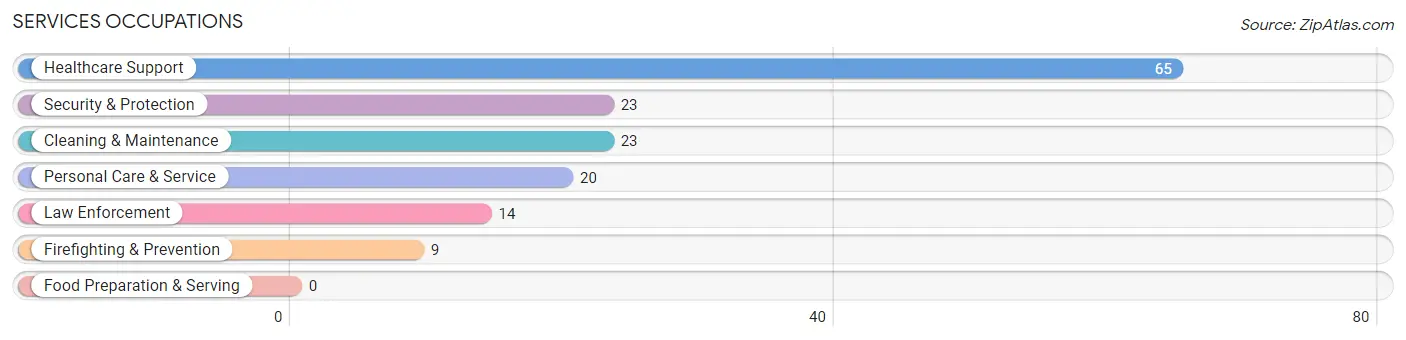
Services Occupations
The most common Services occupations in New Salem are Healthcare Support (65 | 14.3%), Security & Protection (23 | 5.1%), Cleaning & Maintenance (23 | 5.1%), Personal Care & Service (20 | 4.4%), and Law Enforcement (14 | 3.1%).
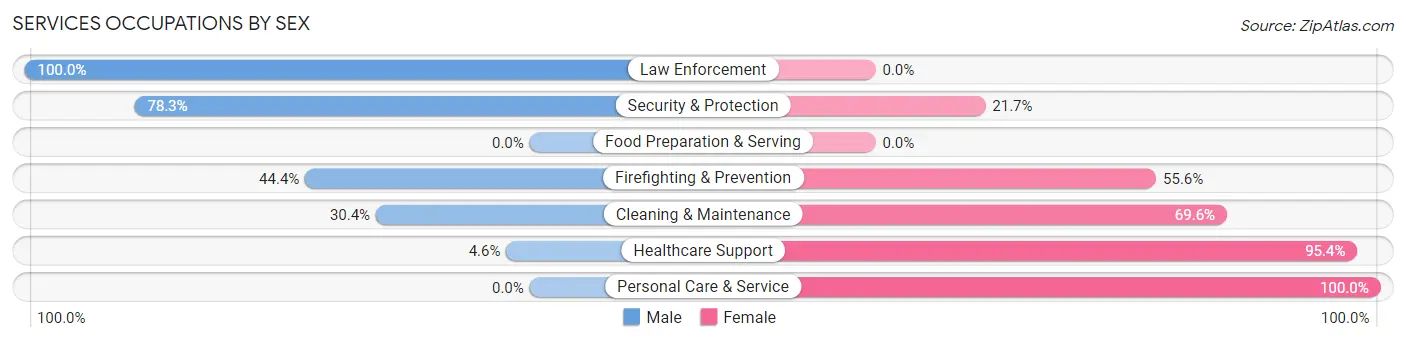
Services Occupations by Sex
Within the Services occupations in New Salem, the most male-oriented occupations are Law Enforcement (100.0%), Security & Protection (78.3%), and Firefighting & Prevention (44.4%), while the most female-oriented occupations are Personal Care & Service (100.0%), Healthcare Support (95.4%), and Cleaning & Maintenance (69.6%).
| Occupation | Male | Female |
| Healthcare Support | 3 (4.6%) | 62 (95.4%) |
| Security & Protection | 18 (78.3%) | 5 (21.7%) |
| Firefighting & Prevention | 4 (44.4%) | 5 (55.6%) |
| Law Enforcement | 14 (100.0%) | 0 (0.0%) |
| Food Preparation & Serving | 0 (0.0%) | 0 (0.0%) |
| Cleaning & Maintenance | 7 (30.4%) | 16 (69.6%) |
| Personal Care & Service | 0 (0.0%) | 20 (100.0%) |
| Total (Category) | 28 (21.4%) | 103 (78.6%) |
| Total (Overall) | 223 (49.0%) | 232 (51.0%) |
Sales and Office Occupations
The most common Sales and Office occupations in New Salem are Office & Administration (67 | 14.7%), and Sales & Related (30 | 6.6%).
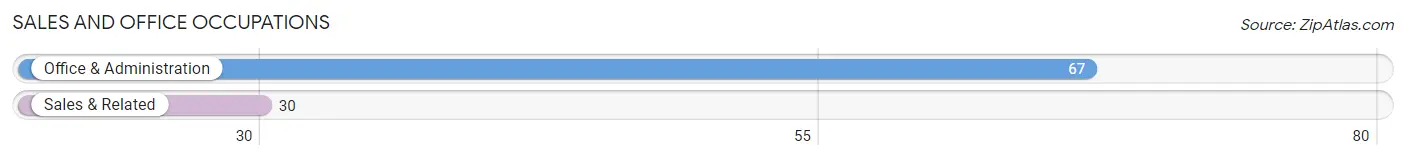
Sales and Office Occupations by Sex
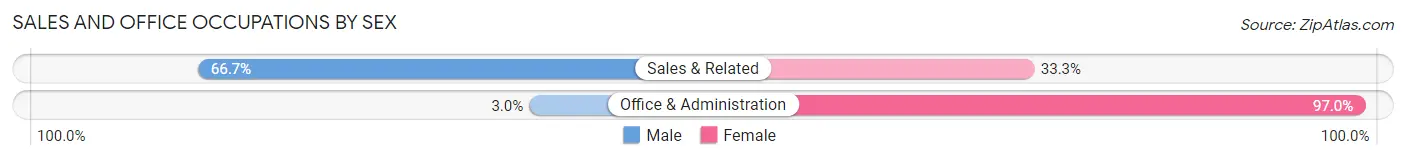
| Occupation | Male | Female |
| Sales & Related | 20 (66.7%) | 10 (33.3%) |
| Office & Administration | 2 (3.0%) | 65 (97.0%) |
| Total (Category) | 22 (22.7%) | 75 (77.3%) |
| Total (Overall) | 223 (49.0%) | 232 (51.0%) |
Natural Resources, Construction and Maintenance Occupations
The most common Natural Resources, Construction and Maintenance occupations in New Salem are Installation, Maintenance & Repair (29 | 6.4%), Construction & Extraction (25 | 5.5%), and Farming, Fishing & Forestry (14 | 3.1%).
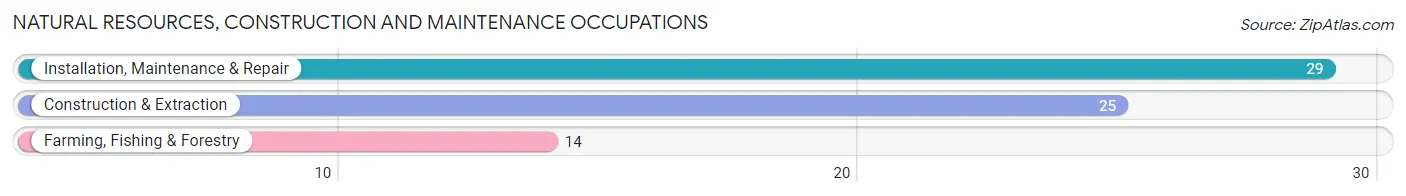
Natural Resources, Construction and Maintenance Occupations by Sex
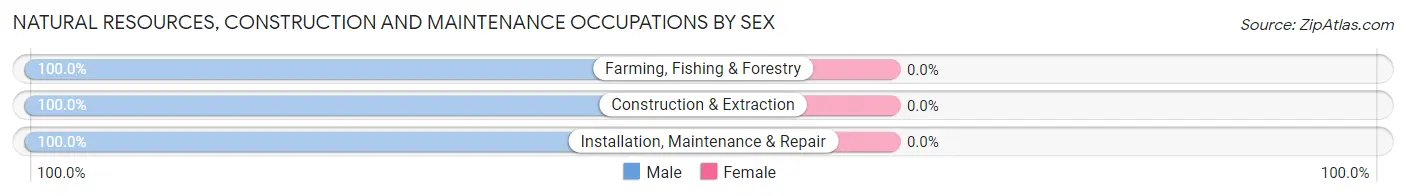
| Occupation | Male | Female |
| Farming, Fishing & Forestry | 14 (100.0%) | 0 (0.0%) |
| Construction & Extraction | 25 (100.0%) | 0 (0.0%) |
| Installation, Maintenance & Repair | 29 (100.0%) | 0 (0.0%) |
| Total (Category) | 68 (100.0%) | 0 (0.0%) |
| Total (Overall) | 223 (49.0%) | 232 (51.0%) |
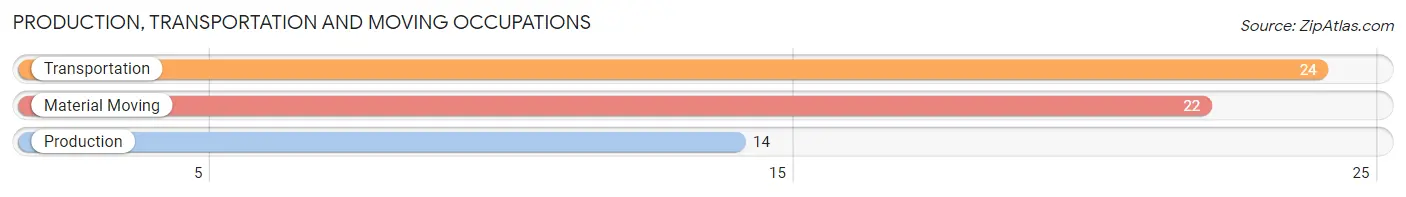
Production, Transportation and Moving Occupations
The most common Production, Transportation and Moving occupations in New Salem are Transportation (24 | 5.3%), Material Moving (22 | 4.8%), and Production (14 | 3.1%).
Production, Transportation and Moving Occupations by Sex
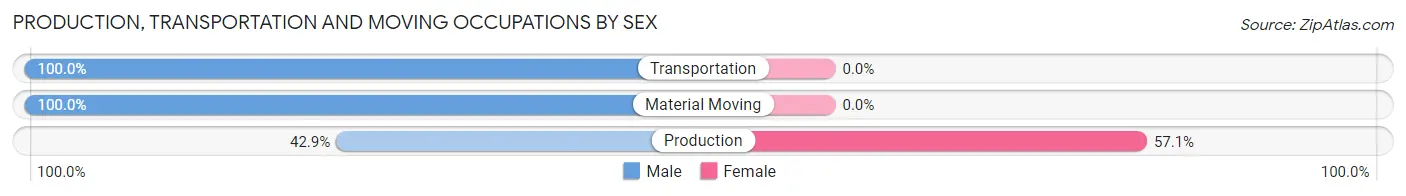
| Occupation | Male | Female |
| Production | 6 (42.9%) | 8 (57.1%) |
| Transportation | 24 (100.0%) | 0 (0.0%) |
| Material Moving | 22 (100.0%) | 0 (0.0%) |
| Total (Category) | 52 (86.7%) | 8 (13.3%) |
| Total (Overall) | 223 (49.0%) | 232 (51.0%) |
Employment Industries by Sex in New Salem
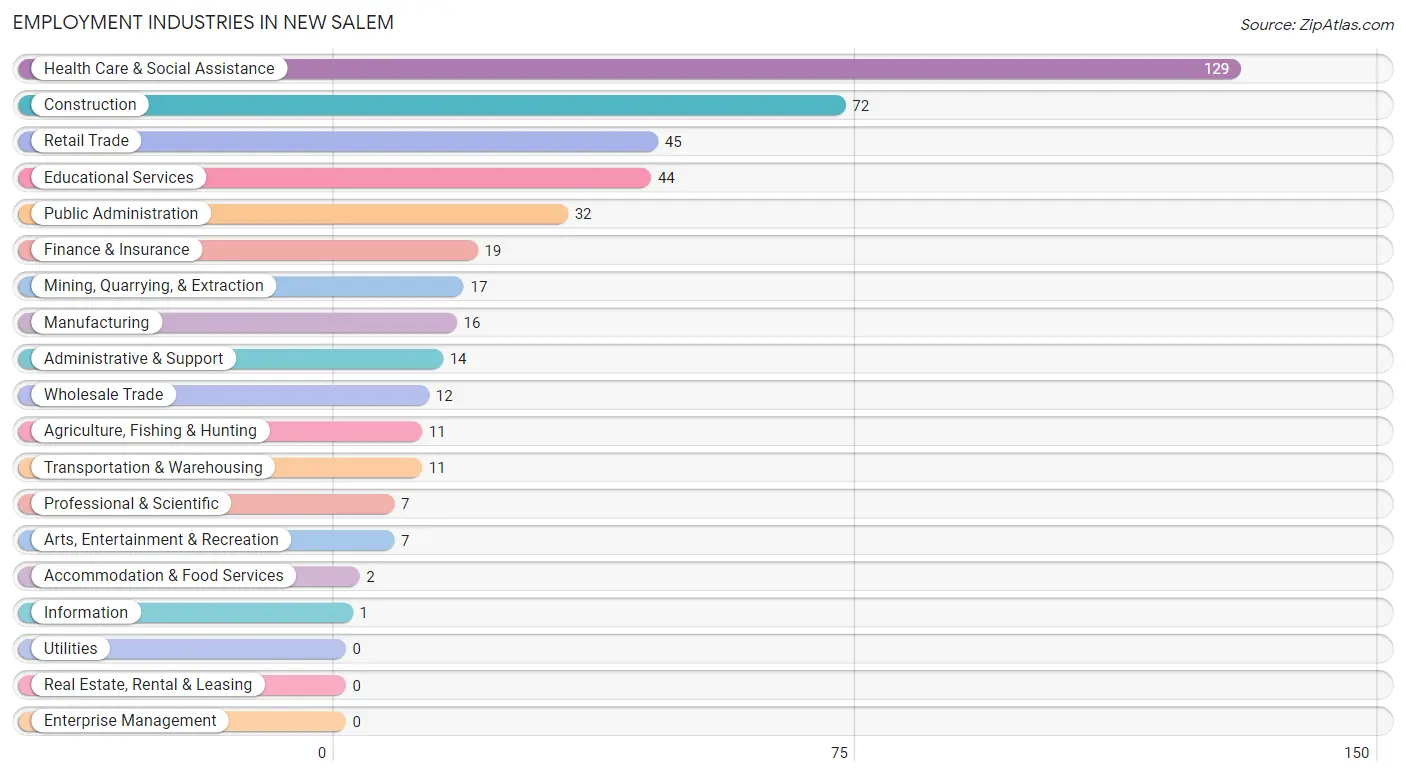
Employment Industries in New Salem
The major employment industries in New Salem include Health Care & Social Assistance (129 | 28.3%), Construction (72 | 15.8%), Retail Trade (45 | 9.9%), Educational Services (44 | 9.7%), and Public Administration (32 | 7.0%).
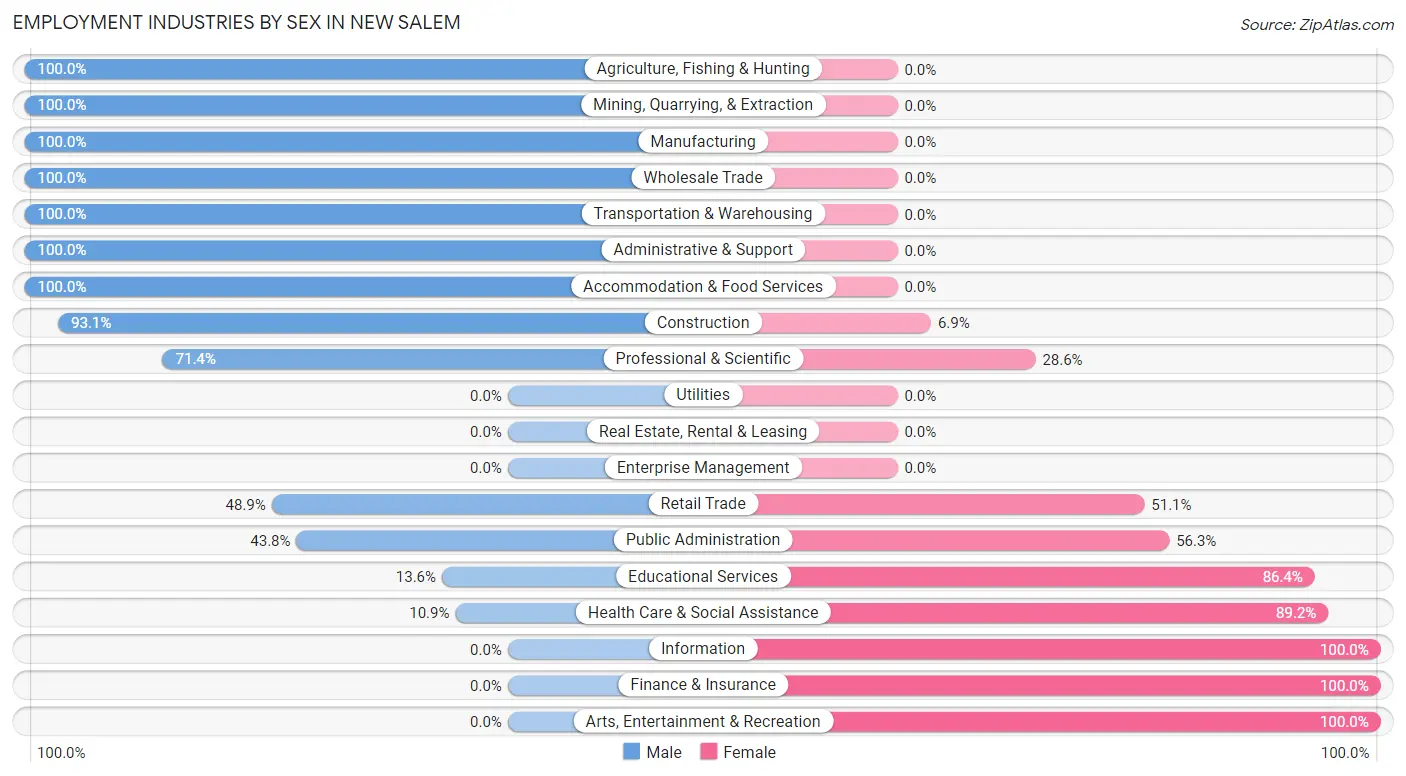
Employment Industries by Sex in New Salem
The New Salem industries that see more men than women are Agriculture, Fishing & Hunting (100.0%), Mining, Quarrying, & Extraction (100.0%), and Manufacturing (100.0%), whereas the industries that tend to have a higher number of women are Information (100.0%), Finance & Insurance (100.0%), and Arts, Entertainment & Recreation (100.0%).
| Industry | Male | Female |
| Agriculture, Fishing & Hunting | 11 (100.0%) | 0 (0.0%) |
| Mining, Quarrying, & Extraction | 17 (100.0%) | 0 (0.0%) |
| Construction | 67 (93.1%) | 5 (6.9%) |
| Manufacturing | 16 (100.0%) | 0 (0.0%) |
| Wholesale Trade | 12 (100.0%) | 0 (0.0%) |
| Retail Trade | 22 (48.9%) | 23 (51.1%) |
| Transportation & Warehousing | 11 (100.0%) | 0 (0.0%) |
| Utilities | 0 (0.0%) | 0 (0.0%) |
| Information | 0 (0.0%) | 1 (100.0%) |
| Finance & Insurance | 0 (0.0%) | 19 (100.0%) |
| Real Estate, Rental & Leasing | 0 (0.0%) | 0 (0.0%) |
| Professional & Scientific | 5 (71.4%) | 2 (28.6%) |
| Enterprise Management | 0 (0.0%) | 0 (0.0%) |
| Administrative & Support | 14 (100.0%) | 0 (0.0%) |
| Educational Services | 6 (13.6%) | 38 (86.4%) |
| Health Care & Social Assistance | 14 (10.8%) | 115 (89.1%) |
| Arts, Entertainment & Recreation | 0 (0.0%) | 7 (100.0%) |
| Accommodation & Food Services | 2 (100.0%) | 0 (0.0%) |
| Public Administration | 14 (43.8%) | 18 (56.2%) |
| Total | 223 (49.0%) | 232 (51.0%) |
Education in New Salem
School Enrollment in New Salem
The most common levels of schooling among the 157 students in New Salem are elementary school (65 | 41.4%), kindergarten (27 | 17.2%), and high school (23 | 14.6%).
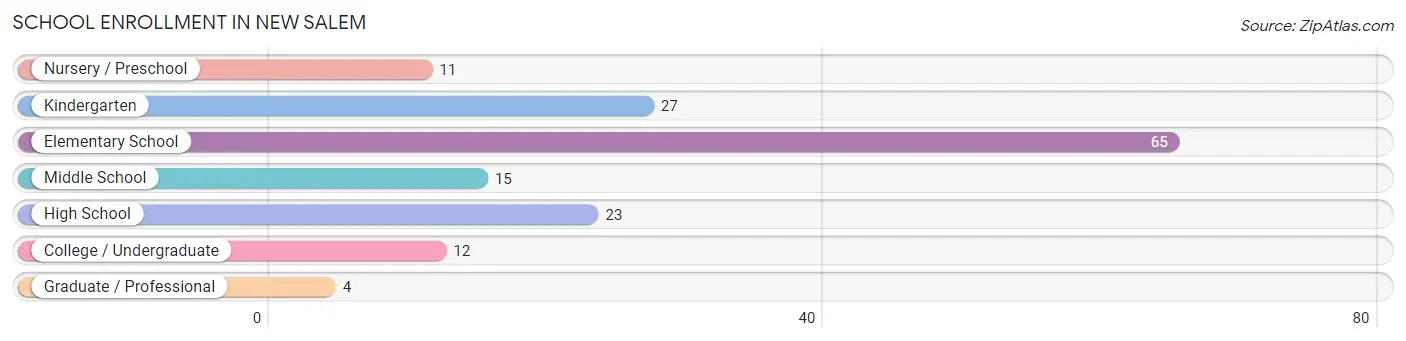
| School Level | # Students | % Students |
| Nursery / Preschool | 11 | 7.0% |
| Kindergarten | 27 | 17.2% |
| Elementary School | 65 | 41.4% |
| Middle School | 15 | 9.6% |
| High School | 23 | 14.6% |
| College / Undergraduate | 12 | 7.6% |
| Graduate / Professional | 4 | 2.5% |
| Total | 157 | 100.0% |
School Enrollment by Age by Funding Source in New Salem
Out of a total of 157 students who are enrolled in schools in New Salem, 36 (22.9%) attend a private institution, while the remaining 121 (77.1%) are enrolled in public schools. The age group of 18 to 19 year olds has the highest likelihood of being enrolled in private schools, with 10 (100.0% in the age bracket) enrolled. Conversely, the age group of 3 to 4 year olds has the lowest likelihood of being enrolled in a private school, with 11 (100.0% in the age bracket) attending a public institution.
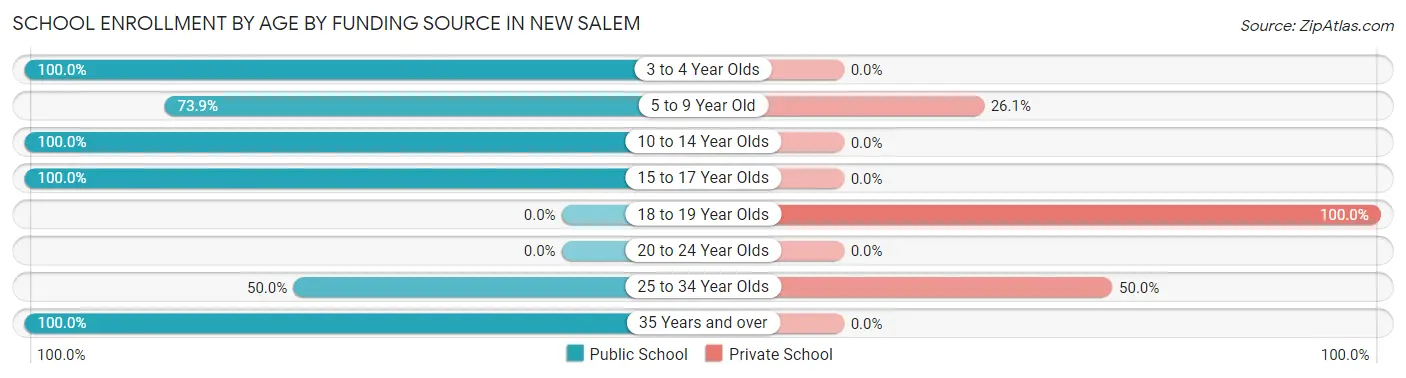
| Age Bracket | Public School | Private School |
| 3 to 4 Year Olds | 11 (100.0%) | 0 (0.0%) |
| 5 to 9 Year Old | 68 (73.9%) | 24 (26.1%) |
| 10 to 14 Year Olds | 15 (100.0%) | 0 (0.0%) |
| 15 to 17 Year Olds | 23 (100.0%) | 0 (0.0%) |
| 18 to 19 Year Olds | 0 (0.0%) | 10 (100.0%) |
| 20 to 24 Year Olds | 0 (0.0%) | 0 (0.0%) |
| 25 to 34 Year Olds | 2 (50.0%) | 2 (50.0%) |
| 35 Years and over | 2 (100.0%) | 0 (0.0%) |
| Total | 121 (77.1%) | 36 (22.9%) |
Educational Attainment by Field of Study in New Salem
Science & technology (40 | 32.8%), education (33 | 27.1%), arts & humanities (19 | 15.6%), business (12 | 9.8%), and psychology (6 | 4.9%) are the most common fields of study among 122 individuals in New Salem who have obtained a bachelor's degree or higher.
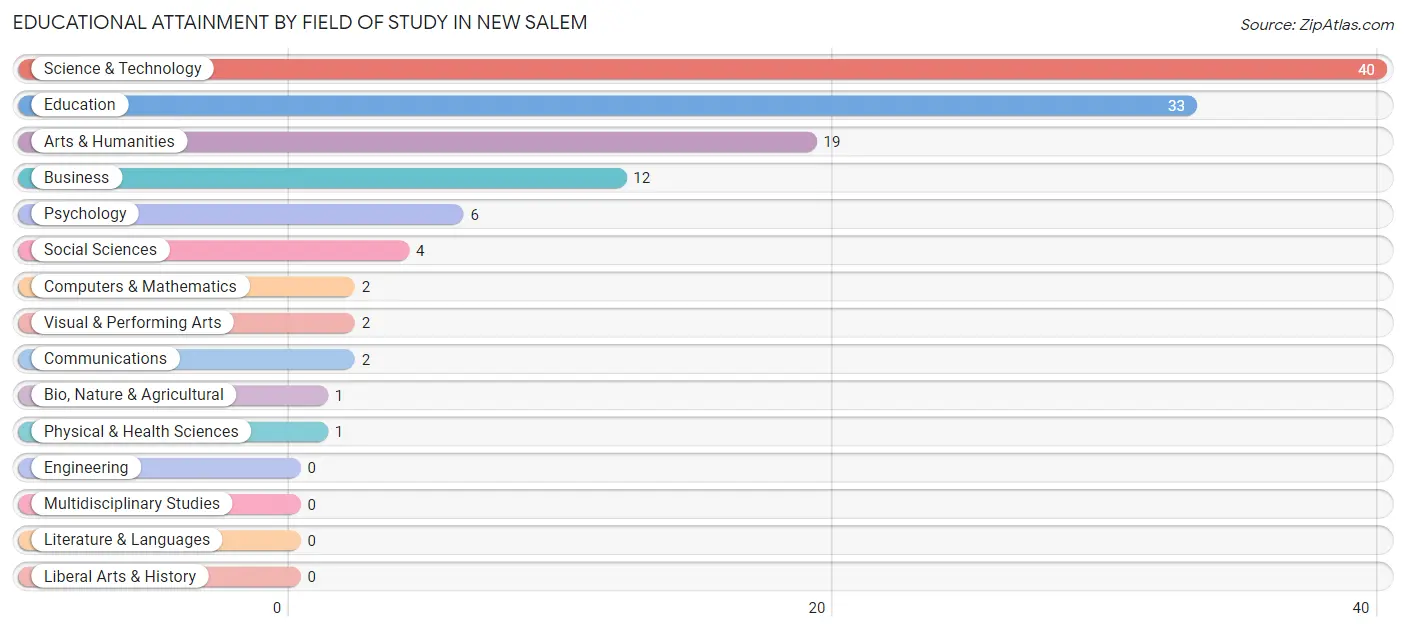
| Field of Study | # Graduates | % Graduates |
| Computers & Mathematics | 2 | 1.6% |
| Bio, Nature & Agricultural | 1 | 0.8% |
| Physical & Health Sciences | 1 | 0.8% |
| Psychology | 6 | 4.9% |
| Social Sciences | 4 | 3.3% |
| Engineering | 0 | 0.0% |
| Multidisciplinary Studies | 0 | 0.0% |
| Science & Technology | 40 | 32.8% |
| Business | 12 | 9.8% |
| Education | 33 | 27.1% |
| Literature & Languages | 0 | 0.0% |
| Liberal Arts & History | 0 | 0.0% |
| Visual & Performing Arts | 2 | 1.6% |
| Communications | 2 | 1.6% |
| Arts & Humanities | 19 | 15.6% |
| Total | 122 | 100.0% |
Transportation & Commute in New Salem
Vehicle Availability by Sex in New Salem
The most prevalent vehicle ownership categories in New Salem are males with 3 vehicles (78, accounting for 35.6%) and females with 3 vehicles (103, making up 33.6%).
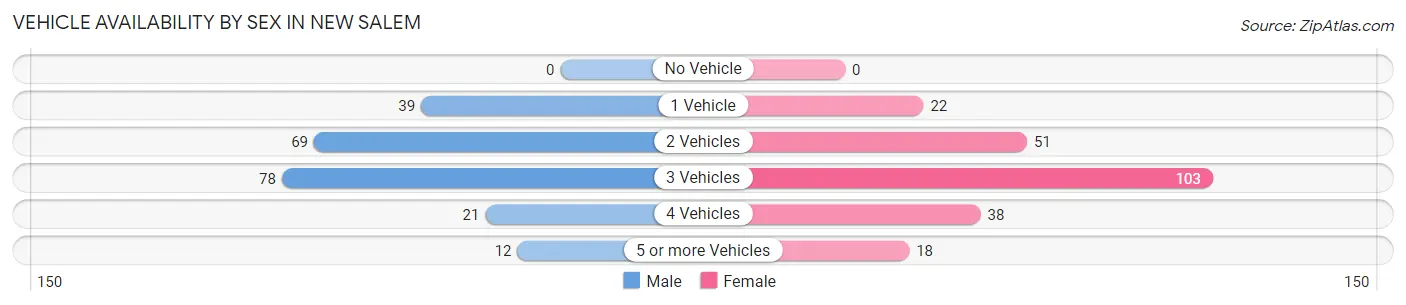
| Vehicles Available | Male | Female |
| No Vehicle | 0 (0.0%) | 0 (0.0%) |
| 1 Vehicle | 39 (17.8%) | 22 (9.5%) |
| 2 Vehicles | 69 (31.5%) | 51 (22.0%) |
| 3 Vehicles | 78 (35.6%) | 103 (44.4%) |
| 4 Vehicles | 21 (9.6%) | 38 (16.4%) |
| 5 or more Vehicles | 12 (5.5%) | 18 (7.8%) |
| Total | 219 (100.0%) | 232 (100.0%) |
Commute Time in New Salem
The most frequently occuring commute durations in New Salem are 5 to 9 minutes (81 commuters, 19.4%), less than 5 minutes (80 commuters, 19.2%), and 30 to 34 minutes (63 commuters, 15.1%).
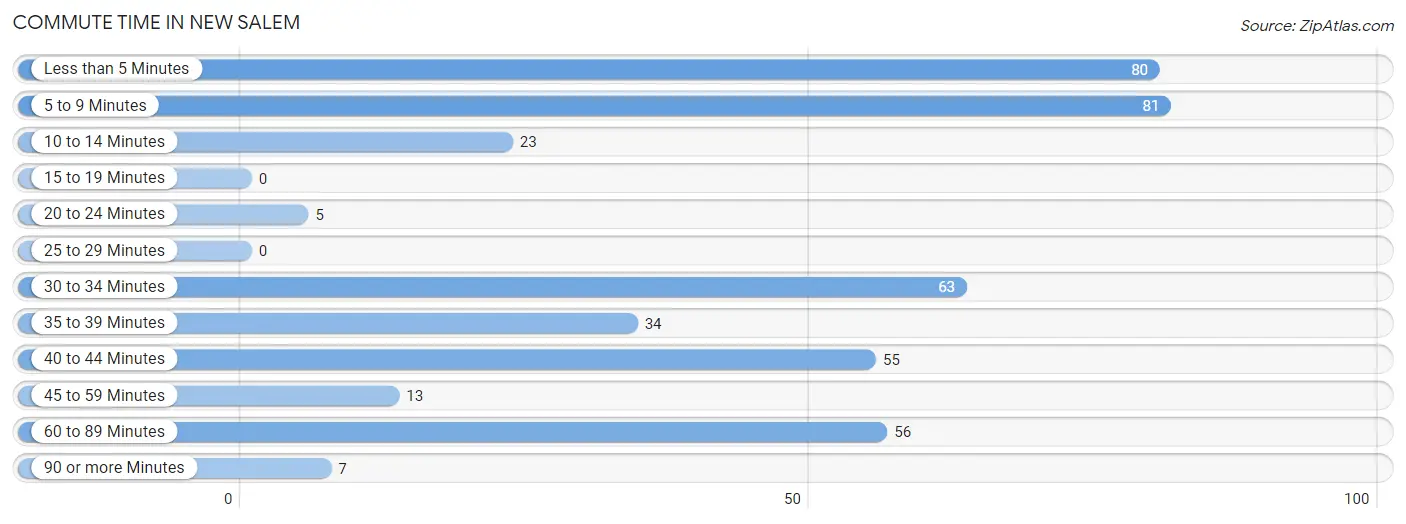
| Commute Time | # Commuters | % Commuters |
| Less than 5 Minutes | 80 | 19.2% |
| 5 to 9 Minutes | 81 | 19.4% |
| 10 to 14 Minutes | 23 | 5.5% |
| 15 to 19 Minutes | 0 | 0.0% |
| 20 to 24 Minutes | 5 | 1.2% |
| 25 to 29 Minutes | 0 | 0.0% |
| 30 to 34 Minutes | 63 | 15.1% |
| 35 to 39 Minutes | 34 | 8.2% |
| 40 to 44 Minutes | 55 | 13.2% |
| 45 to 59 Minutes | 13 | 3.1% |
| 60 to 89 Minutes | 56 | 13.4% |
| 90 or more Minutes | 7 | 1.7% |
Commute Time by Sex in New Salem
The most common commute times in New Salem are 60 to 89 minutes (54 commuters, 25.4%) for males and less than 5 minutes (73 commuters, 35.8%) for females.
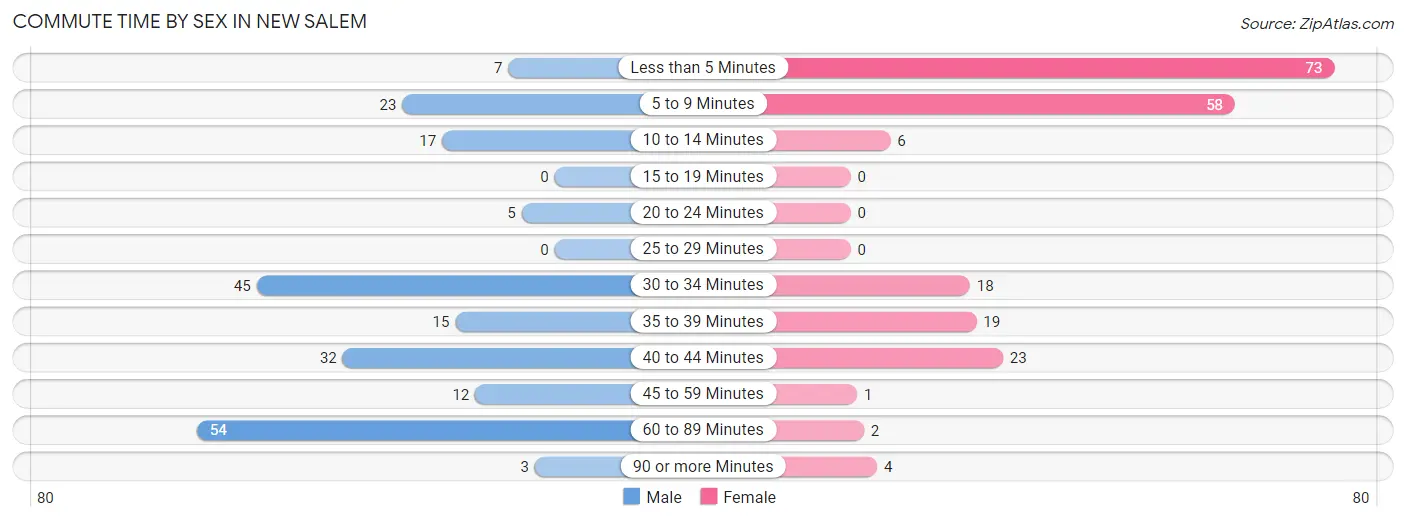
| Commute Time | Male | Female |
| Less than 5 Minutes | 7 (3.3%) | 73 (35.8%) |
| 5 to 9 Minutes | 23 (10.8%) | 58 (28.4%) |
| 10 to 14 Minutes | 17 (8.0%) | 6 (2.9%) |
| 15 to 19 Minutes | 0 (0.0%) | 0 (0.0%) |
| 20 to 24 Minutes | 5 (2.4%) | 0 (0.0%) |
| 25 to 29 Minutes | 0 (0.0%) | 0 (0.0%) |
| 30 to 34 Minutes | 45 (21.1%) | 18 (8.8%) |
| 35 to 39 Minutes | 15 (7.0%) | 19 (9.3%) |
| 40 to 44 Minutes | 32 (15.0%) | 23 (11.3%) |
| 45 to 59 Minutes | 12 (5.6%) | 1 (0.5%) |
| 60 to 89 Minutes | 54 (25.4%) | 2 (1.0%) |
| 90 or more Minutes | 3 (1.4%) | 4 (2.0%) |
Time of Departure to Work by Sex in New Salem
The most frequent times of departure to work in New Salem are 8:00 AM to 8:29 AM (55, 25.8%) for males and 4:00 PM to 11:59 PM (57, 27.9%) for females.
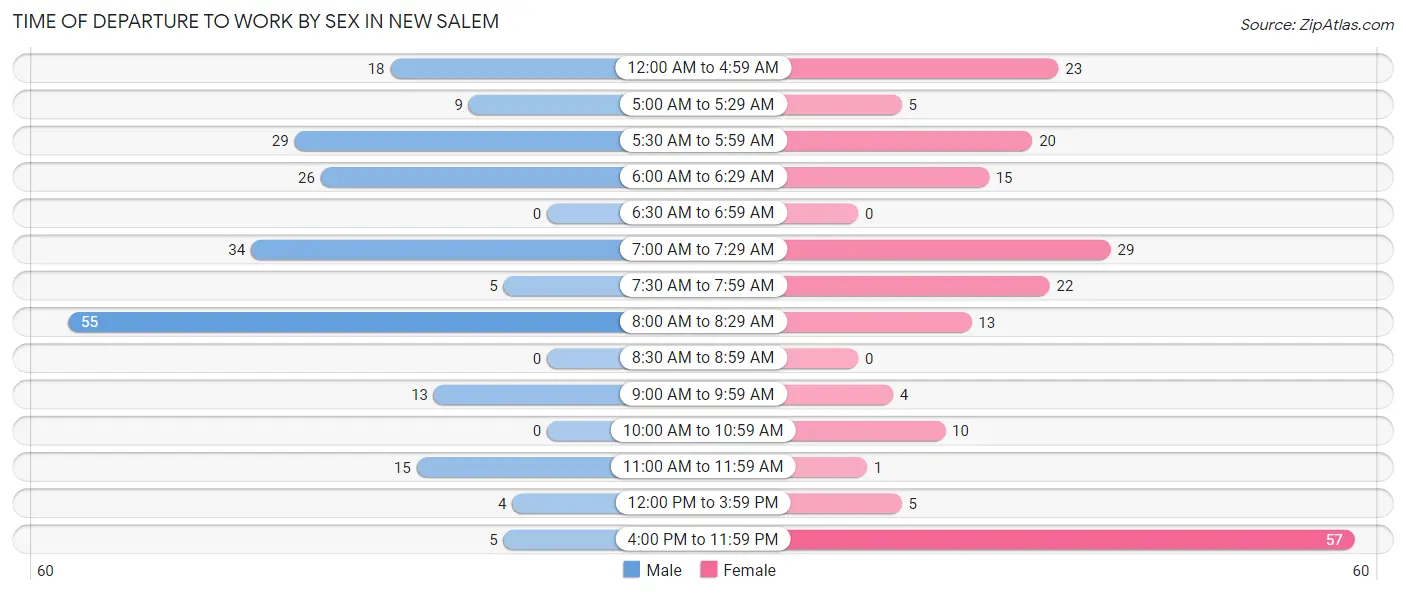
| Time of Departure | Male | Female |
| 12:00 AM to 4:59 AM | 18 (8.5%) | 23 (11.3%) |
| 5:00 AM to 5:29 AM | 9 (4.2%) | 5 (2.5%) |
| 5:30 AM to 5:59 AM | 29 (13.6%) | 20 (9.8%) |
| 6:00 AM to 6:29 AM | 26 (12.2%) | 15 (7.3%) |
| 6:30 AM to 6:59 AM | 0 (0.0%) | 0 (0.0%) |
| 7:00 AM to 7:29 AM | 34 (16.0%) | 29 (14.2%) |
| 7:30 AM to 7:59 AM | 5 (2.4%) | 22 (10.8%) |
| 8:00 AM to 8:29 AM | 55 (25.8%) | 13 (6.4%) |
| 8:30 AM to 8:59 AM | 0 (0.0%) | 0 (0.0%) |
| 9:00 AM to 9:59 AM | 13 (6.1%) | 4 (2.0%) |
| 10:00 AM to 10:59 AM | 0 (0.0%) | 10 (4.9%) |
| 11:00 AM to 11:59 AM | 15 (7.0%) | 1 (0.5%) |
| 12:00 PM to 3:59 PM | 4 (1.9%) | 5 (2.5%) |
| 4:00 PM to 11:59 PM | 5 (2.4%) | 57 (27.9%) |
| Total | 213 (100.0%) | 204 (100.0%) |
Housing Occupancy in New Salem
Occupancy by Ownership in New Salem
Of the total 336 dwellings in New Salem, owner-occupied units account for 250 (74.4%), while renter-occupied units make up 86 (25.6%).
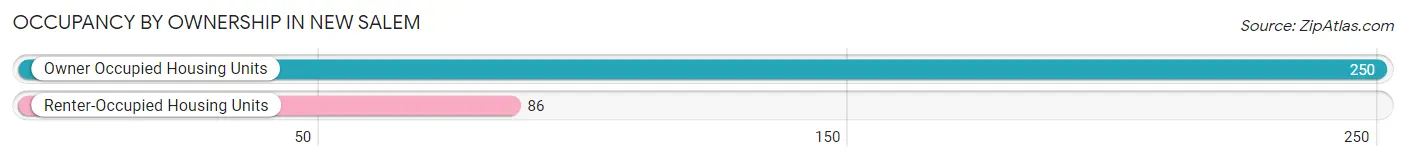
| Occupancy | # Housing Units | % Housing Units |
| Owner Occupied Housing Units | 250 | 74.4% |
| Renter-Occupied Housing Units | 86 | 25.6% |
| Total Occupied Housing Units | 336 | 100.0% |
Occupancy by Household Size in New Salem
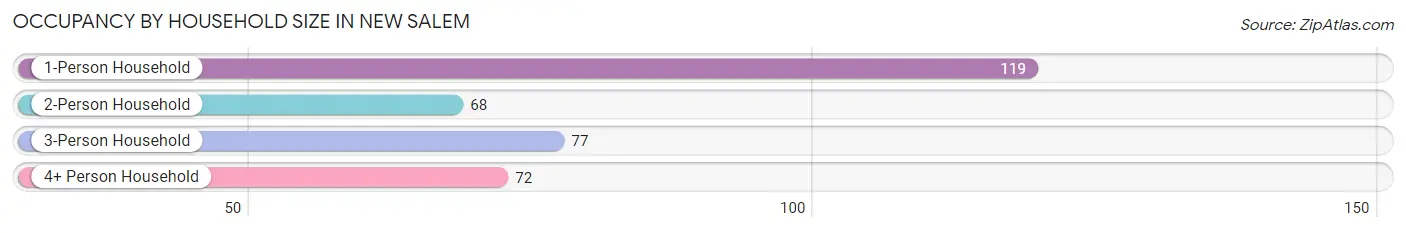
| Household Size | # Housing Units | % Housing Units |
| 1-Person Household | 119 | 35.4% |
| 2-Person Household | 68 | 20.2% |
| 3-Person Household | 77 | 22.9% |
| 4+ Person Household | 72 | 21.4% |
| Total Housing Units | 336 | 100.0% |
Occupancy by Ownership by Household Size in New Salem
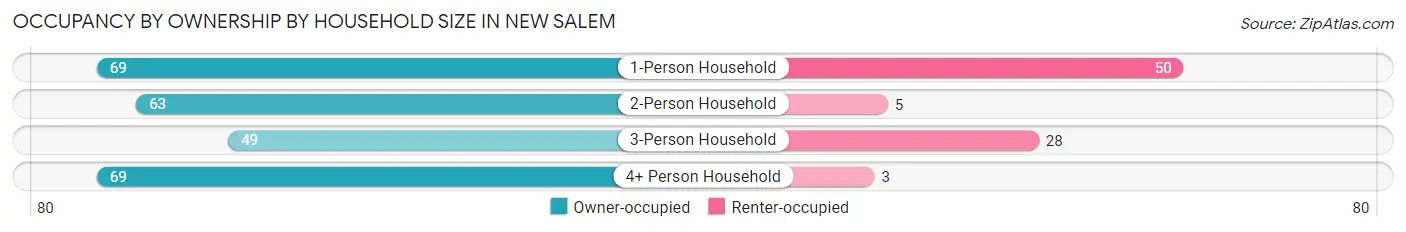
| Household Size | Owner-occupied | Renter-occupied |
| 1-Person Household | 69 (58.0%) | 50 (42.0%) |
| 2-Person Household | 63 (92.6%) | 5 (7.3%) |
| 3-Person Household | 49 (63.6%) | 28 (36.4%) |
| 4+ Person Household | 69 (95.8%) | 3 (4.2%) |
| Total Housing Units | 250 (74.4%) | 86 (25.6%) |
Occupancy by Educational Attainment in New Salem
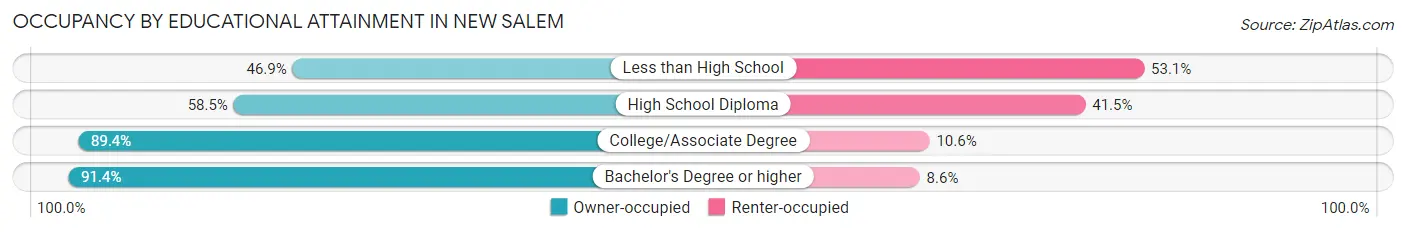
| Household Size | Owner-occupied | Renter-occupied |
| Less than High School | 15 (46.9%) | 17 (53.1%) |
| High School Diploma | 72 (58.5%) | 51 (41.5%) |
| College/Associate Degree | 110 (89.4%) | 13 (10.6%) |
| Bachelor's Degree or higher | 53 (91.4%) | 5 (8.6%) |
Occupancy by Age of Householder in New Salem
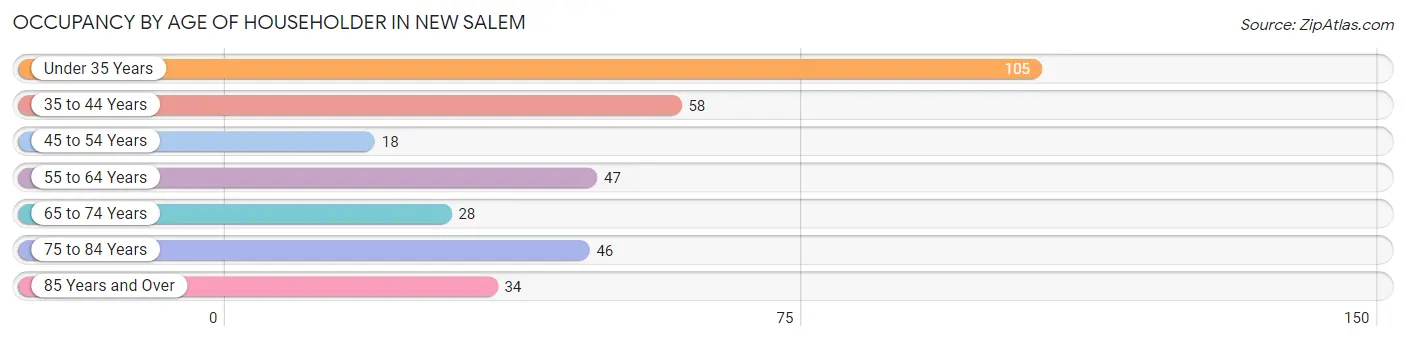
| Age Bracket | # Households | % Households |
| Under 35 Years | 105 | 31.2% |
| 35 to 44 Years | 58 | 17.3% |
| 45 to 54 Years | 18 | 5.4% |
| 55 to 64 Years | 47 | 14.0% |
| 65 to 74 Years | 28 | 8.3% |
| 75 to 84 Years | 46 | 13.7% |
| 85 Years and Over | 34 | 10.1% |
| Total | 336 | 100.0% |
Housing Finances in New Salem
Median Income by Occupancy in New Salem
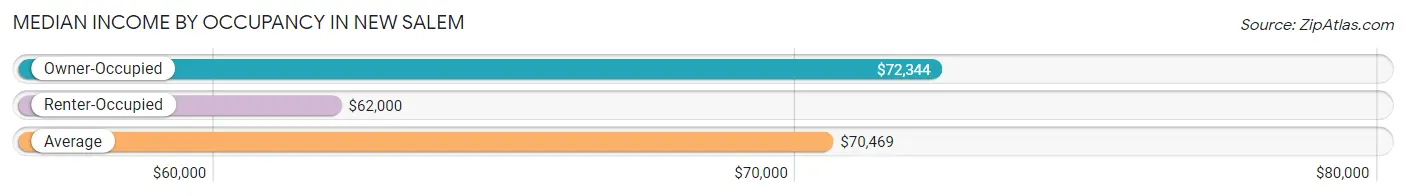
| Occupancy Type | # Households | Median Income |
| Owner-Occupied | 250 (74.4%) | $72,344 |
| Renter-Occupied | 86 (25.6%) | $62,000 |
| Average | 336 (100.0%) | $70,469 |
Occupancy by Householder Income Bracket in New Salem
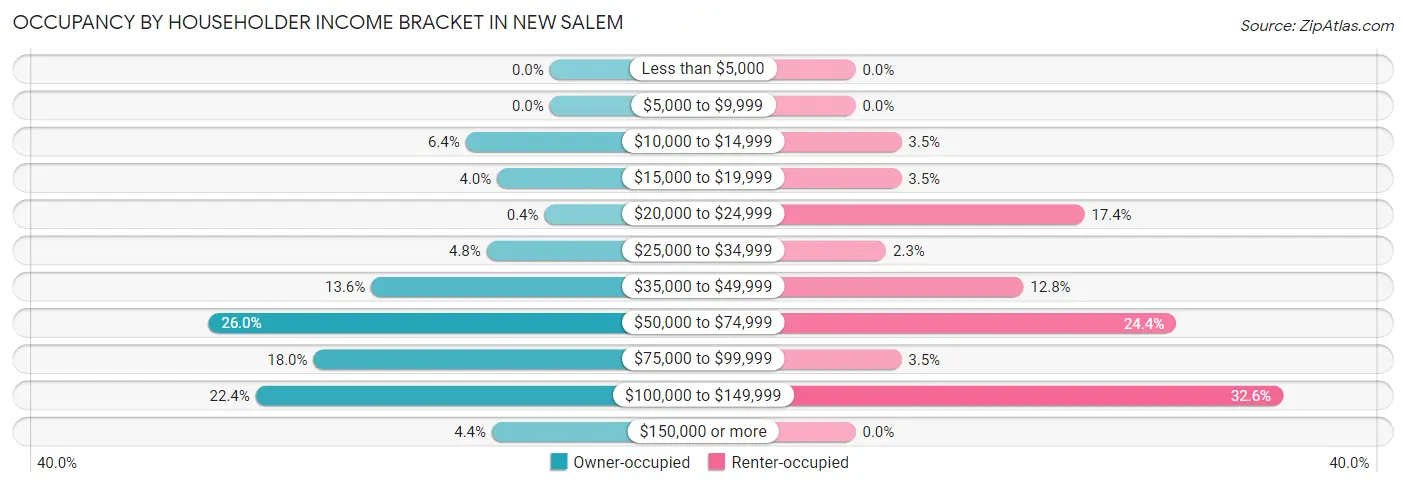
| Income Bracket | Owner-occupied | Renter-occupied |
| Less than $5,000 | 0 (0.0%) | 0 (0.0%) |
| $5,000 to $9,999 | 0 (0.0%) | 0 (0.0%) |
| $10,000 to $14,999 | 16 (6.4%) | 3 (3.5%) |
| $15,000 to $19,999 | 10 (4.0%) | 3 (3.5%) |
| $20,000 to $24,999 | 1 (0.4%) | 15 (17.4%) |
| $25,000 to $34,999 | 12 (4.8%) | 2 (2.3%) |
| $35,000 to $49,999 | 34 (13.6%) | 11 (12.8%) |
| $50,000 to $74,999 | 65 (26.0%) | 21 (24.4%) |
| $75,000 to $99,999 | 45 (18.0%) | 3 (3.5%) |
| $100,000 to $149,999 | 56 (22.4%) | 28 (32.6%) |
| $150,000 or more | 11 (4.4%) | 0 (0.0%) |
| Total | 250 (100.0%) | 86 (100.0%) |
Monthly Housing Cost Tiers in New Salem
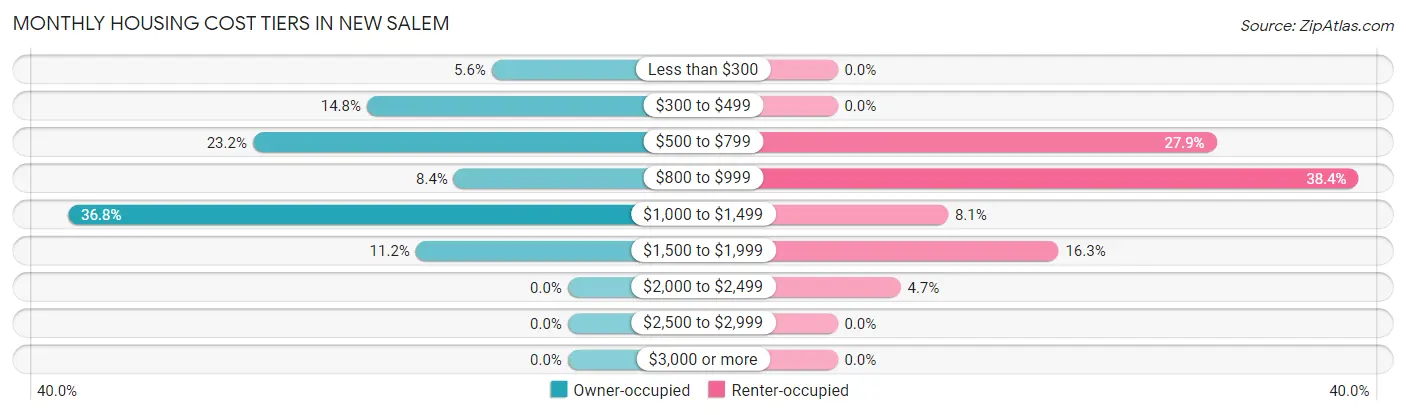
| Monthly Cost | Owner-occupied | Renter-occupied |
| Less than $300 | 14 (5.6%) | 0 (0.0%) |
| $300 to $499 | 37 (14.8%) | 0 (0.0%) |
| $500 to $799 | 58 (23.2%) | 24 (27.9%) |
| $800 to $999 | 21 (8.4%) | 33 (38.4%) |
| $1,000 to $1,499 | 92 (36.8%) | 7 (8.1%) |
| $1,500 to $1,999 | 28 (11.2%) | 14 (16.3%) |
| $2,000 to $2,499 | 0 (0.0%) | 4 (4.6%) |
| $2,500 to $2,999 | 0 (0.0%) | 0 (0.0%) |
| $3,000 or more | 0 (0.0%) | 0 (0.0%) |
| Total | 250 (100.0%) | 86 (100.0%) |
Physical Housing Characteristics in New Salem
Housing Structures in New Salem
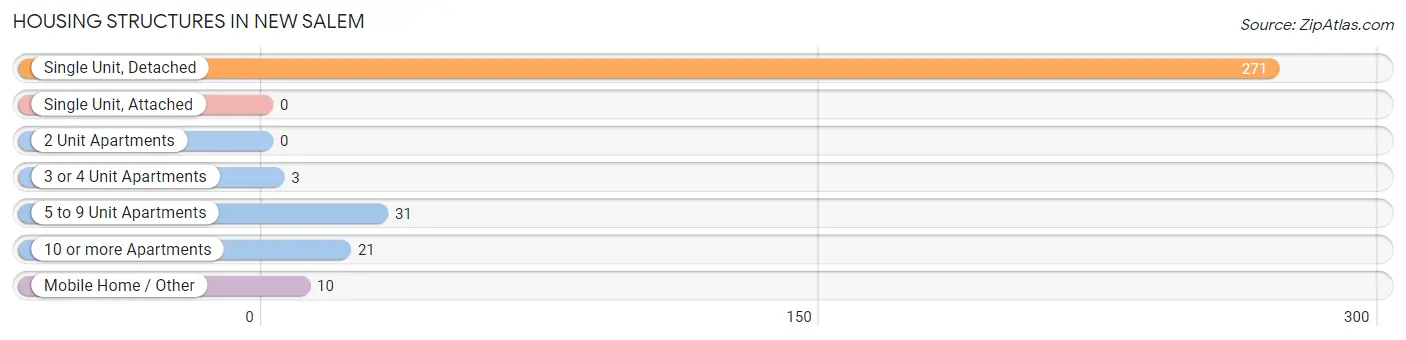
| Structure Type | # Housing Units | % Housing Units |
| Single Unit, Detached | 271 | 80.6% |
| Single Unit, Attached | 0 | 0.0% |
| 2 Unit Apartments | 0 | 0.0% |
| 3 or 4 Unit Apartments | 3 | 0.9% |
| 5 to 9 Unit Apartments | 31 | 9.2% |
| 10 or more Apartments | 21 | 6.2% |
| Mobile Home / Other | 10 | 3.0% |
| Total | 336 | 100.0% |
Housing Structures by Occupancy in New Salem
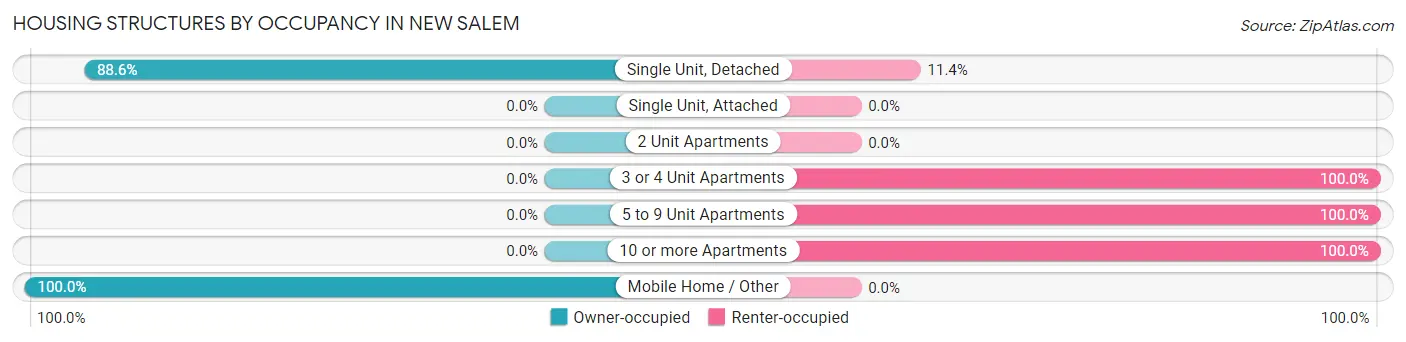
| Structure Type | Owner-occupied | Renter-occupied |
| Single Unit, Detached | 240 (88.6%) | 31 (11.4%) |
| Single Unit, Attached | 0 (0.0%) | 0 (0.0%) |
| 2 Unit Apartments | 0 (0.0%) | 0 (0.0%) |
| 3 or 4 Unit Apartments | 0 (0.0%) | 3 (100.0%) |
| 5 to 9 Unit Apartments | 0 (0.0%) | 31 (100.0%) |
| 10 or more Apartments | 0 (0.0%) | 21 (100.0%) |
| Mobile Home / Other | 10 (100.0%) | 0 (0.0%) |
| Total | 250 (74.4%) | 86 (25.6%) |
Housing Structures by Number of Rooms in New Salem
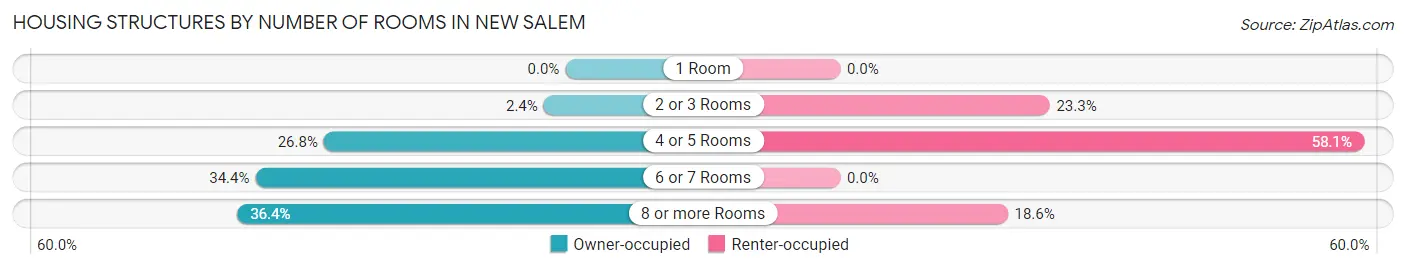
| Number of Rooms | Owner-occupied | Renter-occupied |
| 1 Room | 0 (0.0%) | 0 (0.0%) |
| 2 or 3 Rooms | 6 (2.4%) | 20 (23.3%) |
| 4 or 5 Rooms | 67 (26.8%) | 50 (58.1%) |
| 6 or 7 Rooms | 86 (34.4%) | 0 (0.0%) |
| 8 or more Rooms | 91 (36.4%) | 16 (18.6%) |
| Total | 250 (100.0%) | 86 (100.0%) |
Housing Structure by Heating Type in New Salem
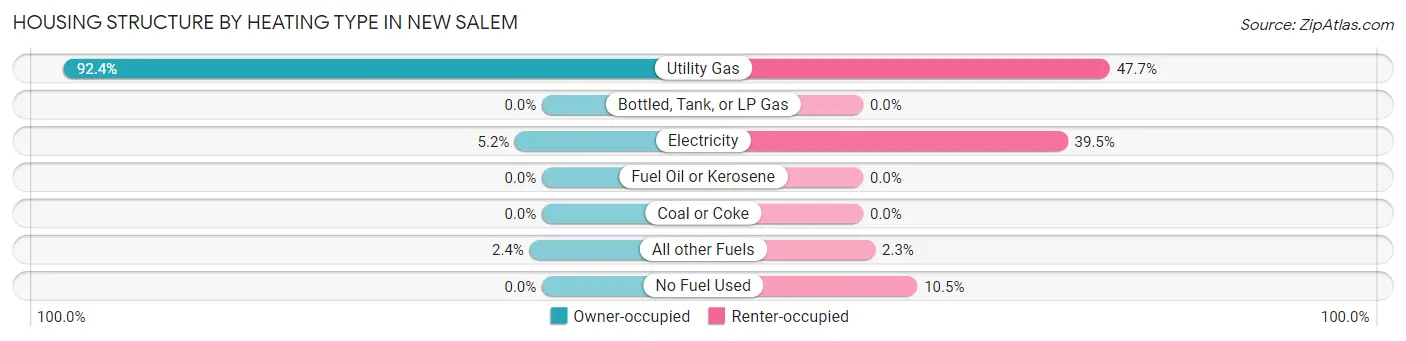
| Heating Type | Owner-occupied | Renter-occupied |
| Utility Gas | 231 (92.4%) | 41 (47.7%) |
| Bottled, Tank, or LP Gas | 0 (0.0%) | 0 (0.0%) |
| Electricity | 13 (5.2%) | 34 (39.5%) |
| Fuel Oil or Kerosene | 0 (0.0%) | 0 (0.0%) |
| Coal or Coke | 0 (0.0%) | 0 (0.0%) |
| All other Fuels | 6 (2.4%) | 2 (2.3%) |
| No Fuel Used | 0 (0.0%) | 9 (10.5%) |
| Total | 250 (100.0%) | 86 (100.0%) |
Household Vehicle Usage in New Salem
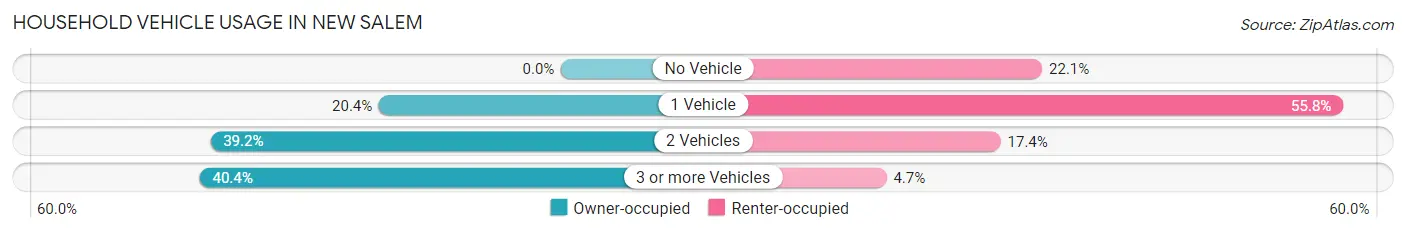
| Vehicles per Household | Owner-occupied | Renter-occupied |
| No Vehicle | 0 (0.0%) | 19 (22.1%) |
| 1 Vehicle | 51 (20.4%) | 48 (55.8%) |
| 2 Vehicles | 98 (39.2%) | 15 (17.4%) |
| 3 or more Vehicles | 101 (40.4%) | 4 (4.6%) |
| Total | 250 (100.0%) | 86 (100.0%) |
Real Estate & Mortgages in New Salem
Real Estate and Mortgage Overview in New Salem
| Characteristic | Without Mortgage | With Mortgage |
| Housing Units | 81 | 169 |
| Median Property Value | $164,800 | $174,400 |
| Median Household Income | $52,679 | $7 |
| Monthly Housing Costs | $466 | $0 |
| Real Estate Taxes | $1,533 | $11 |
Property Value by Mortgage Status in New Salem
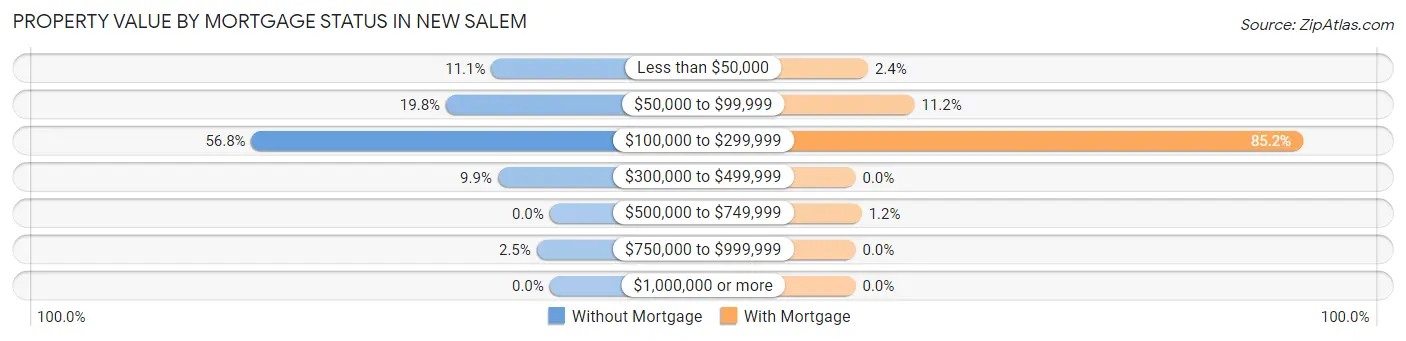
| Property Value | Without Mortgage | With Mortgage |
| Less than $50,000 | 9 (11.1%) | 4 (2.4%) |
| $50,000 to $99,999 | 16 (19.8%) | 19 (11.2%) |
| $100,000 to $299,999 | 46 (56.8%) | 144 (85.2%) |
| $300,000 to $499,999 | 8 (9.9%) | 0 (0.0%) |
| $500,000 to $749,999 | 0 (0.0%) | 2 (1.2%) |
| $750,000 to $999,999 | 2 (2.5%) | 0 (0.0%) |
| $1,000,000 or more | 0 (0.0%) | 0 (0.0%) |
| Total | 81 (100.0%) | 169 (100.0%) |
Household Income by Mortgage Status in New Salem
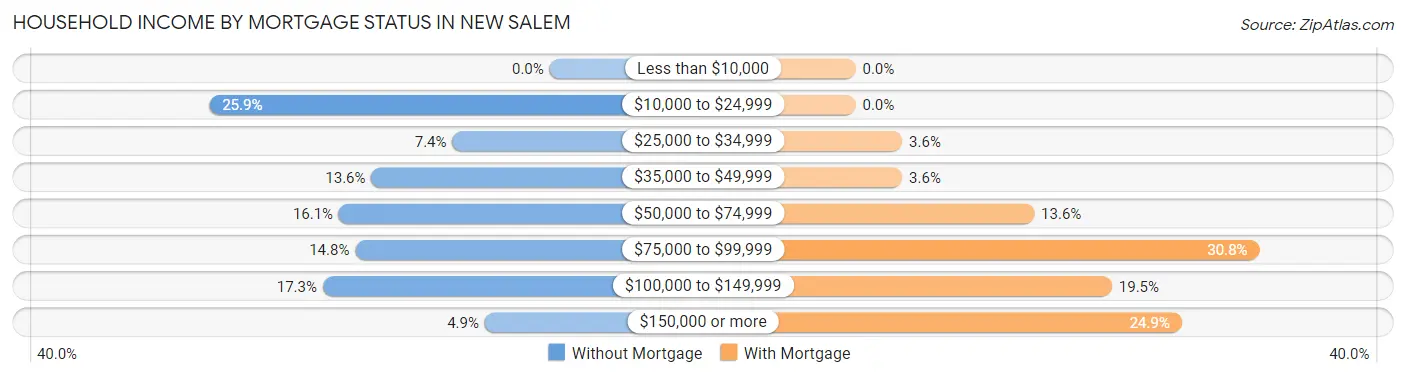
| Household Income | Without Mortgage | With Mortgage |
| Less than $10,000 | 0 (0.0%) | 0 (0.0%) |
| $10,000 to $24,999 | 21 (25.9%) | 0 (0.0%) |
| $25,000 to $34,999 | 6 (7.4%) | 6 (3.5%) |
| $35,000 to $49,999 | 11 (13.6%) | 6 (3.5%) |
| $50,000 to $74,999 | 13 (16.1%) | 23 (13.6%) |
| $75,000 to $99,999 | 12 (14.8%) | 52 (30.8%) |
| $100,000 to $149,999 | 14 (17.3%) | 33 (19.5%) |
| $150,000 or more | 4 (4.9%) | 42 (24.8%) |
| Total | 81 (100.0%) | 169 (100.0%) |
Property Value to Household Income Ratio in New Salem
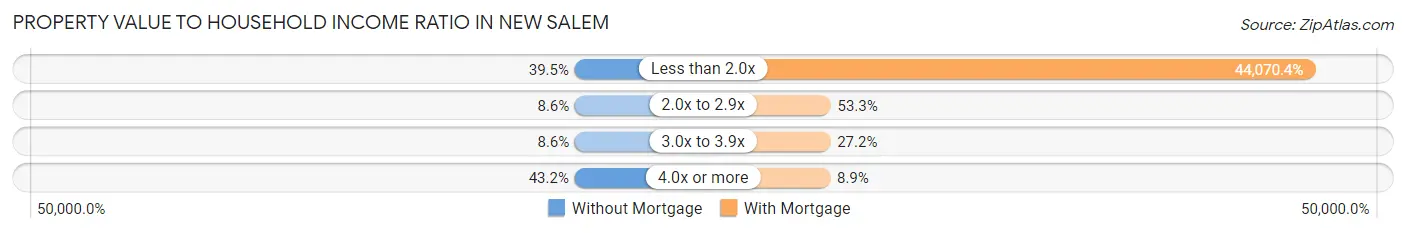
| Value-to-Income Ratio | Without Mortgage | With Mortgage |
| Less than 2.0x | 32 (39.5%) | 74,479 (44,070.4%) |
| 2.0x to 2.9x | 7 (8.6%) | 90 (53.2%) |
| 3.0x to 3.9x | 7 (8.6%) | 46 (27.2%) |
| 4.0x or more | 35 (43.2%) | 15 (8.9%) |
| Total | 81 (100.0%) | 169 (100.0%) |
Real Estate Taxes by Mortgage Status in New Salem
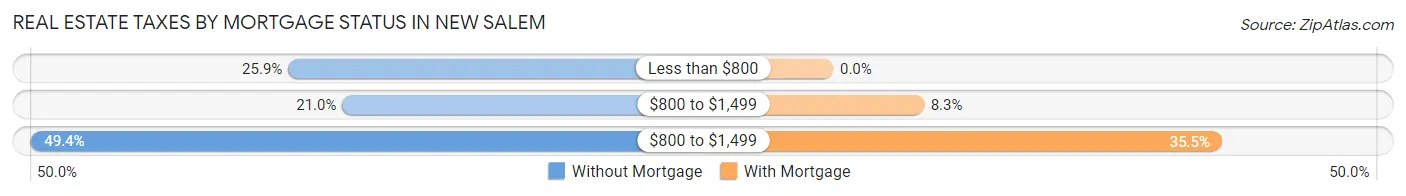
| Property Taxes | Without Mortgage | With Mortgage |
| Less than $800 | 21 (25.9%) | 0 (0.0%) |
| $800 to $1,499 | 17 (21.0%) | 14 (8.3%) |
| $800 to $1,499 | 40 (49.4%) | 60 (35.5%) |
| Total | 81 (100.0%) | 169 (100.0%) |
Health & Disability in New Salem
Health Insurance Coverage by Age in New Salem
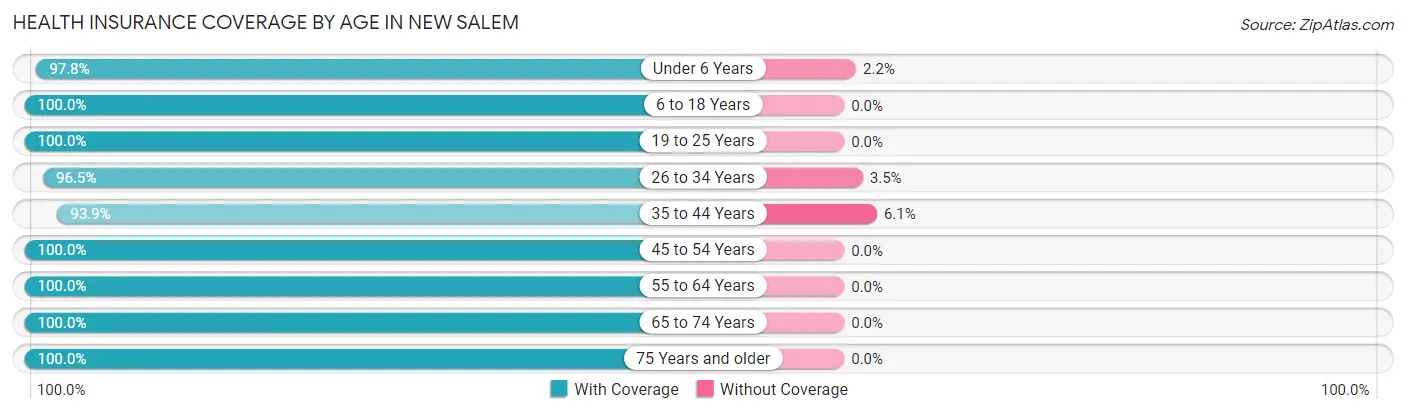
| Age Bracket | With Coverage | Without Coverage |
| Under 6 Years | 89 (97.8%) | 2 (2.2%) |
| 6 to 18 Years | 119 (100.0%) | 0 (0.0%) |
| 19 to 25 Years | 32 (100.0%) | 0 (0.0%) |
| 26 to 34 Years | 223 (96.5%) | 8 (3.5%) |
| 35 to 44 Years | 77 (93.9%) | 5 (6.1%) |
| 45 to 54 Years | 61 (100.0%) | 0 (0.0%) |
| 55 to 64 Years | 70 (100.0%) | 0 (0.0%) |
| 65 to 74 Years | 61 (100.0%) | 0 (0.0%) |
| 75 Years and older | 95 (100.0%) | 0 (0.0%) |
| Total | 827 (98.2%) | 15 (1.8%) |
Health Insurance Coverage by Citizenship Status in New Salem
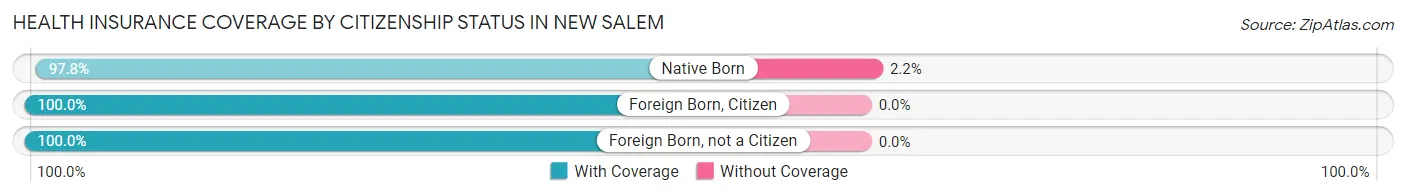
| Citizenship Status | With Coverage | Without Coverage |
| Native Born | 89 (97.8%) | 2 (2.2%) |
| Foreign Born, Citizen | 119 (100.0%) | 0 (0.0%) |
| Foreign Born, not a Citizen | 32 (100.0%) | 0 (0.0%) |
Health Insurance Coverage by Household Income in New Salem
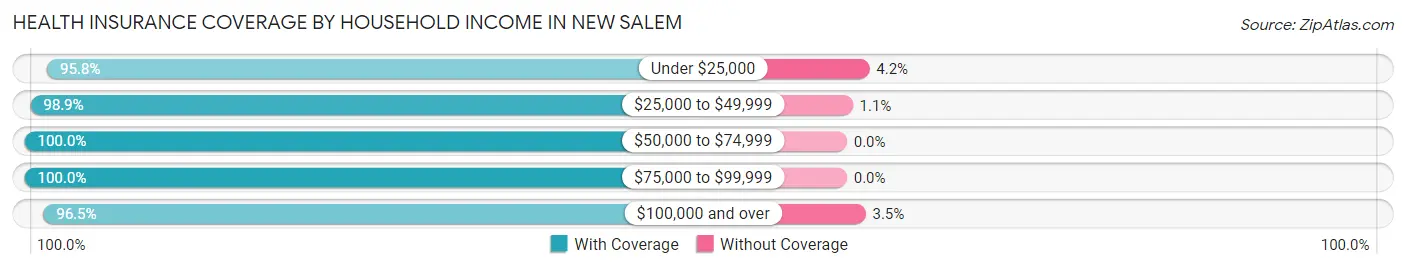
| Household Income | With Coverage | Without Coverage |
| Under $25,000 | 68 (95.8%) | 3 (4.2%) |
| $25,000 to $49,999 | 92 (98.9%) | 1 (1.1%) |
| $50,000 to $74,999 | 250 (100.0%) | 0 (0.0%) |
| $75,000 to $99,999 | 115 (100.0%) | 0 (0.0%) |
| $100,000 and over | 302 (96.5%) | 11 (3.5%) |
Public vs Private Health Insurance Coverage by Age in New Salem
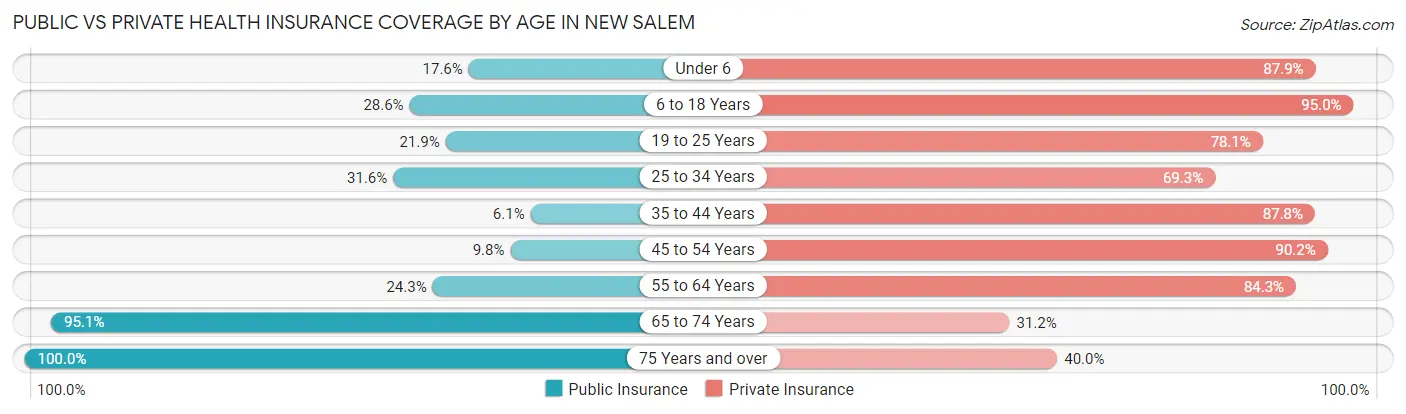
| Age Bracket | Public Insurance | Private Insurance |
| Under 6 | 16 (17.6%) | 80 (87.9%) |
| 6 to 18 Years | 34 (28.6%) | 113 (95.0%) |
| 19 to 25 Years | 7 (21.9%) | 25 (78.1%) |
| 25 to 34 Years | 73 (31.6%) | 160 (69.3%) |
| 35 to 44 Years | 5 (6.1%) | 72 (87.8%) |
| 45 to 54 Years | 6 (9.8%) | 55 (90.2%) |
| 55 to 64 Years | 17 (24.3%) | 59 (84.3%) |
| 65 to 74 Years | 58 (95.1%) | 19 (31.1%) |
| 75 Years and over | 95 (100.0%) | 38 (40.0%) |
| Total | 311 (36.9%) | 621 (73.8%) |
Disability Status by Sex by Age in New Salem
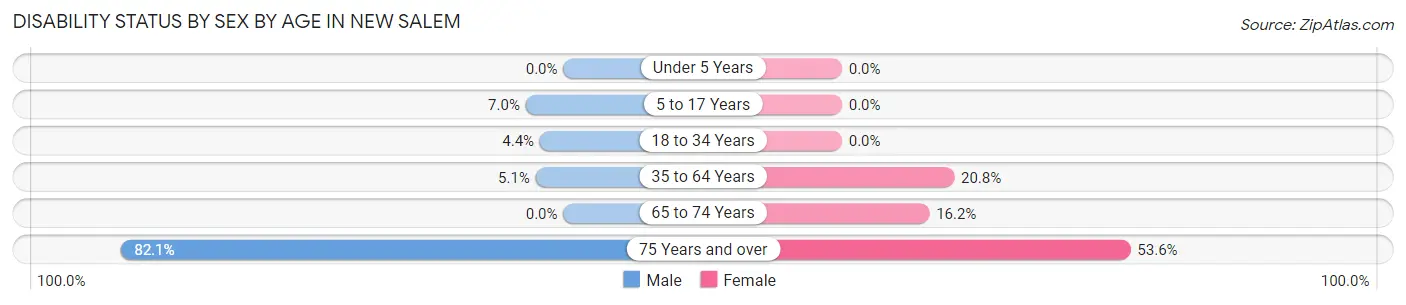
| Age Bracket | Male | Female |
| Under 5 Years | 0 (0.0%) | 0 (0.0%) |
| 5 to 17 Years | 3 (7.0%) | 0 (0.0%) |
| 18 to 34 Years | 5 (4.3%) | 0 (0.0%) |
| 35 to 64 Years | 6 (5.1%) | 20 (20.8%) |
| 65 to 74 Years | 0 (0.0%) | 6 (16.2%) |
| 75 Years and over | 32 (82.1%) | 30 (53.6%) |
Disability Class by Sex by Age in New Salem
Disability Class: Hearing Difficulty
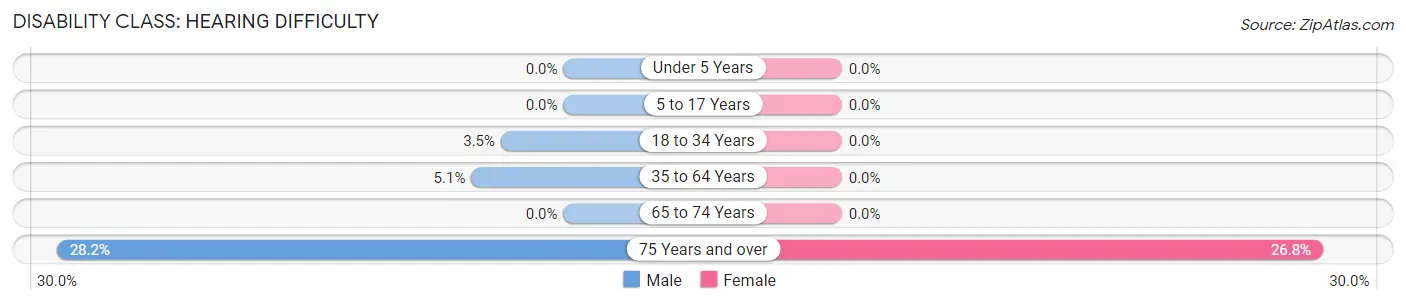
| Age Bracket | Male | Female |
| Under 5 Years | 0 (0.0%) | 0 (0.0%) |
| 5 to 17 Years | 0 (0.0%) | 0 (0.0%) |
| 18 to 34 Years | 4 (3.5%) | 0 (0.0%) |
| 35 to 64 Years | 6 (5.1%) | 0 (0.0%) |
| 65 to 74 Years | 0 (0.0%) | 0 (0.0%) |
| 75 Years and over | 11 (28.2%) | 15 (26.8%) |
Disability Class: Vision Difficulty
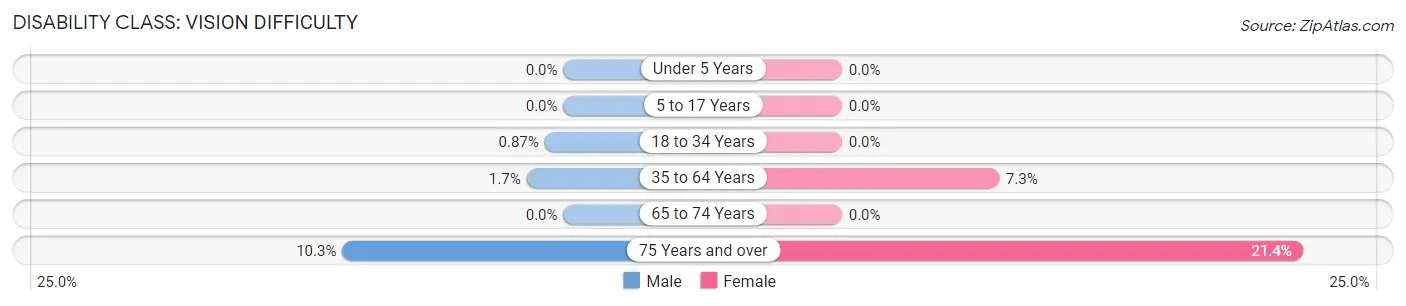
| Age Bracket | Male | Female |
| Under 5 Years | 0 (0.0%) | 0 (0.0%) |
| 5 to 17 Years | 0 (0.0%) | 0 (0.0%) |
| 18 to 34 Years | 1 (0.9%) | 0 (0.0%) |
| 35 to 64 Years | 2 (1.7%) | 7 (7.3%) |
| 65 to 74 Years | 0 (0.0%) | 0 (0.0%) |
| 75 Years and over | 4 (10.3%) | 12 (21.4%) |
Disability Class: Cognitive Difficulty
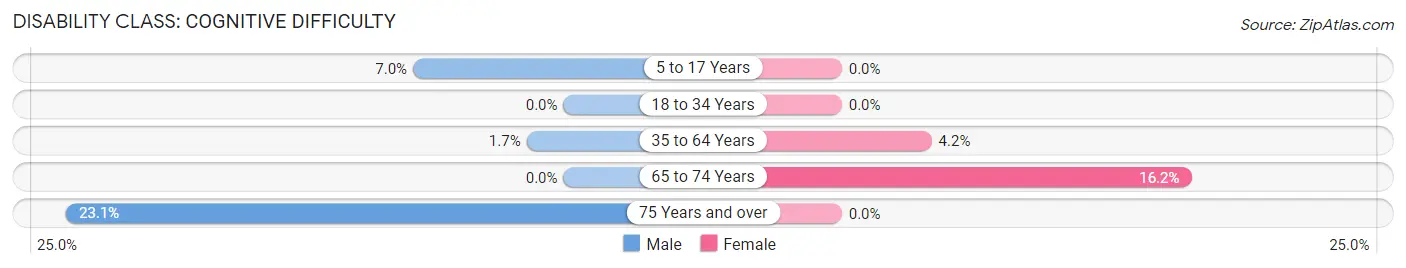
| Age Bracket | Male | Female |
| 5 to 17 Years | 3 (7.0%) | 0 (0.0%) |
| 18 to 34 Years | 0 (0.0%) | 0 (0.0%) |
| 35 to 64 Years | 2 (1.7%) | 4 (4.2%) |
| 65 to 74 Years | 0 (0.0%) | 6 (16.2%) |
| 75 Years and over | 9 (23.1%) | 0 (0.0%) |
Disability Class: Ambulatory Difficulty
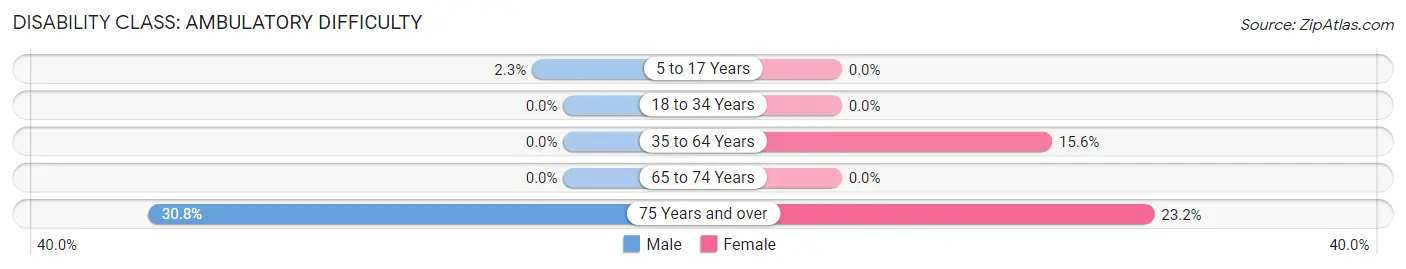
| Age Bracket | Male | Female |
| 5 to 17 Years | 1 (2.3%) | 0 (0.0%) |
| 18 to 34 Years | 0 (0.0%) | 0 (0.0%) |
| 35 to 64 Years | 0 (0.0%) | 15 (15.6%) |
| 65 to 74 Years | 0 (0.0%) | 0 (0.0%) |
| 75 Years and over | 12 (30.8%) | 13 (23.2%) |
Disability Class: Self-Care Difficulty
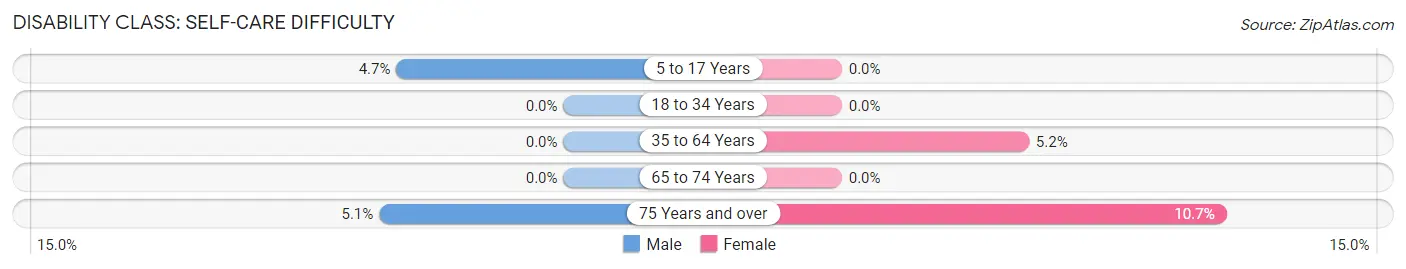
| Age Bracket | Male | Female |
| 5 to 17 Years | 2 (4.6%) | 0 (0.0%) |
| 18 to 34 Years | 0 (0.0%) | 0 (0.0%) |
| 35 to 64 Years | 0 (0.0%) | 5 (5.2%) |
| 65 to 74 Years | 0 (0.0%) | 0 (0.0%) |
| 75 Years and over | 2 (5.1%) | 6 (10.7%) |
Technology Access in New Salem
Computing Device Access in New Salem
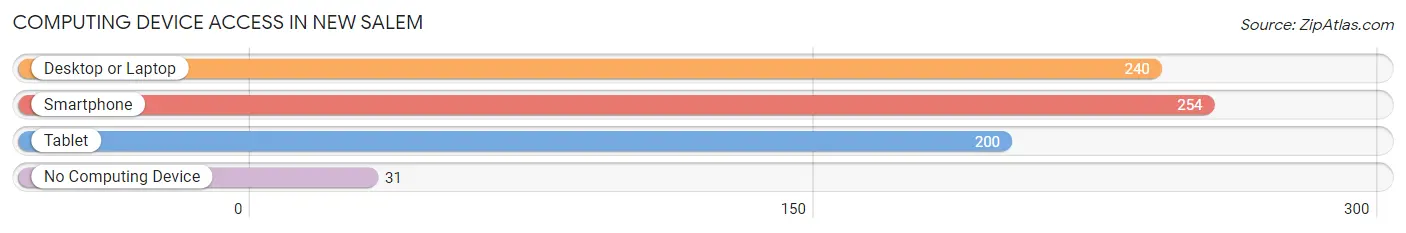
| Device Type | # Households | % Households |
| Desktop or Laptop | 240 | 71.4% |
| Smartphone | 254 | 75.6% |
| Tablet | 200 | 59.5% |
| No Computing Device | 31 | 9.2% |
| Total | 336 | 100.0% |
Internet Access in New Salem
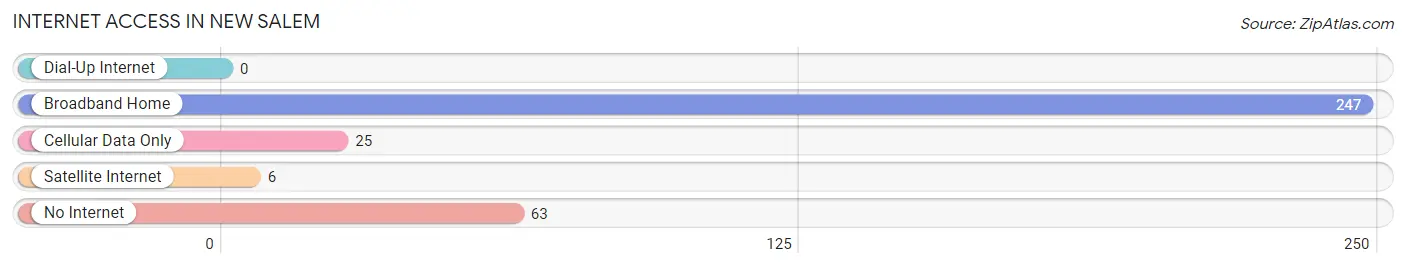
| Internet Type | # Households | % Households |
| Dial-Up Internet | 0 | 0.0% |
| Broadband Home | 247 | 73.5% |
| Cellular Data Only | 25 | 7.4% |
| Satellite Internet | 6 | 1.8% |
| No Internet | 63 | 18.8% |
| Total | 336 | 100.0% |
New Salem Summary
New Salem, North Dakota is a small city located in Morton County, in the south-central region of the state. It is situated along the banks of the Missouri River, and is home to a population of 1,845 people, according to the 2010 census. The city is part of the Bismarck-Mandan Metropolitan Statistical Area, and is the county seat of Morton County.
History
New Salem was founded in 1883, when the Northern Pacific Railroad was extended to the area. The city was named after the nearby town of Salem, which had been founded in 1872. The city was incorporated in 1885, and was the first city in Morton County.
In the early 1900s, New Salem was a thriving agricultural center, with a population of over 1,000 people. The city was home to a number of businesses, including a bank, a hotel, a newspaper, and a variety of stores.
In the 1950s, the city began to decline, as many of its residents moved away in search of better economic opportunities. By the 1970s, the population had dropped to just over 500 people.
In the 1980s, the city began to experience a resurgence, as new businesses and industries moved into the area. The population has since grown to its current level of 1,845 people.
Geography
New Salem is located in the south-central region of North Dakota, in Morton County. It is situated along the banks of the Missouri River, and is approximately 25 miles west of Bismarck, the state capital.
The city has a total area of 1.2 square miles, all of which is land. The terrain is mostly flat, with some rolling hills in the surrounding area.
Economy
The economy of New Salem is largely based on agriculture and manufacturing. The city is home to a number of businesses, including a grain elevator, a feed mill, a lumber yard, and a variety of other small businesses.
The city is also home to a number of manufacturing companies, including a plastics manufacturer, a metal fabrication company, and a printing company.
Demographics
According to the 2010 census, the population of New Salem was 1,845 people. The racial makeup of the city was 97.2% White, 0.7% Native American, 0.3% Asian, 0.2% African American, and 1.6% from other races.
The median household income in New Salem was $41,250, and the median family income was $50,000. The per capita income was $20,845.
Conclusion
New Salem, North Dakota is a small city located in Morton County, in the south-central region of the state. It is situated along the banks of the Missouri River, and is home to a population of 1,845 people, according to the 2010 census. The city is part of the Bismarck-Mandan Metropolitan Statistical Area, and is the county seat of Morton County. The economy of New Salem is largely based on agriculture and manufacturing, and the city is home to a number of businesses and industries. The racial makeup of the city is 97.2% White, 0.7% Native American, 0.3% Asian, 0.2% African American, and 1.6% from other races. The median household income in New Salem was $41,250, and the median family income was $50,000.
Common Questions
What is Per Capita Income in New Salem?
Per Capita income in New Salem is $29,571.
What is the Median Family Income in New Salem?
Median Family Income in New Salem is $78,250.
What is the Median Household income in New Salem?
Median Household Income in New Salem is $70,469.
What is Income or Wage Gap in New Salem?
Income or Wage Gap in New Salem is 55.3%.
Women in New Salem earn 44.7 cents for every dollar earned by a man.
What is Inequality or Gini Index in New Salem?
Inequality or Gini Index in New Salem is 0.32.
What is the Total Population of New Salem?
Total Population of New Salem is 939.
What is the Total Male Population of New Salem?
Total Male Population of New Salem is 429.
What is the Total Female Population of New Salem?
Total Female Population of New Salem is 510.
What is the Ratio of Males per 100 Females in New Salem?
There are 84.12 Males per 100 Females in New Salem.
What is the Ratio of Females per 100 Males in New Salem?
There are 118.88 Females per 100 Males in New Salem.
What is the Median Population Age in New Salem?
Median Population Age in New Salem is 34.9 Years.
What is the Average Family Size in New Salem
Average Family Size in New Salem is 3.1 People.
What is the Average Household Size in New Salem
Average Household Size in New Salem is 2.5 People.
How Large is the Labor Force in New Salem?
There are 470 People in the Labor Forcein in New Salem.
What is the Percentage of People in the Labor Force in New Salem?
62.3% of People are in the Labor Force in New Salem.
What is the Unemployment Rate in New Salem?
Unemployment Rate in New Salem is 3.2%.