Des Lacs, ND Map & Demographics
Des Lacs Map
Des Lacs Overview
$45,951
PER CAPITA INCOME
$115,625
AVG FAMILY INCOME
$78,750
AVG HOUSEHOLD INCOME
29.1%
WAGE / INCOME GAP [ % ]
70.9¢/ $1
WAGE / INCOME GAP [ $ ]
0.27
INEQUALITY / GINI INDEX
200
TOTAL POPULATION
116
MALE POPULATION
84
FEMALE POPULATION
138.10
MALES / 100 FEMALES
72.41
FEMALES / 100 MALES
42.8
MEDIAN AGE
2.7
AVG FAMILY SIZE
2.1
AVG HOUSEHOLD SIZE
138
LABOR FORCE [ PEOPLE ]
81.2%
PERCENT IN LABOR FORCE
Des Lacs Zip Codes
Des Lacs Area Codes
Income in Des Lacs
Income Overview in Des Lacs
Per Capita Income in Des Lacs is $45,951, while median incomes of families and households are $115,625 and $78,750 respectively.
| Characteristic | Number | Measure |
| Per Capita Income | 200 | $45,951 |
| Median Family Income | 57 | $115,625 |
| Mean Family Income | 57 | $116,593 |
| Median Household Income | 95 | $78,750 |
| Mean Household Income | 95 | $96,042 |
| Income Deficit | 57 | $0 |
| Wage / Income Gap (%) | 200 | 29.09% |
| Wage / Income Gap ($) | 200 | 70.91¢ per $1 |
| Gini / Inequality Index | 200 | 0.27 |
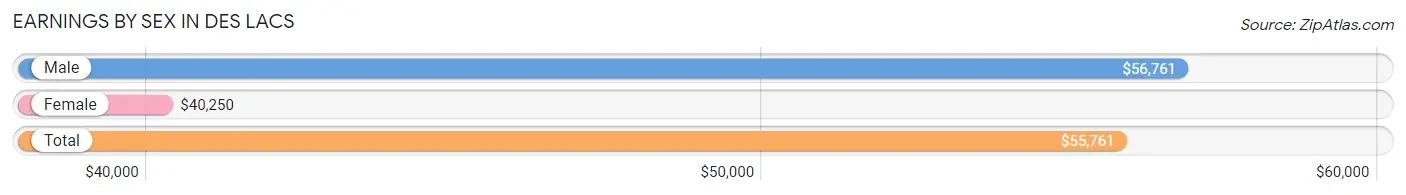
Earnings by Sex in Des Lacs
Average Earnings in Des Lacs are $55,761, $56,761 for men and $40,250 for women, a difference of 29.1%.
| Sex | Number | Average Earnings |
| Male | 91 (62.3%) | $56,761 |
| Female | 55 (37.7%) | $40,250 |
| Total | 146 (100.0%) | $55,761 |
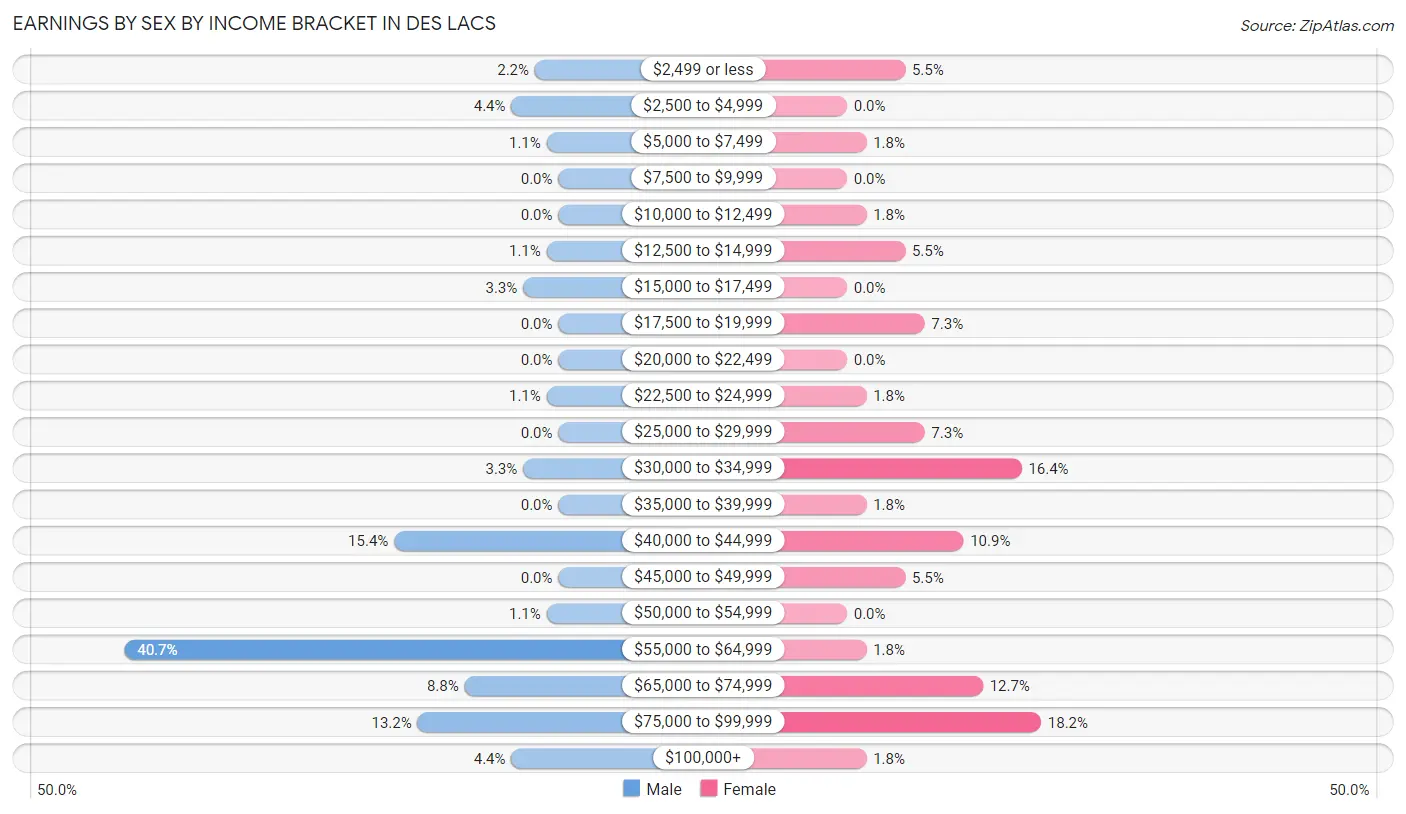
Earnings by Sex by Income Bracket in Des Lacs
The most common earnings brackets in Des Lacs are $55,000 to $64,999 for men (37 | 40.7%) and $75,000 to $99,999 for women (10 | 18.2%).
| Income | Male | Female |
| $2,499 or less | 2 (2.2%) | 3 (5.4%) |
| $2,500 to $4,999 | 4 (4.4%) | 0 (0.0%) |
| $5,000 to $7,499 | 1 (1.1%) | 1 (1.8%) |
| $7,500 to $9,999 | 0 (0.0%) | 0 (0.0%) |
| $10,000 to $12,499 | 0 (0.0%) | 1 (1.8%) |
| $12,500 to $14,999 | 1 (1.1%) | 3 (5.4%) |
| $15,000 to $17,499 | 3 (3.3%) | 0 (0.0%) |
| $17,500 to $19,999 | 0 (0.0%) | 4 (7.3%) |
| $20,000 to $22,499 | 0 (0.0%) | 0 (0.0%) |
| $22,500 to $24,999 | 1 (1.1%) | 1 (1.8%) |
| $25,000 to $29,999 | 0 (0.0%) | 4 (7.3%) |
| $30,000 to $34,999 | 3 (3.3%) | 9 (16.4%) |
| $35,000 to $39,999 | 0 (0.0%) | 1 (1.8%) |
| $40,000 to $44,999 | 14 (15.4%) | 6 (10.9%) |
| $45,000 to $49,999 | 0 (0.0%) | 3 (5.4%) |
| $50,000 to $54,999 | 1 (1.1%) | 0 (0.0%) |
| $55,000 to $64,999 | 37 (40.7%) | 1 (1.8%) |
| $65,000 to $74,999 | 8 (8.8%) | 7 (12.7%) |
| $75,000 to $99,999 | 12 (13.2%) | 10 (18.2%) |
| $100,000+ | 4 (4.4%) | 1 (1.8%) |
| Total | 91 (100.0%) | 55 (100.0%) |
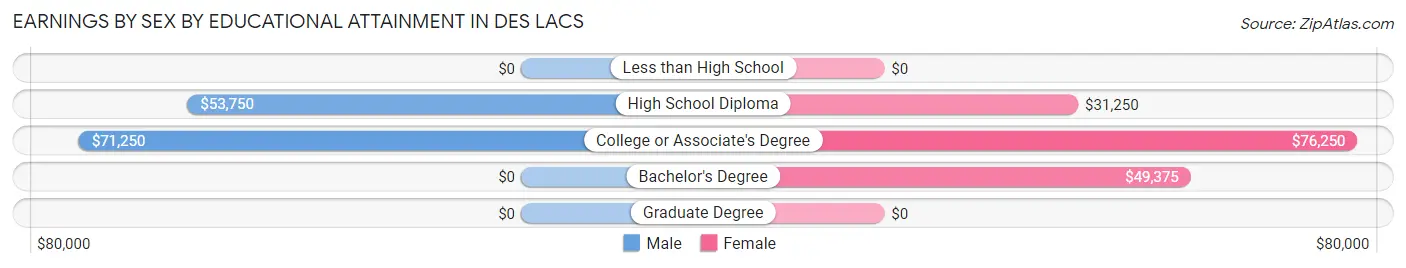
Earnings by Sex by Educational Attainment in Des Lacs
Average earnings in Des Lacs are $57,750 for men and $42,250 for women, a difference of 26.8%. Men with an educational attainment of college or associate's degree enjoy the highest average annual earnings of $71,250, while those with high school diploma education earn the least with $53,750. Women with an educational attainment of college or associate's degree earn the most with the average annual earnings of $76,250, while those with high school diploma education have the smallest earnings of $31,250.
| Educational Attainment | Male Income | Female Income |
| Less than High School | - | - |
| High School Diploma | $53,750 | $31,250 |
| College or Associate's Degree | $71,250 | $76,250 |
| Bachelor's Degree | - | - |
| Graduate Degree | - | - |
| Total | $57,750 | $42,250 |
Family Income in Des Lacs
Family Income Brackets in Des Lacs
According to the Des Lacs family income data, there are 19 families falling into the $100,000 to $149,999 income range, which is the most common income bracket and makes up 33.3% of all families.
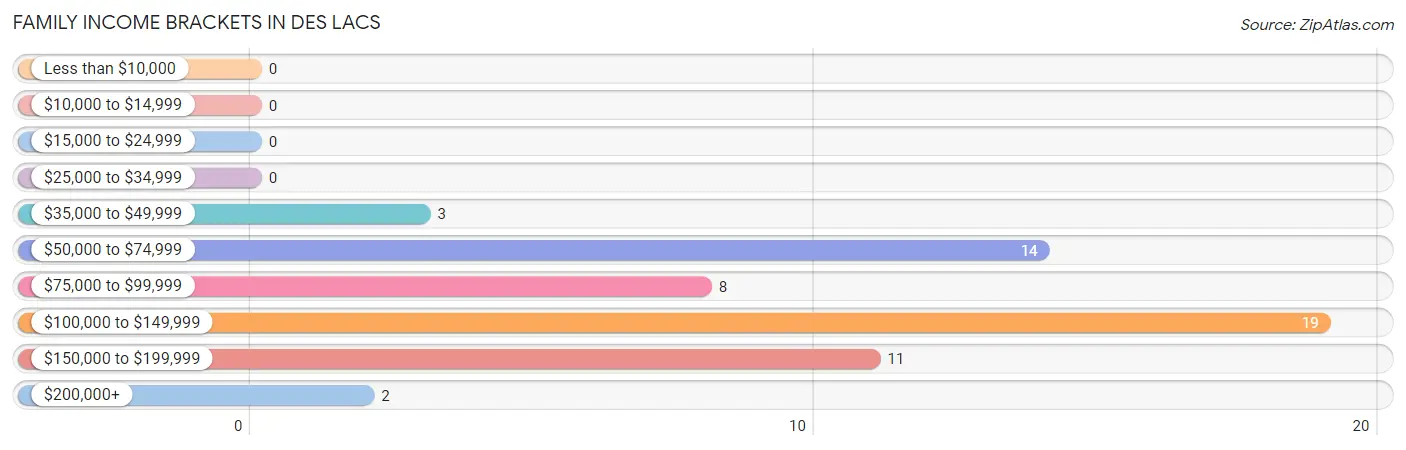
| Income Bracket | # Families | % Families |
| Less than $10,000 | 0 | 0.0% |
| $10,000 to $14,999 | 0 | 0.0% |
| $15,000 to $24,999 | 0 | 0.0% |
| $25,000 to $34,999 | 0 | 0.0% |
| $35,000 to $49,999 | 3 | 5.3% |
| $50,000 to $74,999 | 14 | 24.6% |
| $75,000 to $99,999 | 8 | 14.0% |
| $100,000 to $149,999 | 19 | 33.3% |
| $150,000 to $199,999 | 11 | 19.3% |
| $200,000+ | 2 | 3.5% |
Family Income by Famaliy Size in Des Lacs
3-person families (8 | 14.0%) account for the highest median family income in Des Lacs with $126,250 per family, while 2-person families (41 | 71.9%) have the highest median income of $51,875 per family member.
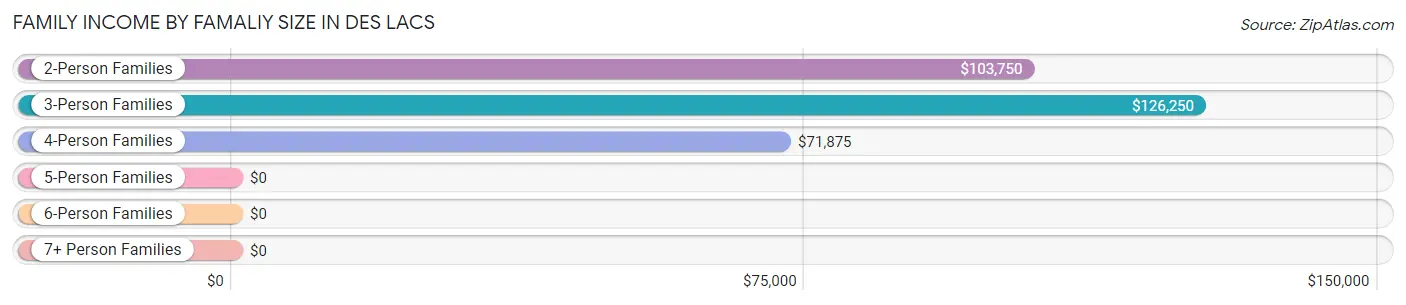
| Income Bracket | # Families | Median Income |
| 2-Person Families | 41 (71.9%) | $103,750 |
| 3-Person Families | 8 (14.0%) | $126,250 |
| 4-Person Families | 6 (10.5%) | $71,875 |
| 5-Person Families | 1 (1.8%) | $0 |
| 6-Person Families | 1 (1.8%) | $0 |
| 7+ Person Families | 0 (0.0%) | $0 |
| Total | 57 (100.0%) | $115,625 |
Family Income by Number of Earners in Des Lacs
The median family income in Des Lacs is $115,625, with families comprising 2 earners (35) having the highest median family income of $135,938, while families with 1 earner (11) have the lowest median family income of $64,250, accounting for 61.4% and 19.3% of families, respectively.
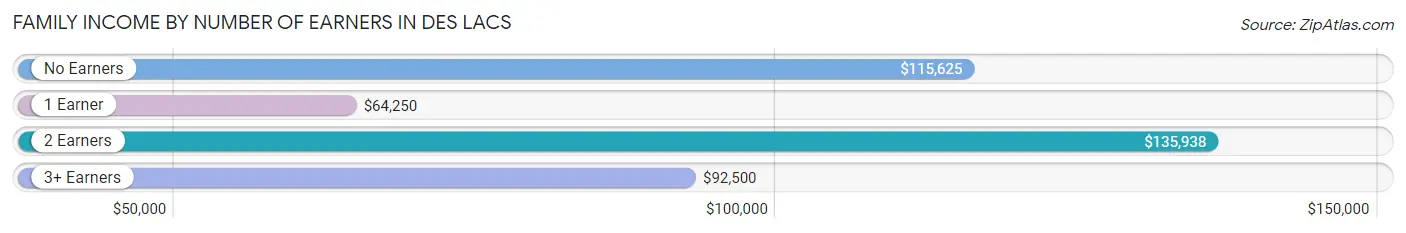
| Number of Earners | # Families | Median Income |
| No Earners | 5 (8.8%) | $115,625 |
| 1 Earner | 11 (19.3%) | $64,250 |
| 2 Earners | 35 (61.4%) | $135,938 |
| 3+ Earners | 6 (10.5%) | $92,500 |
| Total | 57 (100.0%) | $115,625 |
Household Income in Des Lacs
Household Income Brackets in Des Lacs
With 34 households falling in the category, the $50,000 to $74,999 income range is the most frequent in Des Lacs, accounting for 35.8% of all households.
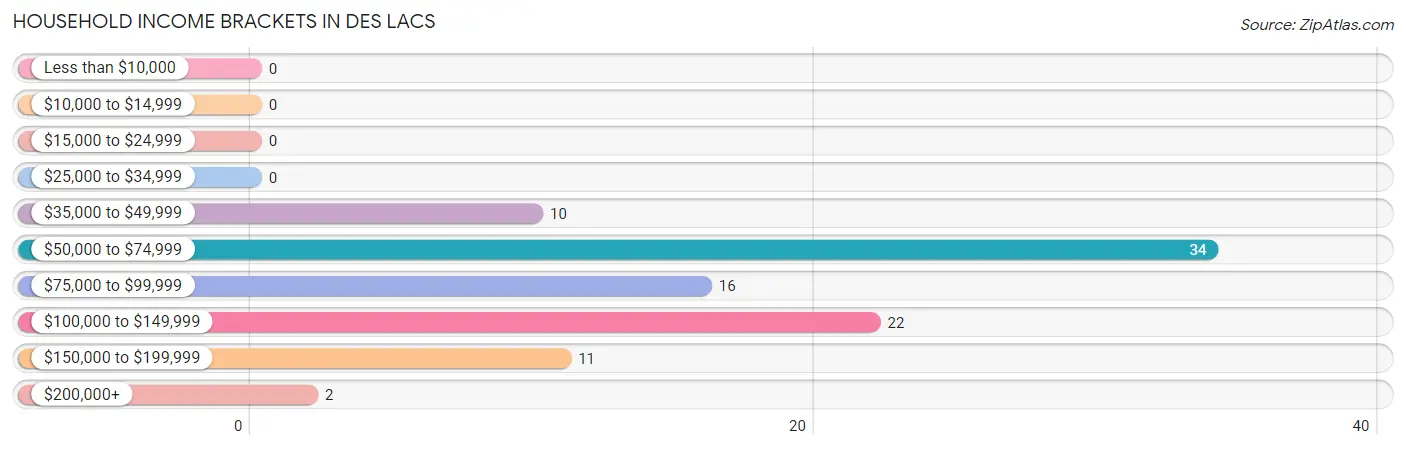
| Income Bracket | # Households | % Households |
| Less than $10,000 | 0 | 0.0% |
| $10,000 to $14,999 | 0 | 0.0% |
| $15,000 to $24,999 | 0 | 0.0% |
| $25,000 to $34,999 | 0 | 0.0% |
| $35,000 to $49,999 | 10 | 10.5% |
| $50,000 to $74,999 | 34 | 35.8% |
| $75,000 to $99,999 | 16 | 16.8% |
| $100,000 to $149,999 | 22 | 23.2% |
| $150,000 to $199,999 | 11 | 11.6% |
| $200,000+ | 2 | 2.1% |
Household Income by Householder Age in Des Lacs
The median household income in Des Lacs is $78,750, with the highest median household income of $94,750 found in the 25 to 44 years age bracket for the primary householder. A total of 25 households (26.3%) fall into this category. Meanwhile, the 15 to 24 years age bracket for the primary householder has the lowest median household income of $0, with 7 households (7.4%) in this group.
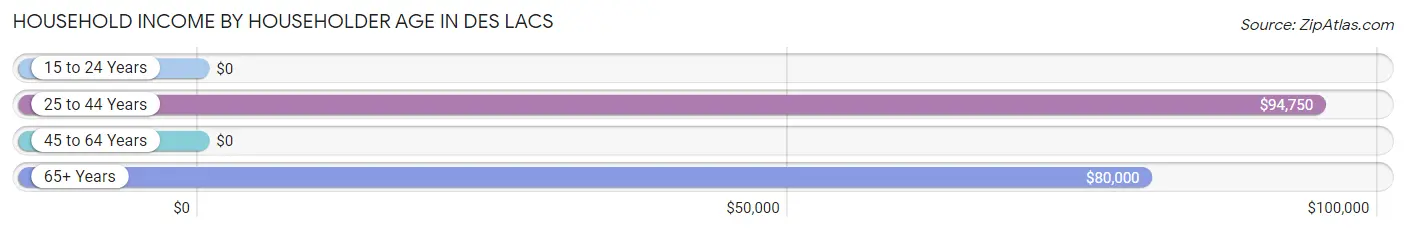
| Income Bracket | # Households | Median Income |
| 15 to 24 Years | 7 (7.4%) | $0 |
| 25 to 44 Years | 25 (26.3%) | $94,750 |
| 45 to 64 Years | 43 (45.3%) | $0 |
| 65+ Years | 20 (21.0%) | $80,000 |
| Total | 95 (100.0%) | $78,750 |
Poverty in Des Lacs
Income Below Poverty by Sex and Age in Des Lacs
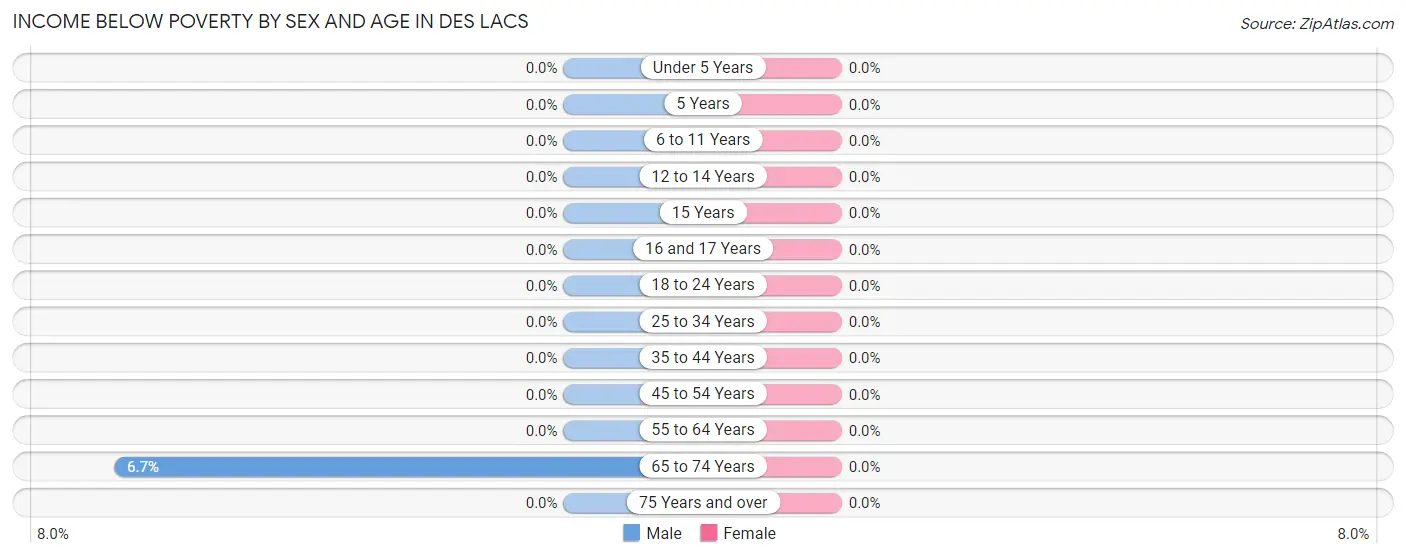
| Age Bracket | Male | Female |
| Under 5 Years | 0 (0.0%) | 0 (0.0%) |
| 5 Years | 0 (0.0%) | 0 (0.0%) |
| 6 to 11 Years | 0 (0.0%) | 0 (0.0%) |
| 12 to 14 Years | 0 (0.0%) | 0 (0.0%) |
| 15 Years | 0 (0.0%) | 0 (0.0%) |
| 16 and 17 Years | 0 (0.0%) | 0 (0.0%) |
| 18 to 24 Years | 0 (0.0%) | 0 (0.0%) |
| 25 to 34 Years | 0 (0.0%) | 0 (0.0%) |
| 35 to 44 Years | 0 (0.0%) | 0 (0.0%) |
| 45 to 54 Years | 0 (0.0%) | 0 (0.0%) |
| 55 to 64 Years | 0 (0.0%) | 0 (0.0%) |
| 65 to 74 Years | 1 (6.7%) | 0 (0.0%) |
| 75 Years and over | 0 (0.0%) | 0 (0.0%) |
| Total | 1 (0.9%) | 0 (0.0%) |
Income Above Poverty by Sex and Age in Des Lacs
According to the poverty statistics in Des Lacs, males aged under 5 years and females aged under 5 years are the age groups that are most secure financially, with 100.0% of males and 100.0% of females in these age groups living above the poverty line.
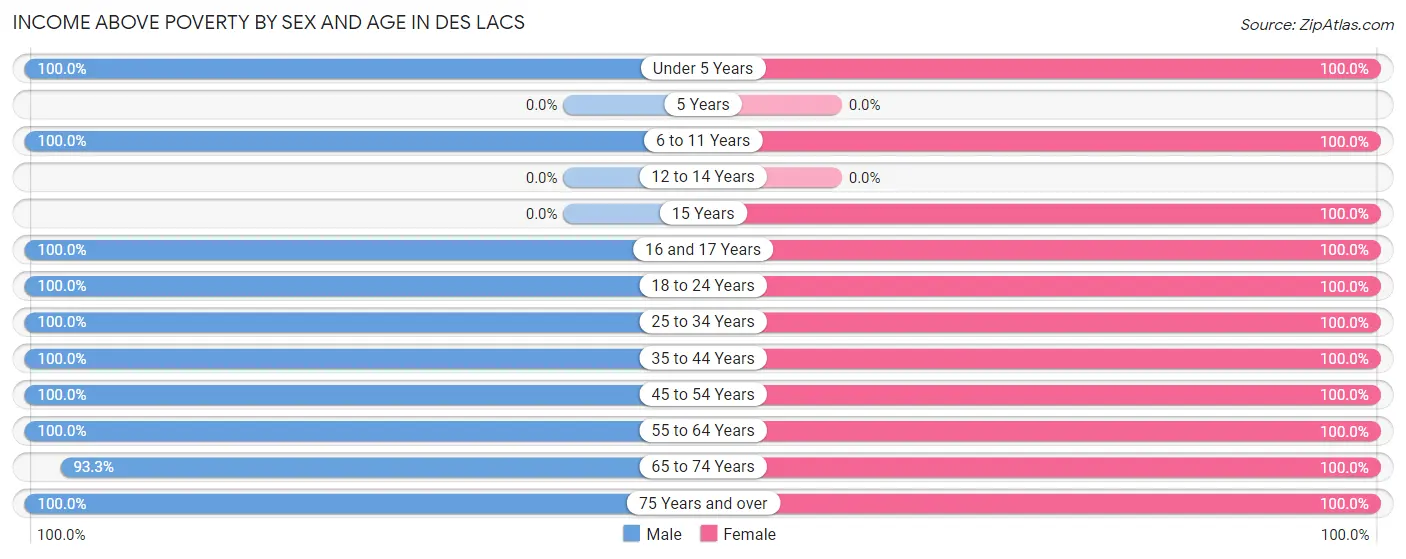
| Age Bracket | Male | Female |
| Under 5 Years | 2 (100.0%) | 8 (100.0%) |
| 5 Years | 0 (0.0%) | 0 (0.0%) |
| 6 to 11 Years | 9 (100.0%) | 9 (100.0%) |
| 12 to 14 Years | 0 (0.0%) | 0 (0.0%) |
| 15 Years | 0 (0.0%) | 2 (100.0%) |
| 16 and 17 Years | 5 (100.0%) | 3 (100.0%) |
| 18 to 24 Years | 13 (100.0%) | 7 (100.0%) |
| 25 to 34 Years | 11 (100.0%) | 11 (100.0%) |
| 35 to 44 Years | 16 (100.0%) | 5 (100.0%) |
| 45 to 54 Years | 9 (100.0%) | 6 (100.0%) |
| 55 to 64 Years | 34 (100.0%) | 18 (100.0%) |
| 65 to 74 Years | 14 (93.3%) | 9 (100.0%) |
| 75 Years and over | 2 (100.0%) | 6 (100.0%) |
| Total | 115 (99.1%) | 84 (100.0%) |
Income Below Poverty Among Married-Couple Families in Des Lacs
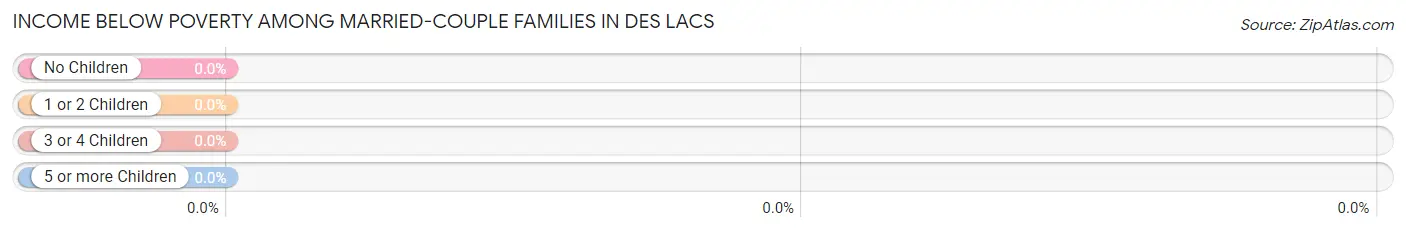
| Children | Above Poverty | Below Poverty |
| No Children | 38 (100.0%) | 0 (0.0%) |
| 1 or 2 Children | 9 (100.0%) | 0 (0.0%) |
| 3 or 4 Children | 2 (100.0%) | 0 (0.0%) |
| 5 or more Children | 0 (0.0%) | 0 (0.0%) |
| Total | 49 (100.0%) | 0 (0.0%) |
Income Below Poverty Among Single-Parent Households in Des Lacs
| Children | Single Father | Single Mother |
| No Children | 0 (0.0%) | 0 (0.0%) |
| 1 or 2 Children | 0 (0.0%) | 0 (0.0%) |
| 3 or 4 Children | 0 (0.0%) | 0 (0.0%) |
| 5 or more Children | 0 (0.0%) | 0 (0.0%) |
| Total | 0 (0.0%) | 0 (0.0%) |
Income Below Poverty Among Married-Couple vs Single-Parent Households in Des Lacs
| Children | Married-Couple Families | Single-Parent Households |
| No Children | 0 (0.0%) | 0 (0.0%) |
| 1 or 2 Children | 0 (0.0%) | 0 (0.0%) |
| 3 or 4 Children | 0 (0.0%) | 0 (0.0%) |
| 5 or more Children | 0 (0.0%) | 0 (0.0%) |
| Total | 0 (0.0%) | 0 (0.0%) |
Race in Des Lacs
The most populous races in Des Lacs are White / Caucasian (194 | 97.0%), Asian (4 | 2.0%), and Hispanic or Latino (4 | 2.0%).
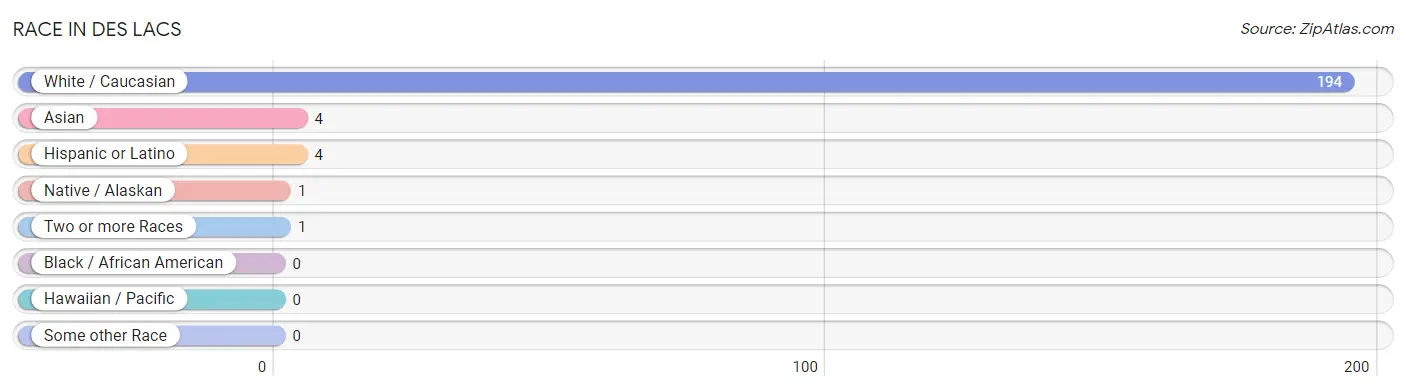
| Race | # Population | % Population |
| Asian | 4 | 2.0% |
| Black / African American | 0 | 0.0% |
| Hawaiian / Pacific | 0 | 0.0% |
| Hispanic or Latino | 4 | 2.0% |
| Native / Alaskan | 1 | 0.5% |
| White / Caucasian | 194 | 97.0% |
| Two or more Races | 1 | 0.5% |
| Some other Race | 0 | 0.0% |
| Total | 200 | 100.0% |
Ancestry in Des Lacs
The most populous ancestries reported in Des Lacs are Norwegian (90 | 45.0%), German (52 | 26.0%), Scandinavian (15 | 7.5%), Swedish (13 | 6.5%), and American (10 | 5.0%), together accounting for 90.0% of all Des Lacs residents.
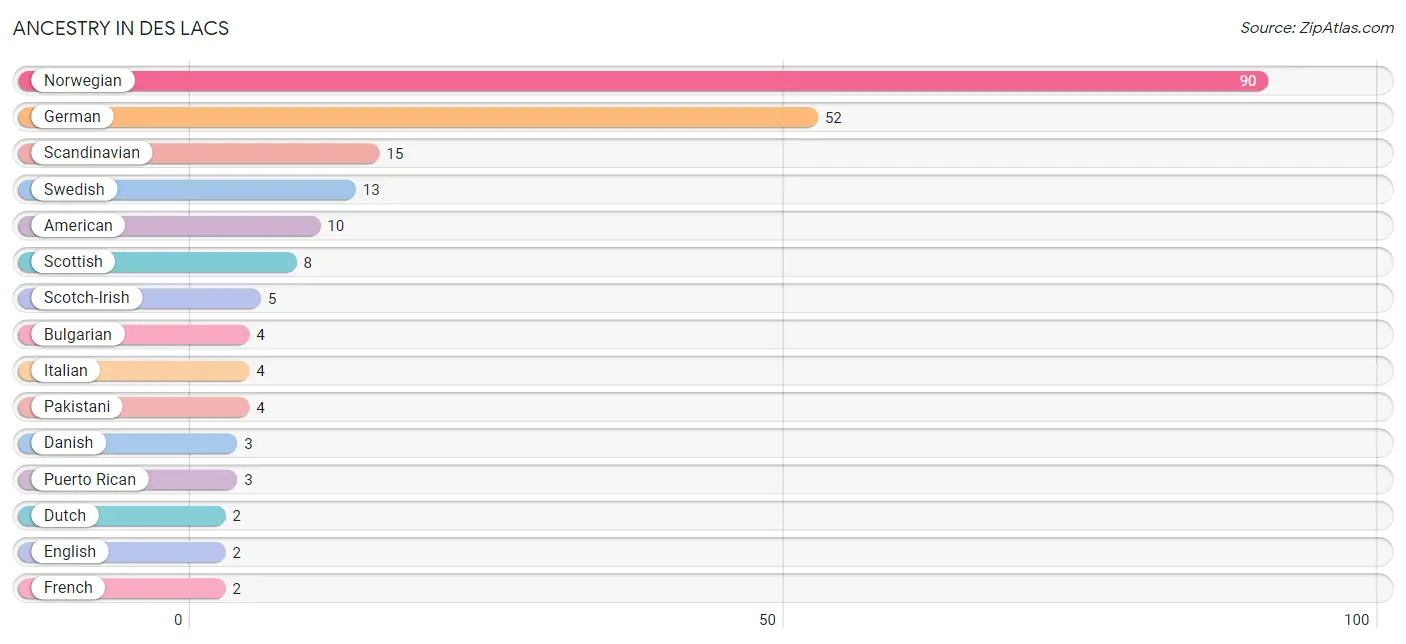
| Ancestry | # Population | % Population |
| American | 10 | 5.0% |
| Bulgarian | 4 | 2.0% |
| Czech | 1 | 0.5% |
| Danish | 3 | 1.5% |
| Dutch | 2 | 1.0% |
| English | 2 | 1.0% |
| French | 2 | 1.0% |
| French American Indian | 1 | 0.5% |
| German | 52 | 26.0% |
| Irish | 1 | 0.5% |
| Italian | 4 | 2.0% |
| Mexican | 1 | 0.5% |
| Norwegian | 90 | 45.0% |
| Pakistani | 4 | 2.0% |
| Polish | 1 | 0.5% |
| Puerto Rican | 3 | 1.5% |
| Russian | 1 | 0.5% |
| Scandinavian | 15 | 7.5% |
| Scotch-Irish | 5 | 2.5% |
| Scottish | 8 | 4.0% |
| Swedish | 13 | 6.5% | View All 21 Rows |
Immigrants in Des Lacs
The most numerous immigrant groups reported in Des Lacs came from Asia (4 | 2.0%), South Eastern Asia (4 | 2.0%), and Thailand (4 | 2.0%), together accounting for 6.0% of all Des Lacs residents.
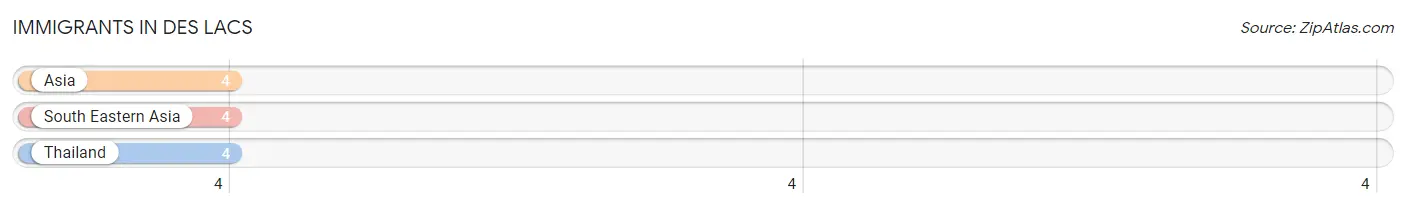
| Immigration Origin | # Population | % Population |
| Asia | 4 | 2.0% |
| South Eastern Asia | 4 | 2.0% |
| Thailand | 4 | 2.0% | View All 3 Rows |
Sex and Age in Des Lacs
Sex and Age in Des Lacs
The most populous age groups in Des Lacs are 60 to 64 Years (27 | 23.3%) for men and 30 to 34 Years (11 | 13.1%) for women.
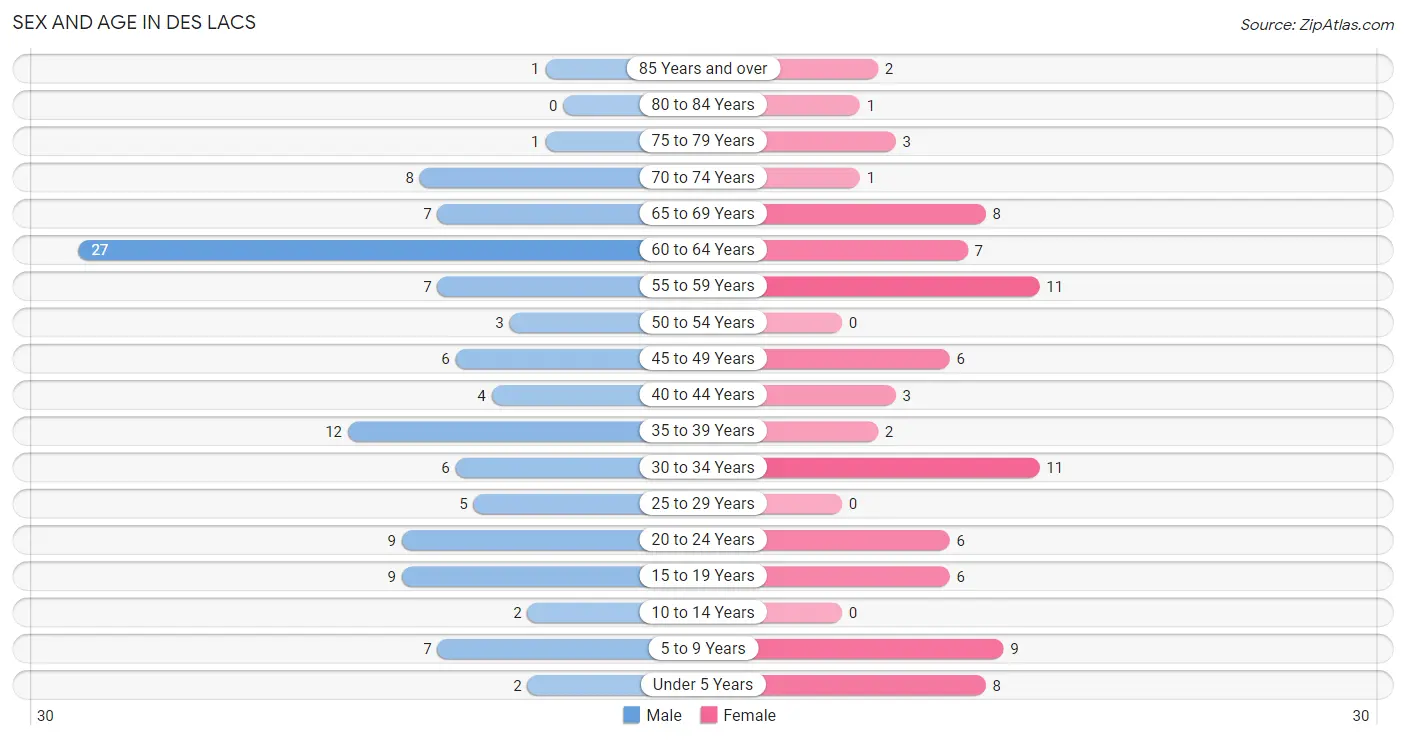
| Age Bracket | Male | Female |
| Under 5 Years | 2 (1.7%) | 8 (9.5%) |
| 5 to 9 Years | 7 (6.0%) | 9 (10.7%) |
| 10 to 14 Years | 2 (1.7%) | 0 (0.0%) |
| 15 to 19 Years | 9 (7.8%) | 6 (7.1%) |
| 20 to 24 Years | 9 (7.8%) | 6 (7.1%) |
| 25 to 29 Years | 5 (4.3%) | 0 (0.0%) |
| 30 to 34 Years | 6 (5.2%) | 11 (13.1%) |
| 35 to 39 Years | 12 (10.3%) | 2 (2.4%) |
| 40 to 44 Years | 4 (3.5%) | 3 (3.6%) |
| 45 to 49 Years | 6 (5.2%) | 6 (7.1%) |
| 50 to 54 Years | 3 (2.6%) | 0 (0.0%) |
| 55 to 59 Years | 7 (6.0%) | 11 (13.1%) |
| 60 to 64 Years | 27 (23.3%) | 7 (8.3%) |
| 65 to 69 Years | 7 (6.0%) | 8 (9.5%) |
| 70 to 74 Years | 8 (6.9%) | 1 (1.2%) |
| 75 to 79 Years | 1 (0.9%) | 3 (3.6%) |
| 80 to 84 Years | 0 (0.0%) | 1 (1.2%) |
| 85 Years and over | 1 (0.9%) | 2 (2.4%) |
| Total | 116 (100.0%) | 84 (100.0%) |
Families and Households in Des Lacs
Median Family Size in Des Lacs
The median family size in Des Lacs is 2.70 persons per family, with single female/mother families (3 | 5.3%) accounting for the largest median family size of 4.67 persons per family. On the other hand, single male/father families (5 | 8.8%) represent the smallest median family size with 2.40 persons per family.
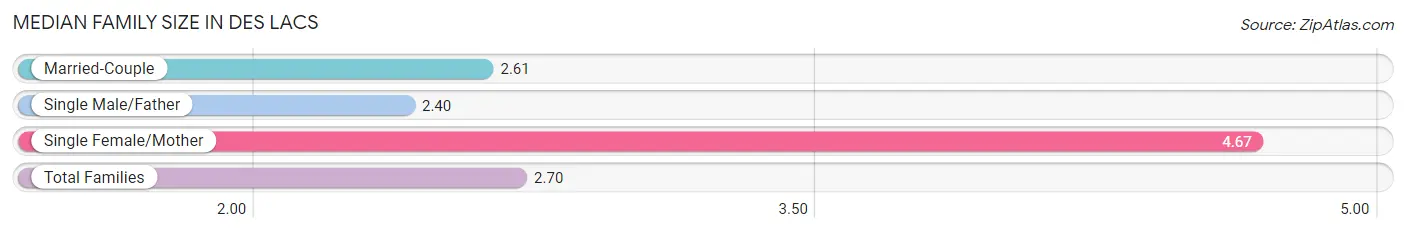
| Family Type | # Families | Family Size |
| Married-Couple | 49 (86.0%) | 2.61 |
| Single Male/Father | 5 (8.8%) | 2.40 |
| Single Female/Mother | 3 (5.3%) | 4.67 |
| Total Families | 57 (100.0%) | 2.70 |
Median Household Size in Des Lacs
The median household size in Des Lacs is 2.11 persons per household, with single female/mother households (3 | 3.2%) accounting for the largest median household size of 5.67 persons per household. non-family households (38 | 40.0%) represent the smallest median household size with 1.13 persons per household.
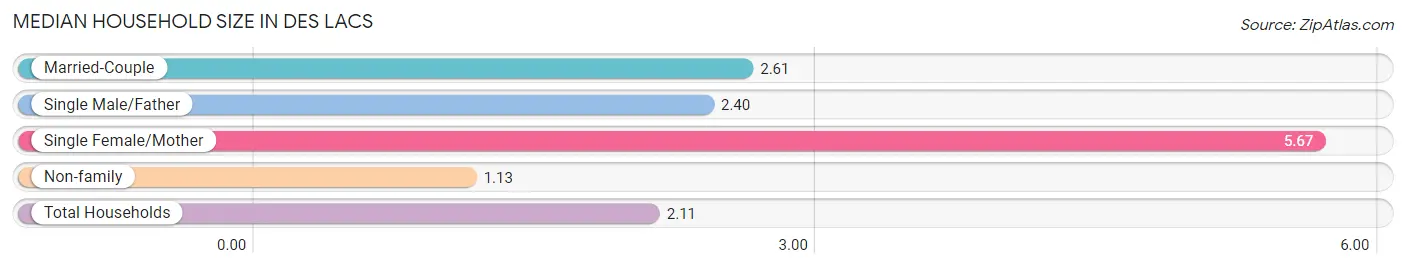
| Household Type | # Households | Household Size |
| Married-Couple | 49 (51.6%) | 2.61 |
| Single Male/Father | 5 (5.3%) | 2.40 |
| Single Female/Mother | 3 (3.2%) | 5.67 |
| Non-family | 38 (40.0%) | 1.13 |
| Total Households | 95 (100.0%) | 2.11 |
Household Size by Marriage Status in Des Lacs
Out of a total of 95 households in Des Lacs, 57 (60.0%) are family households, while 38 (40.0%) are nonfamily households. The most numerous type of family households are 2-person households, comprising 41, and the most common type of nonfamily households are 1-person households, comprising 32.
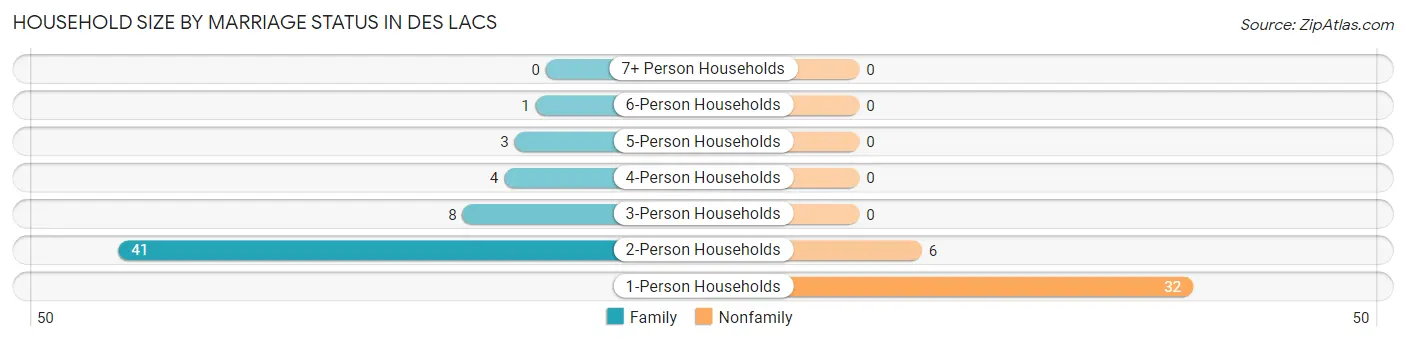
| Household Size | Family Households | Nonfamily Households |
| 1-Person Households | - | 32 (33.7%) |
| 2-Person Households | 41 (43.2%) | 6 (6.3%) |
| 3-Person Households | 8 (8.4%) | 0 (0.0%) |
| 4-Person Households | 4 (4.2%) | 0 (0.0%) |
| 5-Person Households | 3 (3.2%) | 0 (0.0%) |
| 6-Person Households | 1 (1.1%) | 0 (0.0%) |
| 7+ Person Households | 0 (0.0%) | 0 (0.0%) |
| Total | 57 (60.0%) | 38 (40.0%) |
Female Fertility in Des Lacs
Fertility by Age in Des Lacs
Average fertility rate in Des Lacs is 59.0 births per 1,000 women. Women in the age bracket of 35 to 50 years have the highest fertility rate with 182.0 births per 1,000 women. Women in the age bracket of 35 to 50 years acount for 100.0% of all women with births.
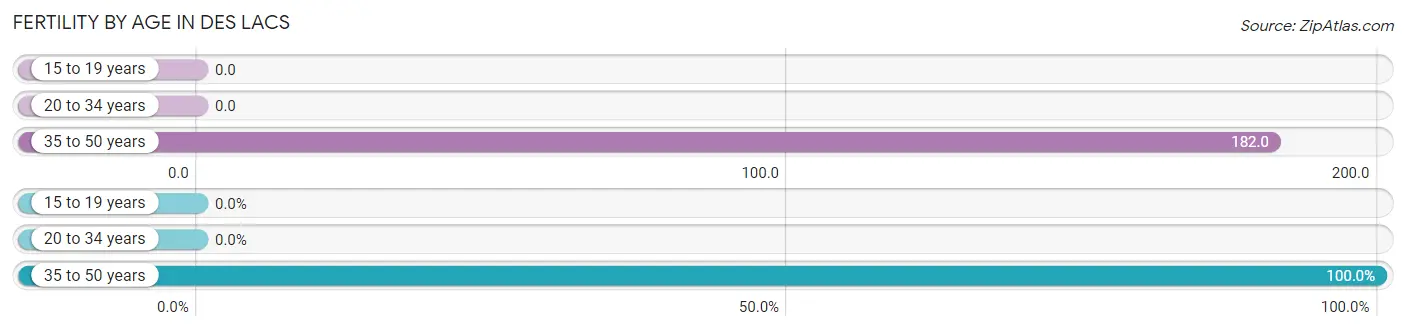
| Age Bracket | Women with Births | Births / 1,000 Women |
| 15 to 19 years | 0 (0.0%) | 0.0 |
| 20 to 34 years | 0 (0.0%) | 0.0 |
| 35 to 50 years | 2 (100.0%) | 182.0 |
| Total | 2 (100.0%) | 59.0 |
Fertility by Age by Marriage Status in Des Lacs
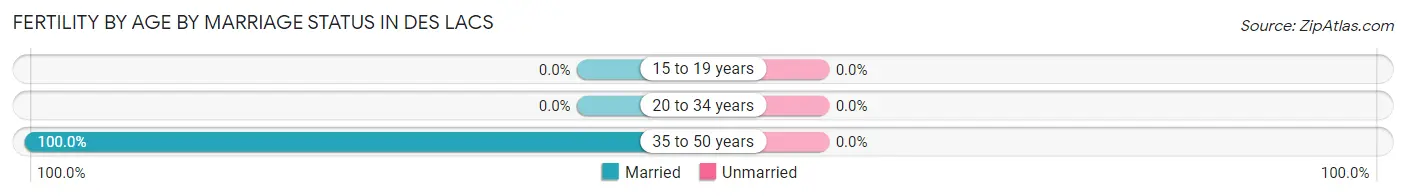
| Age Bracket | Married | Unmarried |
| 15 to 19 years | 0 (0.0%) | 0 (0.0%) |
| 20 to 34 years | 0 (0.0%) | 0 (0.0%) |
| 35 to 50 years | 2 (100.0%) | 0 (0.0%) |
| Total | 2 (100.0%) | 0 (0.0%) |
Fertility by Education in Des Lacs
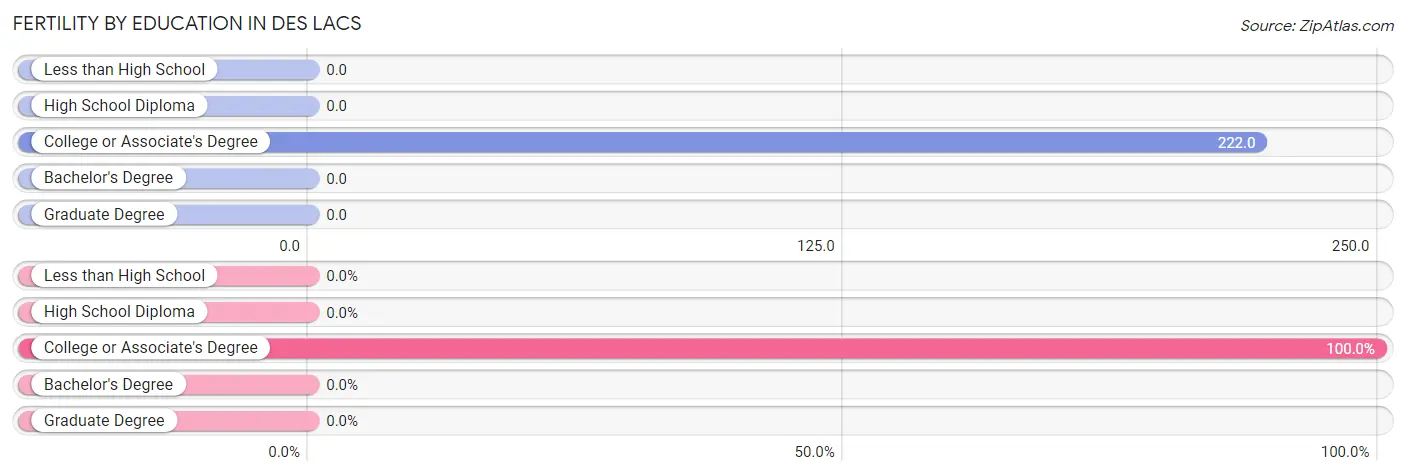
| Educational Attainment | Women with Births | Births / 1,000 Women |
| Less than High School | 0 (0.0%) | 0.0 |
| High School Diploma | 0 (0.0%) | 0.0 |
| College or Associate's Degree | 2 (100.0%) | 222.0 |
| Bachelor's Degree | 0 (0.0%) | 0.0 |
| Graduate Degree | 0 (0.0%) | 0.0 |
| Total | 2 (100.0%) | 59.0 |
Fertility by Education by Marriage Status in Des Lacs
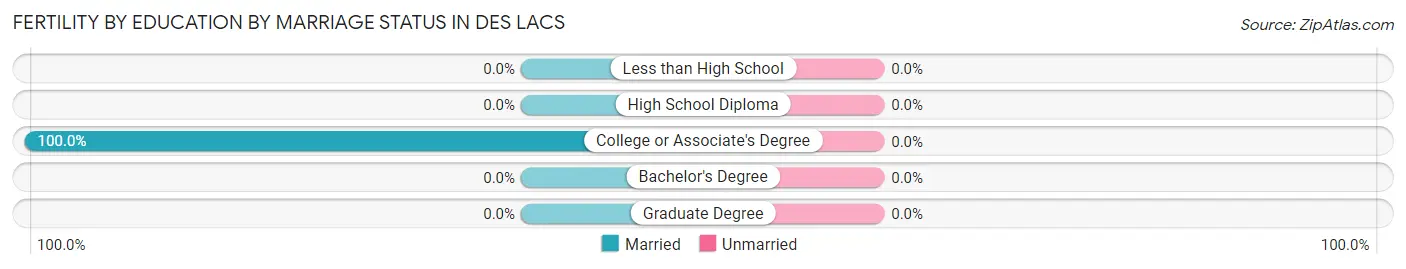
| Educational Attainment | Married | Unmarried |
| Less than High School | 0 (0.0%) | 0 (0.0%) |
| High School Diploma | 0 (0.0%) | 0 (0.0%) |
| College or Associate's Degree | 2 (100.0%) | 0 (0.0%) |
| Bachelor's Degree | 0 (0.0%) | 0 (0.0%) |
| Graduate Degree | 0 (0.0%) | 0 (0.0%) |
| Total | 2 (100.0%) | 0 (0.0%) |
Employment Characteristics in Des Lacs
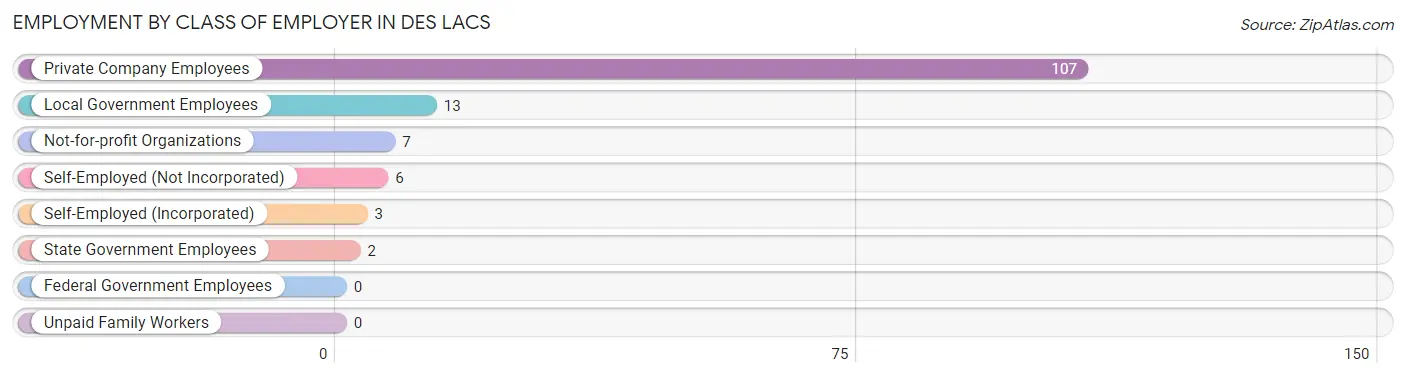
Employment by Class of Employer in Des Lacs
Among the 138 employed individuals in Des Lacs, private company employees (107 | 77.5%), local government employees (13 | 9.4%), and not-for-profit organizations (7 | 5.1%) make up the most common classes of employment.
| Employer Class | # Employees | % Employees |
| Private Company Employees | 107 | 77.5% |
| Self-Employed (Incorporated) | 3 | 2.2% |
| Self-Employed (Not Incorporated) | 6 | 4.3% |
| Not-for-profit Organizations | 7 | 5.1% |
| Local Government Employees | 13 | 9.4% |
| State Government Employees | 2 | 1.5% |
| Federal Government Employees | 0 | 0.0% |
| Unpaid Family Workers | 0 | 0.0% |
| Total | 138 | 100.0% |
Employment Status by Age in Des Lacs
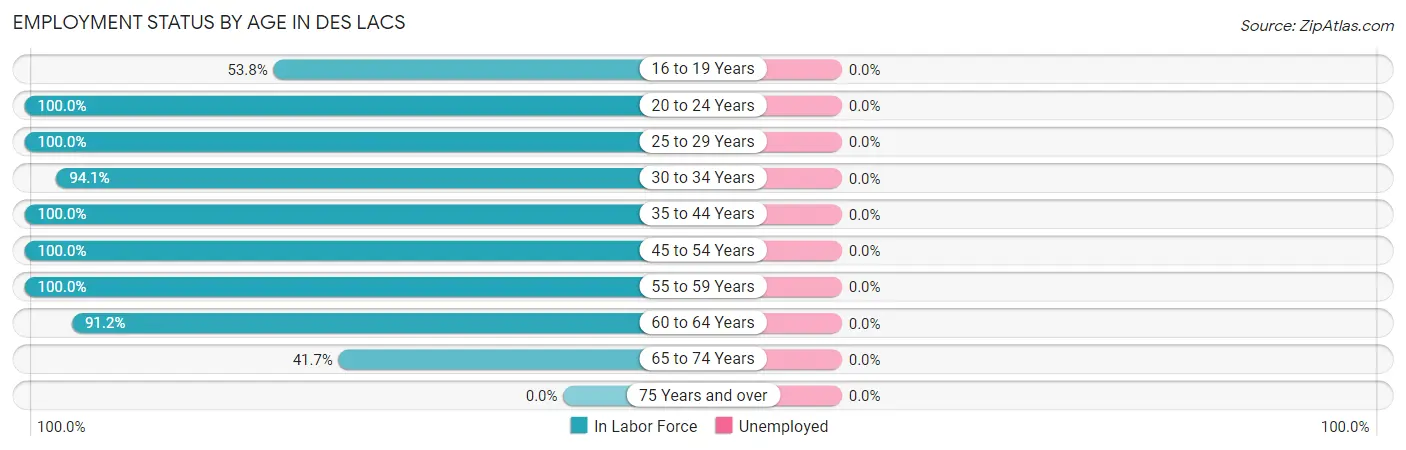
| Age Bracket | In Labor Force | Unemployed |
| 16 to 19 Years | 7 (53.8%) | 0 (0.0%) |
| 20 to 24 Years | 15 (100.0%) | 0 (0.0%) |
| 25 to 29 Years | 5 (100.0%) | 0 (0.0%) |
| 30 to 34 Years | 16 (94.1%) | 0 (0.0%) |
| 35 to 44 Years | 21 (100.0%) | 0 (0.0%) |
| 45 to 54 Years | 15 (100.0%) | 0 (0.0%) |
| 55 to 59 Years | 18 (100.0%) | 0 (0.0%) |
| 60 to 64 Years | 31 (91.2%) | 0 (0.0%) |
| 65 to 74 Years | 10 (41.7%) | 0 (0.0%) |
| 75 Years and over | 0 (0.0%) | 0 (0.0%) |
| Total | 138 (81.2%) | 0 (0.0%) |
Employment Status by Educational Attainment in Des Lacs
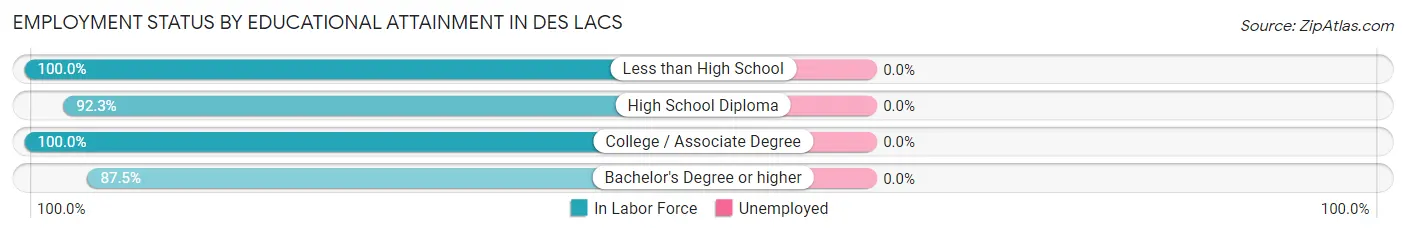
| Educational Attainment | In Labor Force | Unemployed |
| Less than High School | 21 (100.0%) | 0 (0.0%) |
| High School Diploma | 24 (92.3%) | 0 (0.0%) |
| College / Associate Degree | 47 (100.0%) | 0 (0.0%) |
| Bachelor's Degree or higher | 14 (87.5%) | 0 (0.0%) |
| Total | 106 (96.4%) | 0 (0.0%) |
Employment Occupations by Sex in Des Lacs
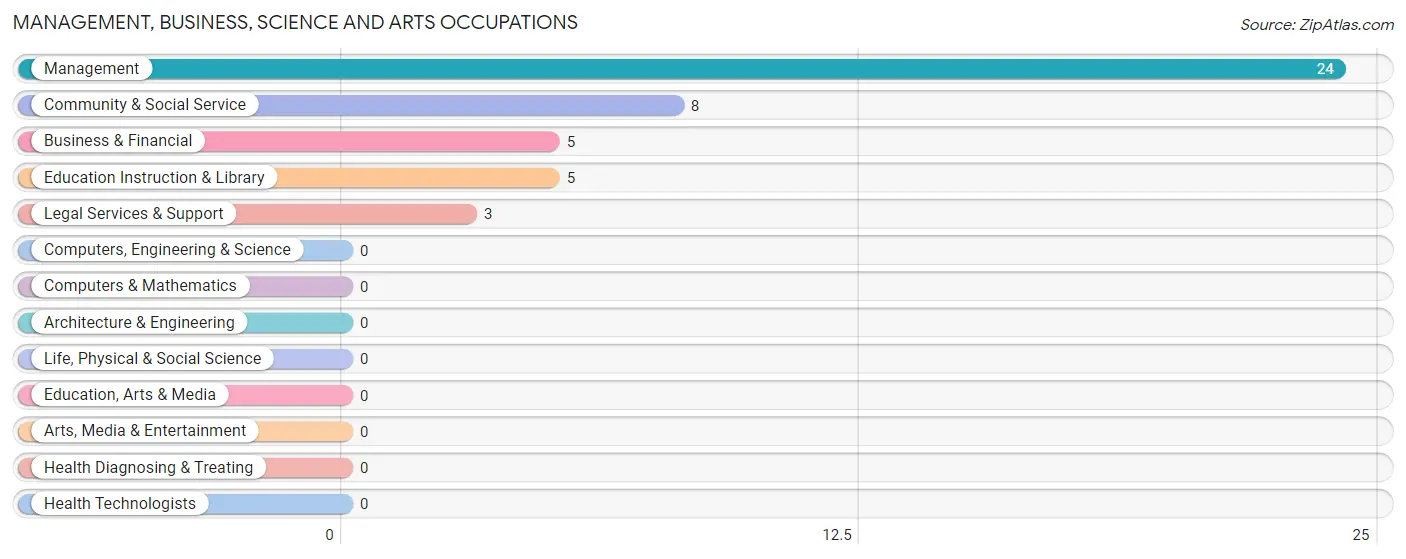
Management, Business, Science and Arts Occupations
The most common Management, Business, Science and Arts occupations in Des Lacs are Management (24 | 17.4%), Community & Social Service (8 | 5.8%), Business & Financial (5 | 3.6%), Education Instruction & Library (5 | 3.6%), and Legal Services & Support (3 | 2.2%).
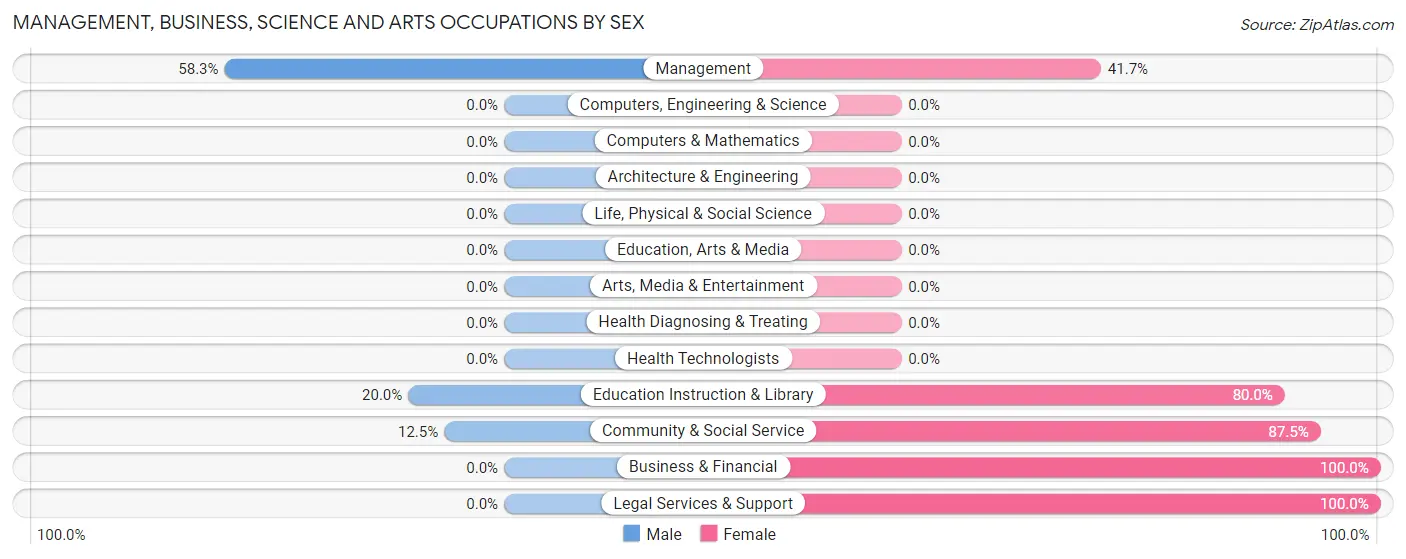
Management, Business, Science and Arts Occupations by Sex
Within the Management, Business, Science and Arts occupations in Des Lacs, the most male-oriented occupations are Management (58.3%), Education Instruction & Library (20.0%), and Community & Social Service (12.5%), while the most female-oriented occupations are Business & Financial (100.0%), Legal Services & Support (100.0%), and Community & Social Service (87.5%).
| Occupation | Male | Female |
| Management | 14 (58.3%) | 10 (41.7%) |
| Business & Financial | 0 (0.0%) | 5 (100.0%) |
| Computers, Engineering & Science | 0 (0.0%) | 0 (0.0%) |
| Computers & Mathematics | 0 (0.0%) | 0 (0.0%) |
| Architecture & Engineering | 0 (0.0%) | 0 (0.0%) |
| Life, Physical & Social Science | 0 (0.0%) | 0 (0.0%) |
| Community & Social Service | 1 (12.5%) | 7 (87.5%) |
| Education, Arts & Media | 0 (0.0%) | 0 (0.0%) |
| Legal Services & Support | 0 (0.0%) | 3 (100.0%) |
| Education Instruction & Library | 1 (20.0%) | 4 (80.0%) |
| Arts, Media & Entertainment | 0 (0.0%) | 0 (0.0%) |
| Health Diagnosing & Treating | 0 (0.0%) | 0 (0.0%) |
| Health Technologists | 0 (0.0%) | 0 (0.0%) |
| Total (Category) | 15 (40.5%) | 22 (59.5%) |
| Total (Overall) | 88 (63.8%) | 50 (36.2%) |
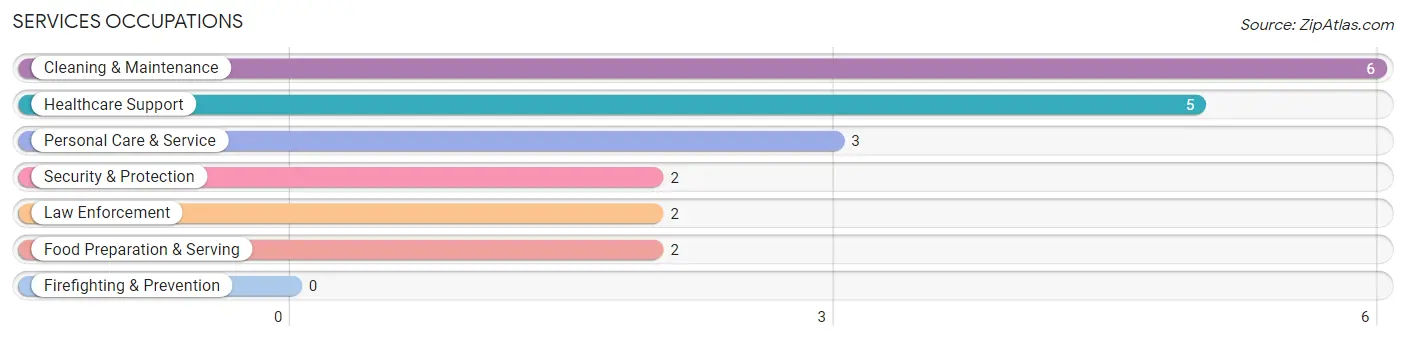
Services Occupations
The most common Services occupations in Des Lacs are Cleaning & Maintenance (6 | 4.3%), Healthcare Support (5 | 3.6%), Personal Care & Service (3 | 2.2%), Security & Protection (2 | 1.5%), and Law Enforcement (2 | 1.5%).
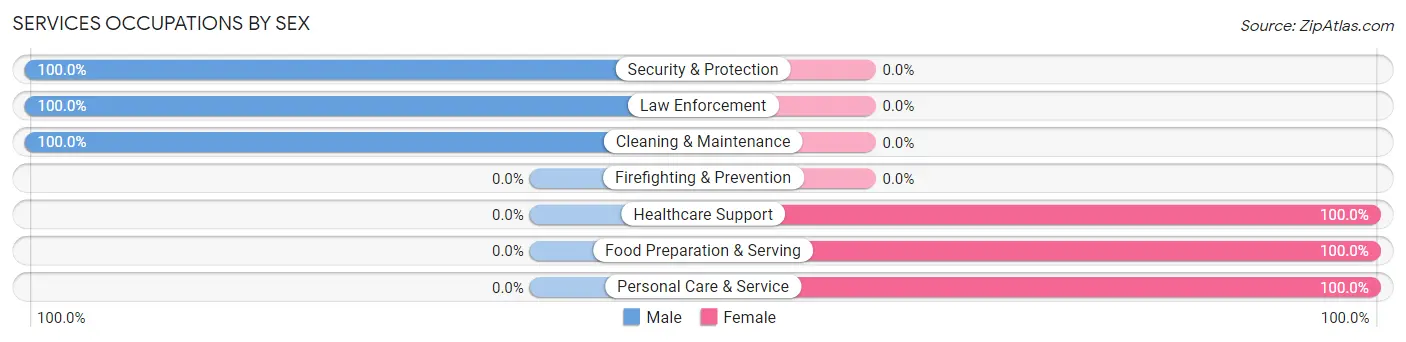
Services Occupations by Sex
Within the Services occupations in Des Lacs, the most male-oriented occupations are Security & Protection (100.0%), Law Enforcement (100.0%), and Cleaning & Maintenance (100.0%), while the most female-oriented occupations are Healthcare Support (100.0%), Food Preparation & Serving (100.0%), and Personal Care & Service (100.0%).
| Occupation | Male | Female |
| Healthcare Support | 0 (0.0%) | 5 (100.0%) |
| Security & Protection | 2 (100.0%) | 0 (0.0%) |
| Firefighting & Prevention | 0 (0.0%) | 0 (0.0%) |
| Law Enforcement | 2 (100.0%) | 0 (0.0%) |
| Food Preparation & Serving | 0 (0.0%) | 2 (100.0%) |
| Cleaning & Maintenance | 6 (100.0%) | 0 (0.0%) |
| Personal Care & Service | 0 (0.0%) | 3 (100.0%) |
| Total (Category) | 8 (44.4%) | 10 (55.6%) |
| Total (Overall) | 88 (63.8%) | 50 (36.2%) |
Sales and Office Occupations
The most common Sales and Office occupations in Des Lacs are Office & Administration (15 | 10.9%), and Sales & Related (12 | 8.7%).
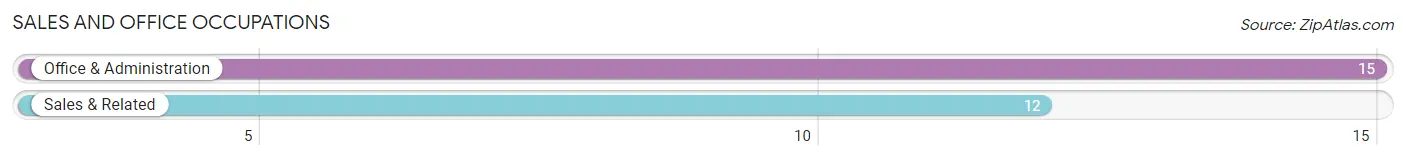
Sales and Office Occupations by Sex

| Occupation | Male | Female |
| Sales & Related | 9 (75.0%) | 3 (25.0%) |
| Office & Administration | 0 (0.0%) | 15 (100.0%) |
| Total (Category) | 9 (33.3%) | 18 (66.7%) |
| Total (Overall) | 88 (63.8%) | 50 (36.2%) |
Natural Resources, Construction and Maintenance Occupations
The most common Natural Resources, Construction and Maintenance occupations in Des Lacs are Construction & Extraction (33 | 23.9%), Installation, Maintenance & Repair (3 | 2.2%), and Farming, Fishing & Forestry (2 | 1.5%).
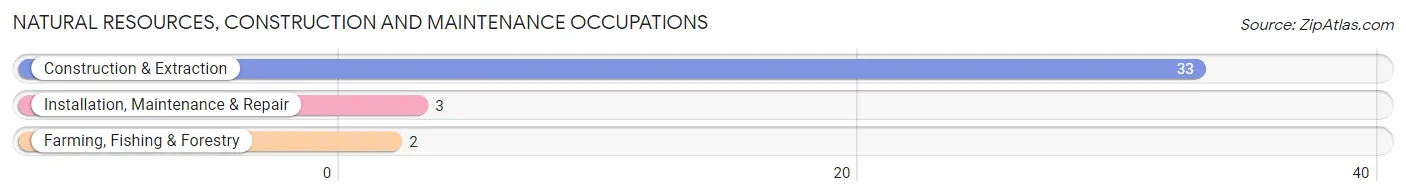
Natural Resources, Construction and Maintenance Occupations by Sex
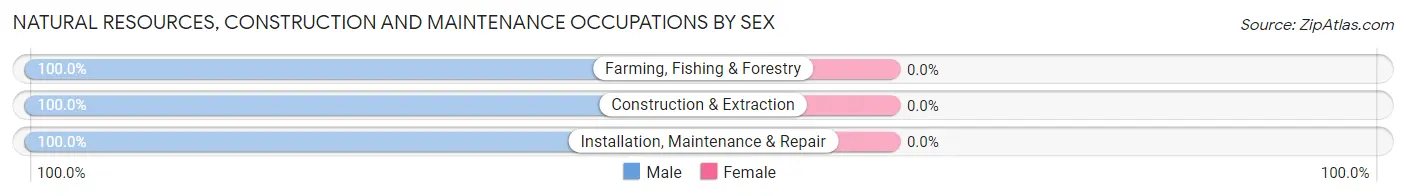
| Occupation | Male | Female |
| Farming, Fishing & Forestry | 2 (100.0%) | 0 (0.0%) |
| Construction & Extraction | 33 (100.0%) | 0 (0.0%) |
| Installation, Maintenance & Repair | 3 (100.0%) | 0 (0.0%) |
| Total (Category) | 38 (100.0%) | 0 (0.0%) |
| Total (Overall) | 88 (63.8%) | 50 (36.2%) |
Production, Transportation and Moving Occupations
The most common Production, Transportation and Moving occupations in Des Lacs are Production (10 | 7.2%), Material Moving (5 | 3.6%), and Transportation (3 | 2.2%).
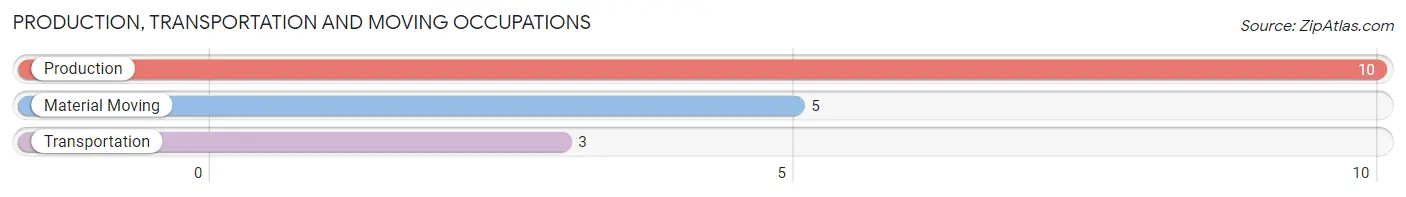
Production, Transportation and Moving Occupations by Sex
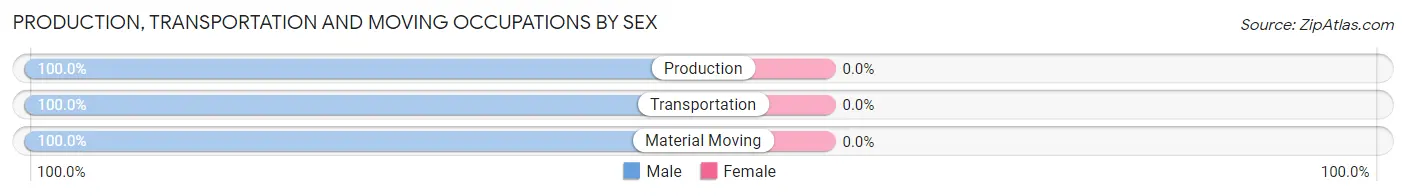
| Occupation | Male | Female |
| Production | 10 (100.0%) | 0 (0.0%) |
| Transportation | 3 (100.0%) | 0 (0.0%) |
| Material Moving | 5 (100.0%) | 0 (0.0%) |
| Total (Category) | 18 (100.0%) | 0 (0.0%) |
| Total (Overall) | 88 (63.8%) | 50 (36.2%) |
Employment Industries by Sex in Des Lacs
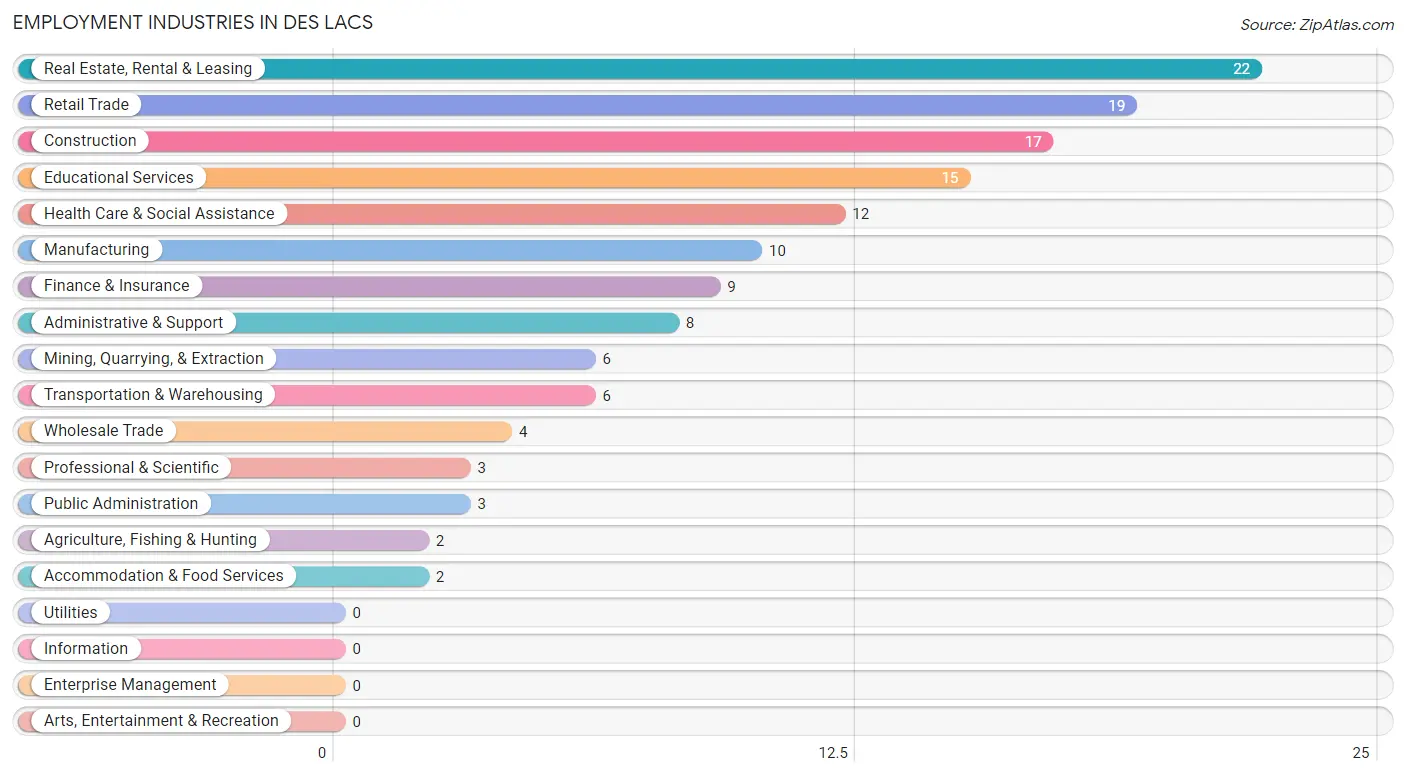
Employment Industries in Des Lacs
The major employment industries in Des Lacs include Real Estate, Rental & Leasing (22 | 15.9%), Retail Trade (19 | 13.8%), Construction (17 | 12.3%), Educational Services (15 | 10.9%), and Health Care & Social Assistance (12 | 8.7%).
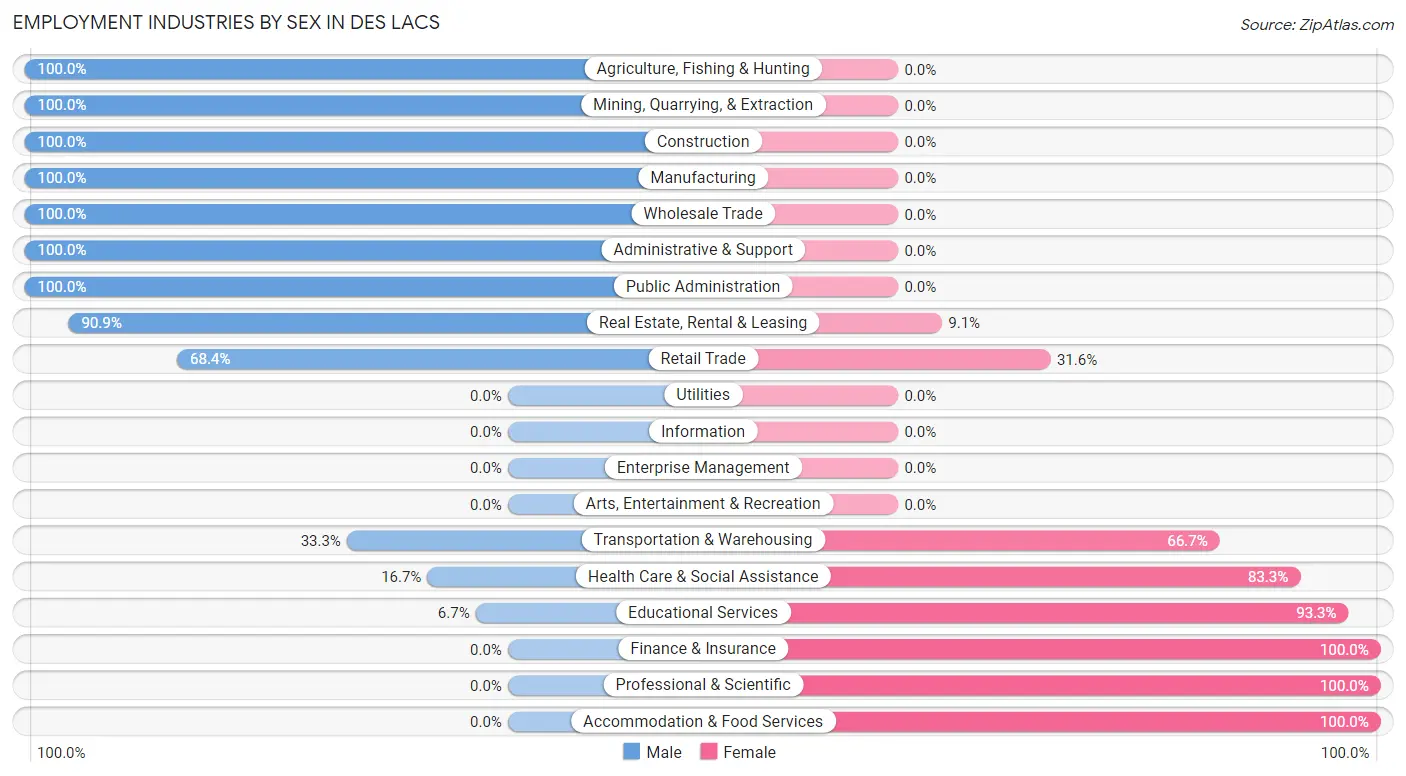
Employment Industries by Sex in Des Lacs
The Des Lacs industries that see more men than women are Agriculture, Fishing & Hunting (100.0%), Mining, Quarrying, & Extraction (100.0%), and Construction (100.0%), whereas the industries that tend to have a higher number of women are Finance & Insurance (100.0%), Professional & Scientific (100.0%), and Accommodation & Food Services (100.0%).
| Industry | Male | Female |
| Agriculture, Fishing & Hunting | 2 (100.0%) | 0 (0.0%) |
| Mining, Quarrying, & Extraction | 6 (100.0%) | 0 (0.0%) |
| Construction | 17 (100.0%) | 0 (0.0%) |
| Manufacturing | 10 (100.0%) | 0 (0.0%) |
| Wholesale Trade | 4 (100.0%) | 0 (0.0%) |
| Retail Trade | 13 (68.4%) | 6 (31.6%) |
| Transportation & Warehousing | 2 (33.3%) | 4 (66.7%) |
| Utilities | 0 (0.0%) | 0 (0.0%) |
| Information | 0 (0.0%) | 0 (0.0%) |
| Finance & Insurance | 0 (0.0%) | 9 (100.0%) |
| Real Estate, Rental & Leasing | 20 (90.9%) | 2 (9.1%) |
| Professional & Scientific | 0 (0.0%) | 3 (100.0%) |
| Enterprise Management | 0 (0.0%) | 0 (0.0%) |
| Administrative & Support | 8 (100.0%) | 0 (0.0%) |
| Educational Services | 1 (6.7%) | 14 (93.3%) |
| Health Care & Social Assistance | 2 (16.7%) | 10 (83.3%) |
| Arts, Entertainment & Recreation | 0 (0.0%) | 0 (0.0%) |
| Accommodation & Food Services | 0 (0.0%) | 2 (100.0%) |
| Public Administration | 3 (100.0%) | 0 (0.0%) |
| Total | 88 (63.8%) | 50 (36.2%) |
Education in Des Lacs
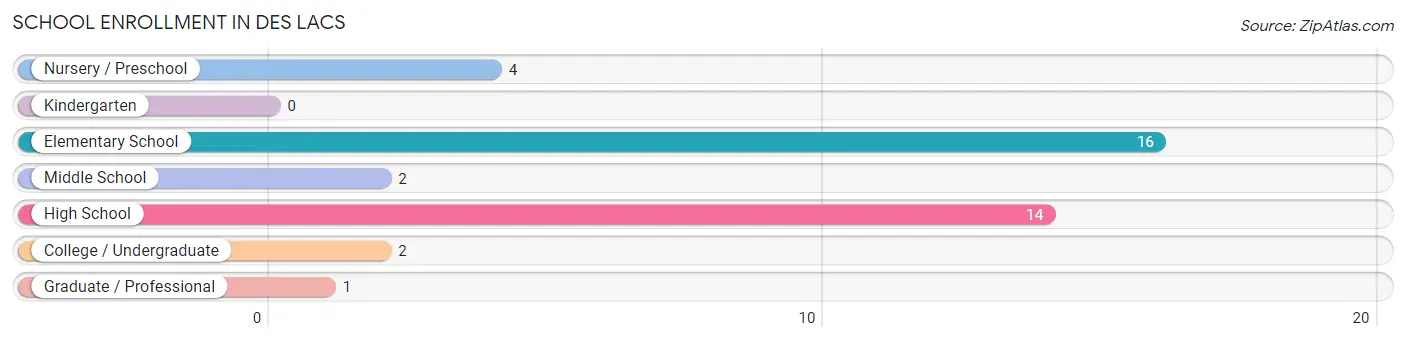
School Enrollment in Des Lacs
The most common levels of schooling among the 39 students in Des Lacs are elementary school (16 | 41.0%), high school (14 | 35.9%), and nursery / preschool (4 | 10.3%).
| School Level | # Students | % Students |
| Nursery / Preschool | 4 | 10.3% |
| Kindergarten | 0 | 0.0% |
| Elementary School | 16 | 41.0% |
| Middle School | 2 | 5.1% |
| High School | 14 | 35.9% |
| College / Undergraduate | 2 | 5.1% |
| Graduate / Professional | 1 | 2.6% |
| Total | 39 | 100.0% |
School Enrollment by Age by Funding Source in Des Lacs
Out of a total of 39 students who are enrolled in schools in Des Lacs, 1 (2.6%) attend a private institution, while the remaining 38 (97.4%) are enrolled in public schools. The age group of 35 years and over has the highest likelihood of being enrolled in private schools, with 1 (100.0% in the age bracket) enrolled. Conversely, the age group of 3 to 4 year olds has the lowest likelihood of being enrolled in a private school, with 4 (100.0% in the age bracket) attending a public institution.
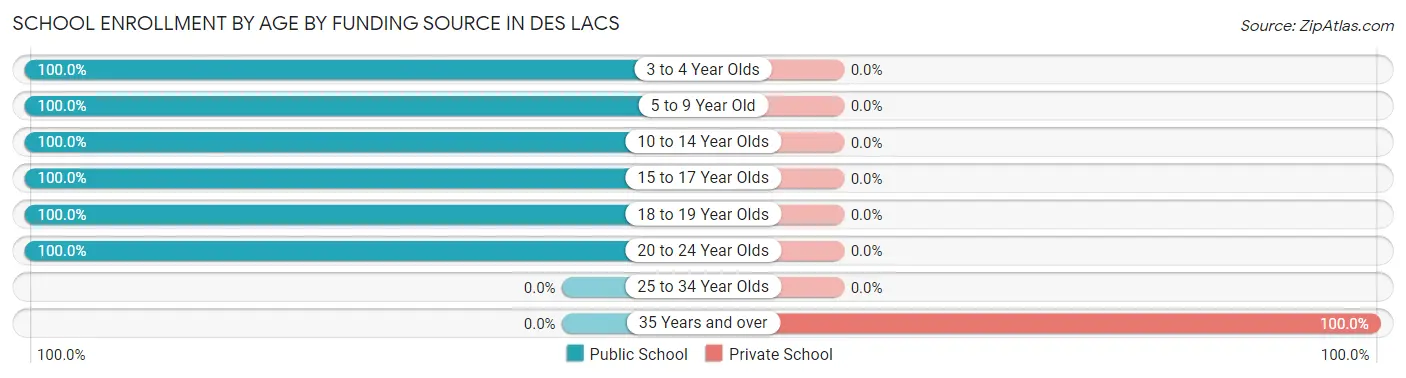
| Age Bracket | Public School | Private School |
| 3 to 4 Year Olds | 4 (100.0%) | 0 (0.0%) |
| 5 to 9 Year Old | 16 (100.0%) | 0 (0.0%) |
| 10 to 14 Year Olds | 2 (100.0%) | 0 (0.0%) |
| 15 to 17 Year Olds | 10 (100.0%) | 0 (0.0%) |
| 18 to 19 Year Olds | 4 (100.0%) | 0 (0.0%) |
| 20 to 24 Year Olds | 2 (100.0%) | 0 (0.0%) |
| 25 to 34 Year Olds | 0 (0.0%) | 0 (0.0%) |
| 35 Years and over | 0 (0.0%) | 1 (100.0%) |
| Total | 38 (97.4%) | 1 (2.6%) |
Educational Attainment by Field of Study in Des Lacs
Education (12 | 42.9%), business (5 | 17.9%), psychology (3 | 10.7%), social sciences (3 | 10.7%), and bio, nature & agricultural (2 | 7.1%) are the most common fields of study among 28 individuals in Des Lacs who have obtained a bachelor's degree or higher.
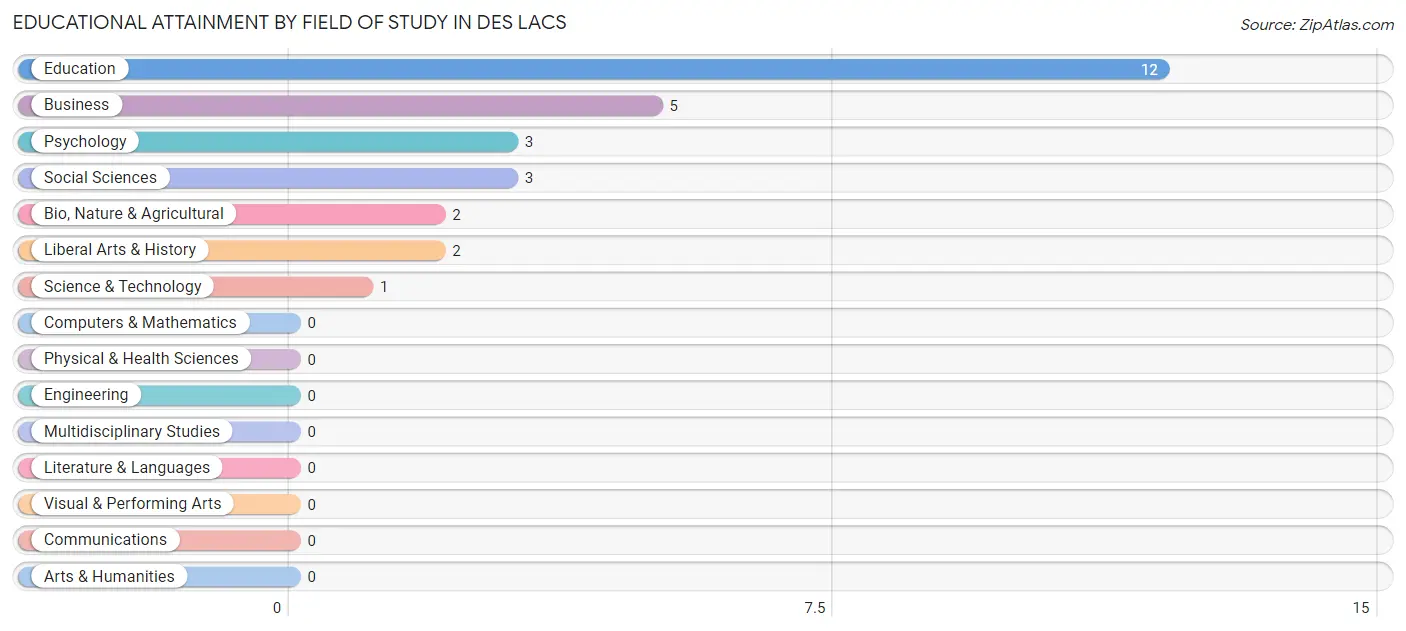
| Field of Study | # Graduates | % Graduates |
| Computers & Mathematics | 0 | 0.0% |
| Bio, Nature & Agricultural | 2 | 7.1% |
| Physical & Health Sciences | 0 | 0.0% |
| Psychology | 3 | 10.7% |
| Social Sciences | 3 | 10.7% |
| Engineering | 0 | 0.0% |
| Multidisciplinary Studies | 0 | 0.0% |
| Science & Technology | 1 | 3.6% |
| Business | 5 | 17.9% |
| Education | 12 | 42.9% |
| Literature & Languages | 0 | 0.0% |
| Liberal Arts & History | 2 | 7.1% |
| Visual & Performing Arts | 0 | 0.0% |
| Communications | 0 | 0.0% |
| Arts & Humanities | 0 | 0.0% |
| Total | 28 | 100.0% |
Transportation & Commute in Des Lacs
Vehicle Availability by Sex in Des Lacs
The most prevalent vehicle ownership categories in Des Lacs are males with 3 vehicles (37, accounting for 42.0%) and females with 3 vehicles (17, making up 74.0%).
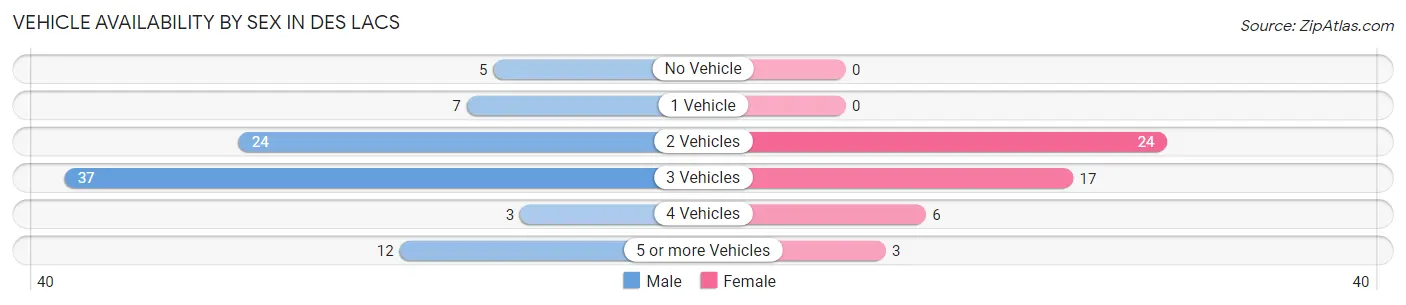
| Vehicles Available | Male | Female |
| No Vehicle | 5 (5.7%) | 0 (0.0%) |
| 1 Vehicle | 7 (8.0%) | 0 (0.0%) |
| 2 Vehicles | 24 (27.3%) | 24 (48.0%) |
| 3 Vehicles | 37 (42.0%) | 17 (34.0%) |
| 4 Vehicles | 3 (3.4%) | 6 (12.0%) |
| 5 or more Vehicles | 12 (13.6%) | 3 (6.0%) |
| Total | 88 (100.0%) | 50 (100.0%) |
Commute Time in Des Lacs
The most frequently occuring commute durations in Des Lacs are 20 to 24 minutes (58 commuters, 42.6%), 10 to 14 minutes (17 commuters, 12.5%), and 15 to 19 minutes (14 commuters, 10.3%).
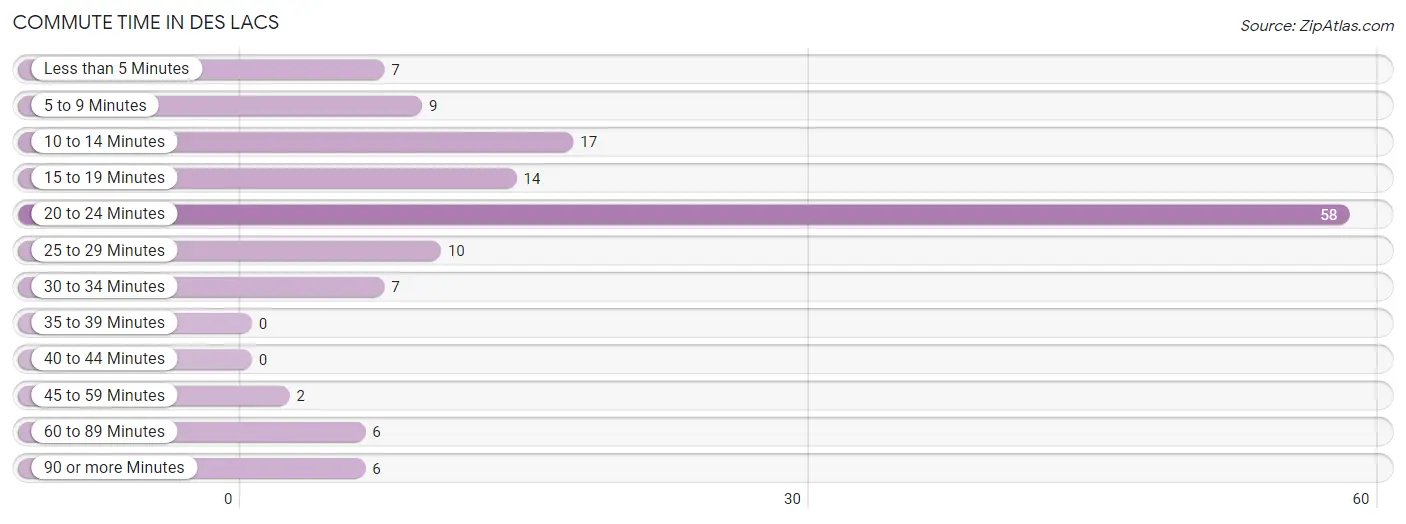
| Commute Time | # Commuters | % Commuters |
| Less than 5 Minutes | 7 | 5.1% |
| 5 to 9 Minutes | 9 | 6.6% |
| 10 to 14 Minutes | 17 | 12.5% |
| 15 to 19 Minutes | 14 | 10.3% |
| 20 to 24 Minutes | 58 | 42.6% |
| 25 to 29 Minutes | 10 | 7.3% |
| 30 to 34 Minutes | 7 | 5.1% |
| 35 to 39 Minutes | 0 | 0.0% |
| 40 to 44 Minutes | 0 | 0.0% |
| 45 to 59 Minutes | 2 | 1.5% |
| 60 to 89 Minutes | 6 | 4.4% |
| 90 or more Minutes | 6 | 4.4% |
Commute Time by Sex in Des Lacs
The most common commute times in Des Lacs are 20 to 24 minutes (42 commuters, 47.7%) for males and 20 to 24 minutes (16 commuters, 33.3%) for females.
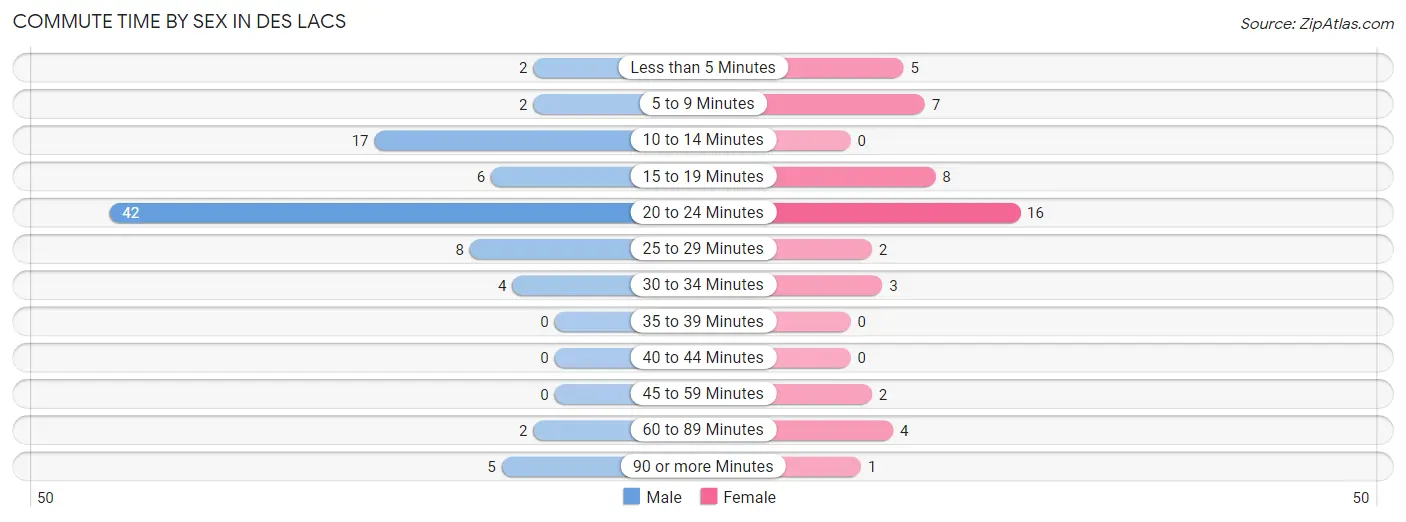
| Commute Time | Male | Female |
| Less than 5 Minutes | 2 (2.3%) | 5 (10.4%) |
| 5 to 9 Minutes | 2 (2.3%) | 7 (14.6%) |
| 10 to 14 Minutes | 17 (19.3%) | 0 (0.0%) |
| 15 to 19 Minutes | 6 (6.8%) | 8 (16.7%) |
| 20 to 24 Minutes | 42 (47.7%) | 16 (33.3%) |
| 25 to 29 Minutes | 8 (9.1%) | 2 (4.2%) |
| 30 to 34 Minutes | 4 (4.5%) | 3 (6.2%) |
| 35 to 39 Minutes | 0 (0.0%) | 0 (0.0%) |
| 40 to 44 Minutes | 0 (0.0%) | 0 (0.0%) |
| 45 to 59 Minutes | 0 (0.0%) | 2 (4.2%) |
| 60 to 89 Minutes | 2 (2.3%) | 4 (8.3%) |
| 90 or more Minutes | 5 (5.7%) | 1 (2.1%) |
Time of Departure to Work by Sex in Des Lacs
The most frequent times of departure to work in Des Lacs are 7:00 AM to 7:29 AM (34, 38.6%) for males and 6:30 AM to 6:59 AM (18, 37.5%) for females.
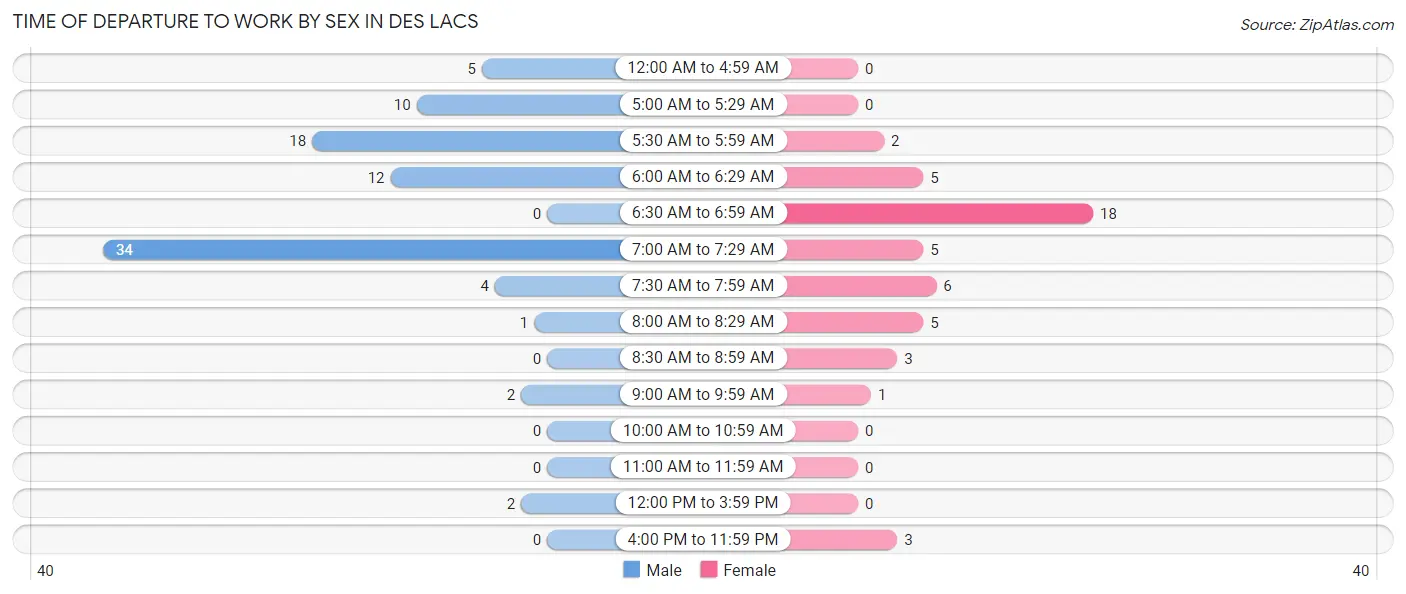
| Time of Departure | Male | Female |
| 12:00 AM to 4:59 AM | 5 (5.7%) | 0 (0.0%) |
| 5:00 AM to 5:29 AM | 10 (11.4%) | 0 (0.0%) |
| 5:30 AM to 5:59 AM | 18 (20.4%) | 2 (4.2%) |
| 6:00 AM to 6:29 AM | 12 (13.6%) | 5 (10.4%) |
| 6:30 AM to 6:59 AM | 0 (0.0%) | 18 (37.5%) |
| 7:00 AM to 7:29 AM | 34 (38.6%) | 5 (10.4%) |
| 7:30 AM to 7:59 AM | 4 (4.5%) | 6 (12.5%) |
| 8:00 AM to 8:29 AM | 1 (1.1%) | 5 (10.4%) |
| 8:30 AM to 8:59 AM | 0 (0.0%) | 3 (6.2%) |
| 9:00 AM to 9:59 AM | 2 (2.3%) | 1 (2.1%) |
| 10:00 AM to 10:59 AM | 0 (0.0%) | 0 (0.0%) |
| 11:00 AM to 11:59 AM | 0 (0.0%) | 0 (0.0%) |
| 12:00 PM to 3:59 PM | 2 (2.3%) | 0 (0.0%) |
| 4:00 PM to 11:59 PM | 0 (0.0%) | 3 (6.2%) |
| Total | 88 (100.0%) | 48 (100.0%) |
Housing Occupancy in Des Lacs
Occupancy by Ownership in Des Lacs
Of the total 95 dwellings in Des Lacs, owner-occupied units account for 89 (93.7%), while renter-occupied units make up 6 (6.3%).
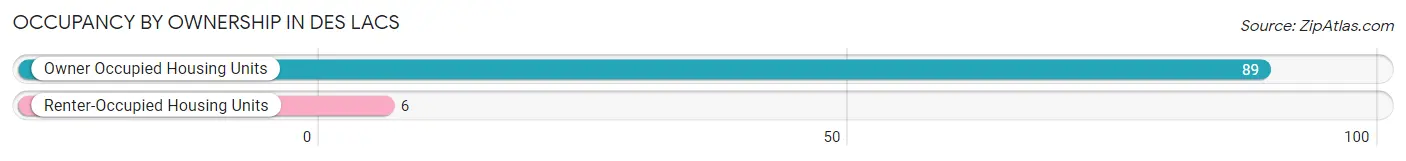
| Occupancy | # Housing Units | % Housing Units |
| Owner Occupied Housing Units | 89 | 93.7% |
| Renter-Occupied Housing Units | 6 | 6.3% |
| Total Occupied Housing Units | 95 | 100.0% |
Occupancy by Household Size in Des Lacs
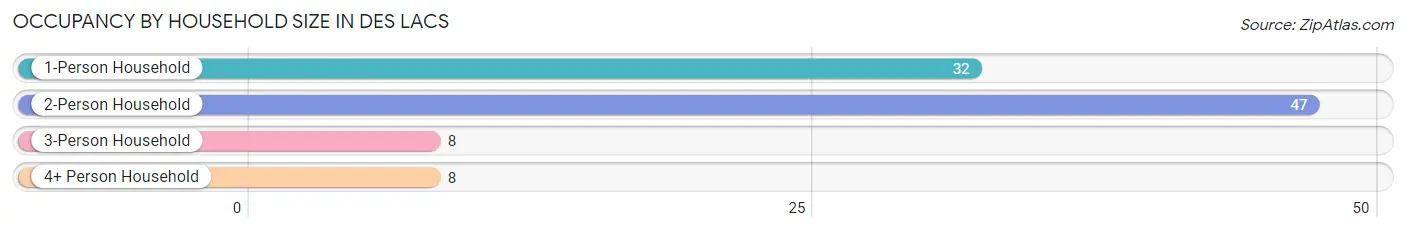
| Household Size | # Housing Units | % Housing Units |
| 1-Person Household | 32 | 33.7% |
| 2-Person Household | 47 | 49.5% |
| 3-Person Household | 8 | 8.4% |
| 4+ Person Household | 8 | 8.4% |
| Total Housing Units | 95 | 100.0% |
Occupancy by Ownership by Household Size in Des Lacs
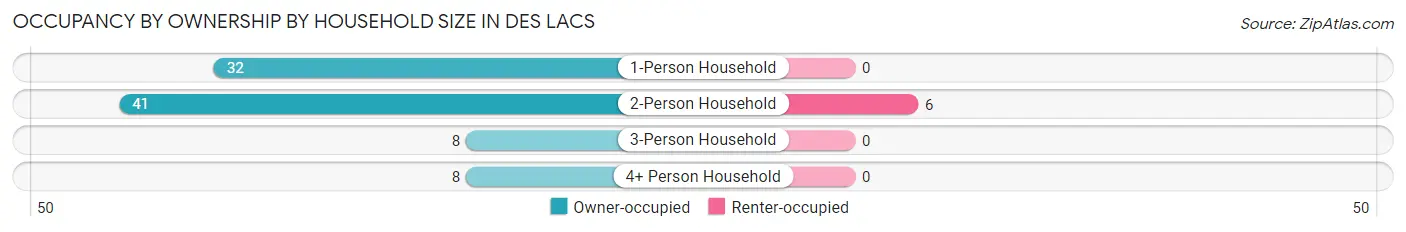
| Household Size | Owner-occupied | Renter-occupied |
| 1-Person Household | 32 (100.0%) | 0 (0.0%) |
| 2-Person Household | 41 (87.2%) | 6 (12.8%) |
| 3-Person Household | 8 (100.0%) | 0 (0.0%) |
| 4+ Person Household | 8 (100.0%) | 0 (0.0%) |
| Total Housing Units | 89 (93.7%) | 6 (6.3%) |
Occupancy by Educational Attainment in Des Lacs
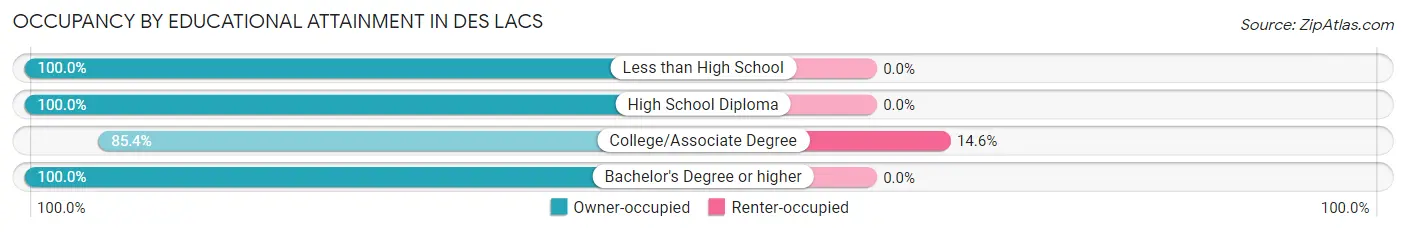
| Household Size | Owner-occupied | Renter-occupied |
| Less than High School | 20 (100.0%) | 0 (0.0%) |
| High School Diploma | 22 (100.0%) | 0 (0.0%) |
| College/Associate Degree | 35 (85.4%) | 6 (14.6%) |
| Bachelor's Degree or higher | 12 (100.0%) | 0 (0.0%) |
Occupancy by Age of Householder in Des Lacs
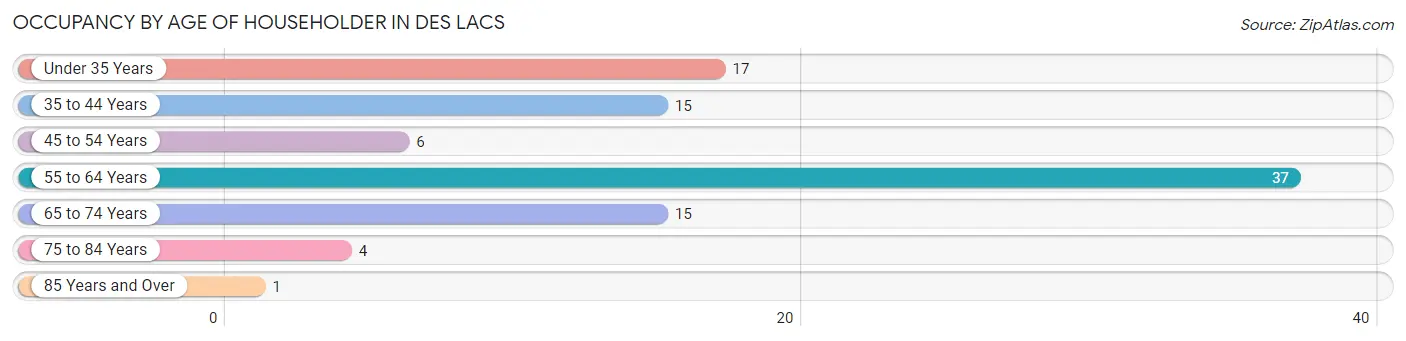
| Age Bracket | # Households | % Households |
| Under 35 Years | 17 | 17.9% |
| 35 to 44 Years | 15 | 15.8% |
| 45 to 54 Years | 6 | 6.3% |
| 55 to 64 Years | 37 | 39.0% |
| 65 to 74 Years | 15 | 15.8% |
| 75 to 84 Years | 4 | 4.2% |
| 85 Years and Over | 1 | 1.1% |
| Total | 95 | 100.0% |
Housing Finances in Des Lacs
Median Income by Occupancy in Des Lacs
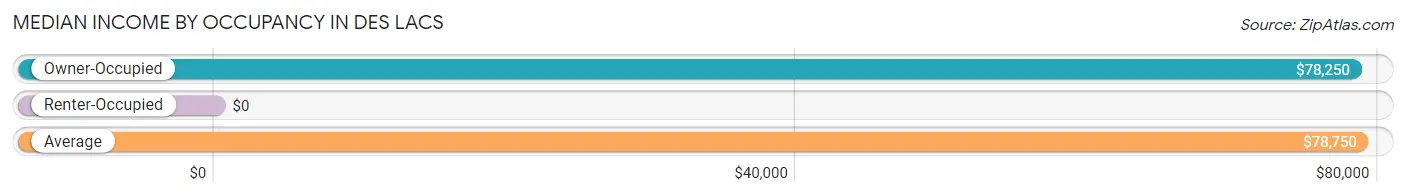
| Occupancy Type | # Households | Median Income |
| Owner-Occupied | 89 (93.7%) | $78,250 |
| Renter-Occupied | 6 (6.3%) | $0 |
| Average | 95 (100.0%) | $78,750 |
Occupancy by Householder Income Bracket in Des Lacs
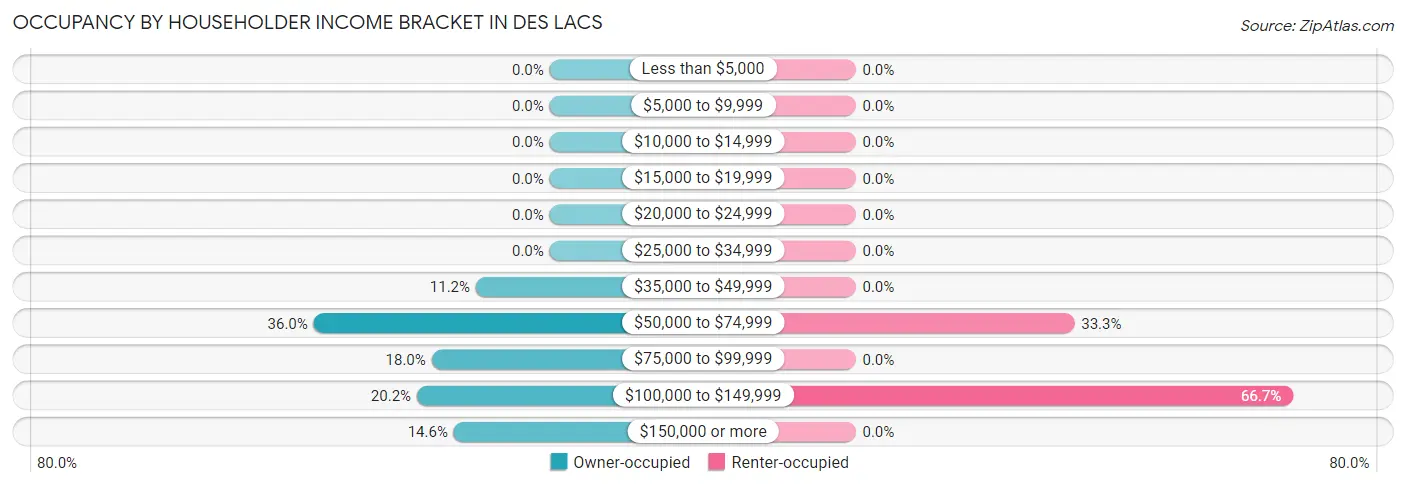
| Income Bracket | Owner-occupied | Renter-occupied |
| Less than $5,000 | 0 (0.0%) | 0 (0.0%) |
| $5,000 to $9,999 | 0 (0.0%) | 0 (0.0%) |
| $10,000 to $14,999 | 0 (0.0%) | 0 (0.0%) |
| $15,000 to $19,999 | 0 (0.0%) | 0 (0.0%) |
| $20,000 to $24,999 | 0 (0.0%) | 0 (0.0%) |
| $25,000 to $34,999 | 0 (0.0%) | 0 (0.0%) |
| $35,000 to $49,999 | 10 (11.2%) | 0 (0.0%) |
| $50,000 to $74,999 | 32 (36.0%) | 2 (33.3%) |
| $75,000 to $99,999 | 16 (18.0%) | 0 (0.0%) |
| $100,000 to $149,999 | 18 (20.2%) | 4 (66.7%) |
| $150,000 or more | 13 (14.6%) | 0 (0.0%) |
| Total | 89 (100.0%) | 6 (100.0%) |
Monthly Housing Cost Tiers in Des Lacs
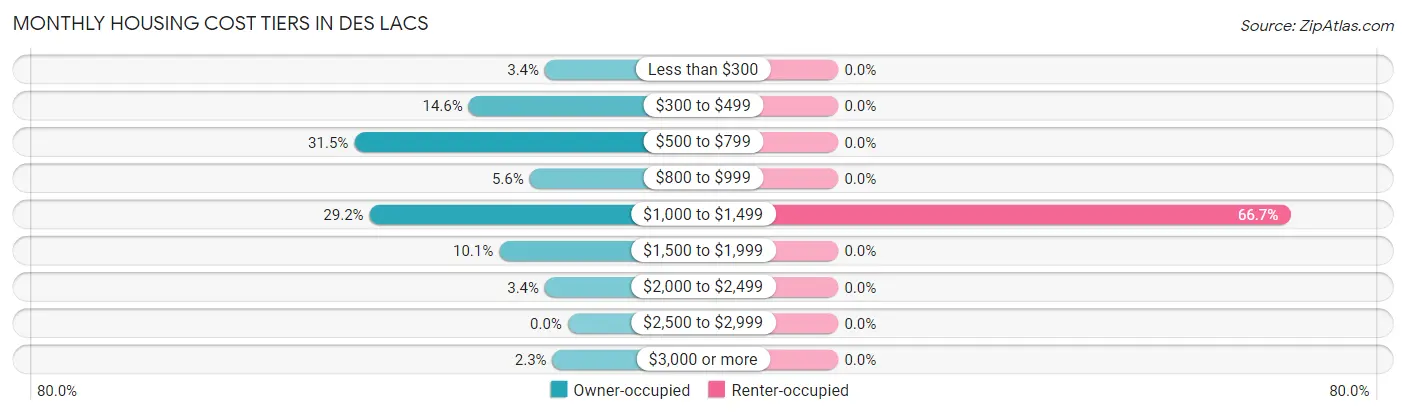
| Monthly Cost | Owner-occupied | Renter-occupied |
| Less than $300 | 3 (3.4%) | 0 (0.0%) |
| $300 to $499 | 13 (14.6%) | 0 (0.0%) |
| $500 to $799 | 28 (31.5%) | 0 (0.0%) |
| $800 to $999 | 5 (5.6%) | 0 (0.0%) |
| $1,000 to $1,499 | 26 (29.2%) | 4 (66.7%) |
| $1,500 to $1,999 | 9 (10.1%) | 0 (0.0%) |
| $2,000 to $2,499 | 3 (3.4%) | 0 (0.0%) |
| $2,500 to $2,999 | 0 (0.0%) | 0 (0.0%) |
| $3,000 or more | 2 (2.2%) | 0 (0.0%) |
| Total | 89 (100.0%) | 6 (100.0%) |
Physical Housing Characteristics in Des Lacs
Housing Structures in Des Lacs
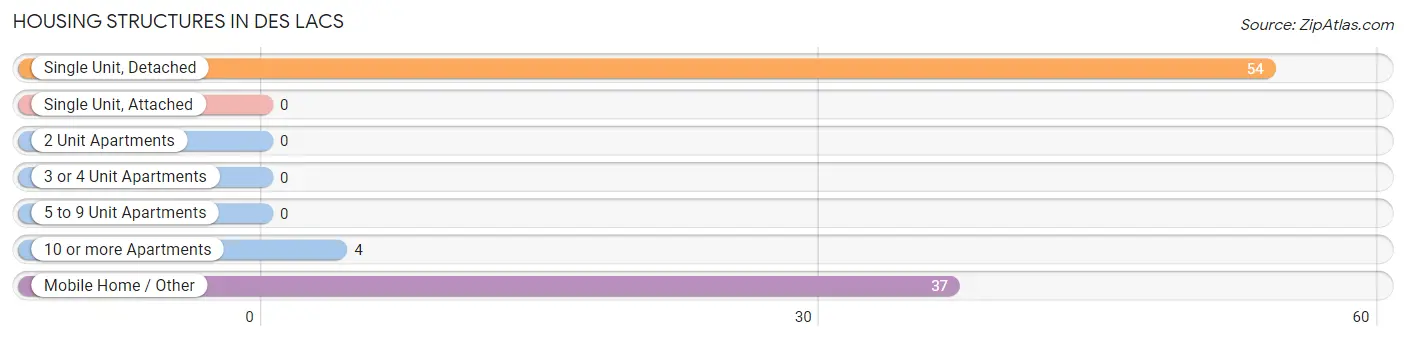
| Structure Type | # Housing Units | % Housing Units |
| Single Unit, Detached | 54 | 56.8% |
| Single Unit, Attached | 0 | 0.0% |
| 2 Unit Apartments | 0 | 0.0% |
| 3 or 4 Unit Apartments | 0 | 0.0% |
| 5 to 9 Unit Apartments | 0 | 0.0% |
| 10 or more Apartments | 4 | 4.2% |
| Mobile Home / Other | 37 | 39.0% |
| Total | 95 | 100.0% |
Housing Structures by Occupancy in Des Lacs
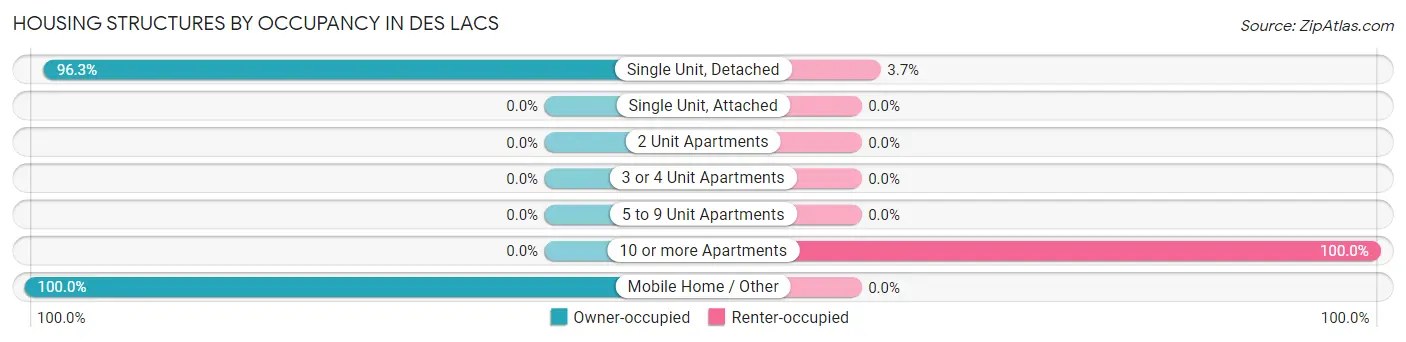
| Structure Type | Owner-occupied | Renter-occupied |
| Single Unit, Detached | 52 (96.3%) | 2 (3.7%) |
| Single Unit, Attached | 0 (0.0%) | 0 (0.0%) |
| 2 Unit Apartments | 0 (0.0%) | 0 (0.0%) |
| 3 or 4 Unit Apartments | 0 (0.0%) | 0 (0.0%) |
| 5 to 9 Unit Apartments | 0 (0.0%) | 0 (0.0%) |
| 10 or more Apartments | 0 (0.0%) | 4 (100.0%) |
| Mobile Home / Other | 37 (100.0%) | 0 (0.0%) |
| Total | 89 (93.7%) | 6 (6.3%) |
Housing Structures by Number of Rooms in Des Lacs
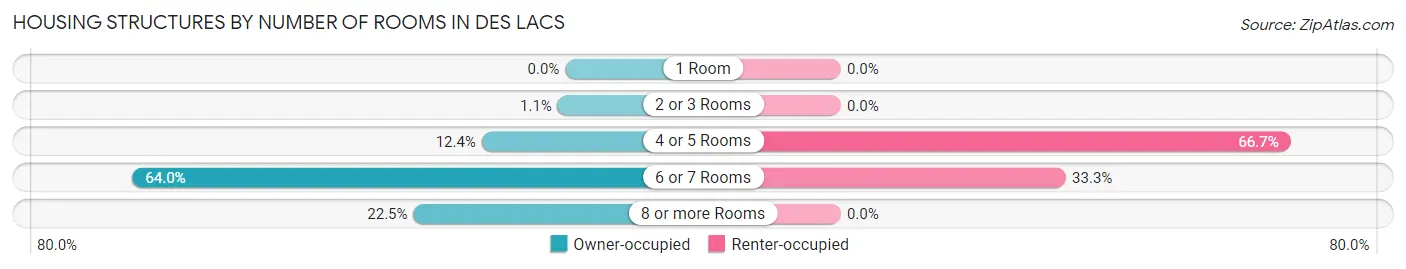
| Number of Rooms | Owner-occupied | Renter-occupied |
| 1 Room | 0 (0.0%) | 0 (0.0%) |
| 2 or 3 Rooms | 1 (1.1%) | 0 (0.0%) |
| 4 or 5 Rooms | 11 (12.4%) | 4 (66.7%) |
| 6 or 7 Rooms | 57 (64.0%) | 2 (33.3%) |
| 8 or more Rooms | 20 (22.5%) | 0 (0.0%) |
| Total | 89 (100.0%) | 6 (100.0%) |
Housing Structure by Heating Type in Des Lacs
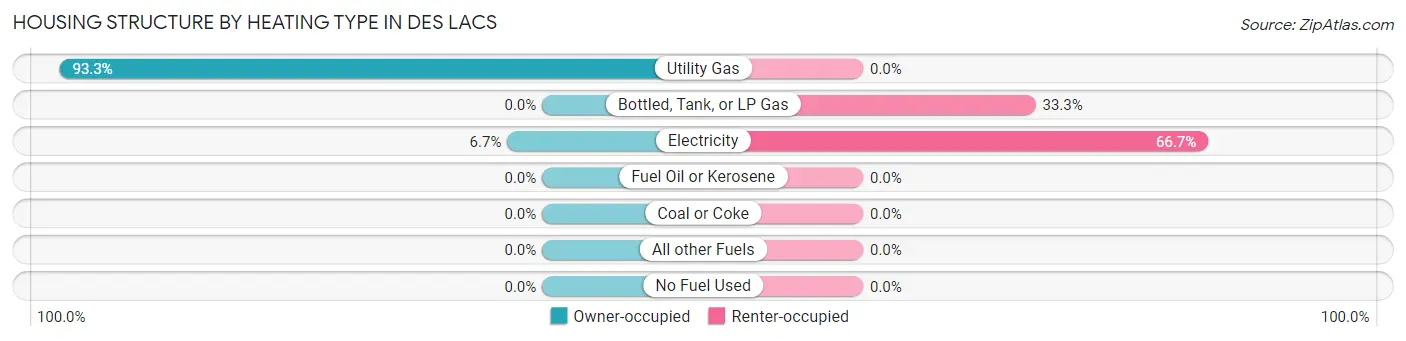
| Heating Type | Owner-occupied | Renter-occupied |
| Utility Gas | 83 (93.3%) | 0 (0.0%) |
| Bottled, Tank, or LP Gas | 0 (0.0%) | 2 (33.3%) |
| Electricity | 6 (6.7%) | 4 (66.7%) |
| Fuel Oil or Kerosene | 0 (0.0%) | 0 (0.0%) |
| Coal or Coke | 0 (0.0%) | 0 (0.0%) |
| All other Fuels | 0 (0.0%) | 0 (0.0%) |
| No Fuel Used | 0 (0.0%) | 0 (0.0%) |
| Total | 89 (100.0%) | 6 (100.0%) |
Household Vehicle Usage in Des Lacs
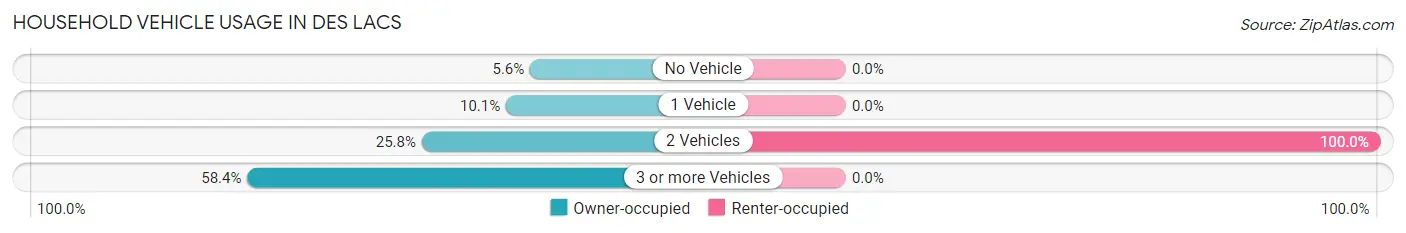
| Vehicles per Household | Owner-occupied | Renter-occupied |
| No Vehicle | 5 (5.6%) | 0 (0.0%) |
| 1 Vehicle | 9 (10.1%) | 0 (0.0%) |
| 2 Vehicles | 23 (25.8%) | 6 (100.0%) |
| 3 or more Vehicles | 52 (58.4%) | 0 (0.0%) |
| Total | 89 (100.0%) | 6 (100.0%) |
Real Estate & Mortgages in Des Lacs
Real Estate and Mortgage Overview in Des Lacs
| Characteristic | Without Mortgage | With Mortgage |
| Housing Units | 24 | 65 |
| Median Property Value | $156,300 | $117,000 |
| Median Household Income | $88,750 | $11 |
| Monthly Housing Costs | $467 | $0 |
| Real Estate Taxes | $1,188 | $0 |
Property Value by Mortgage Status in Des Lacs
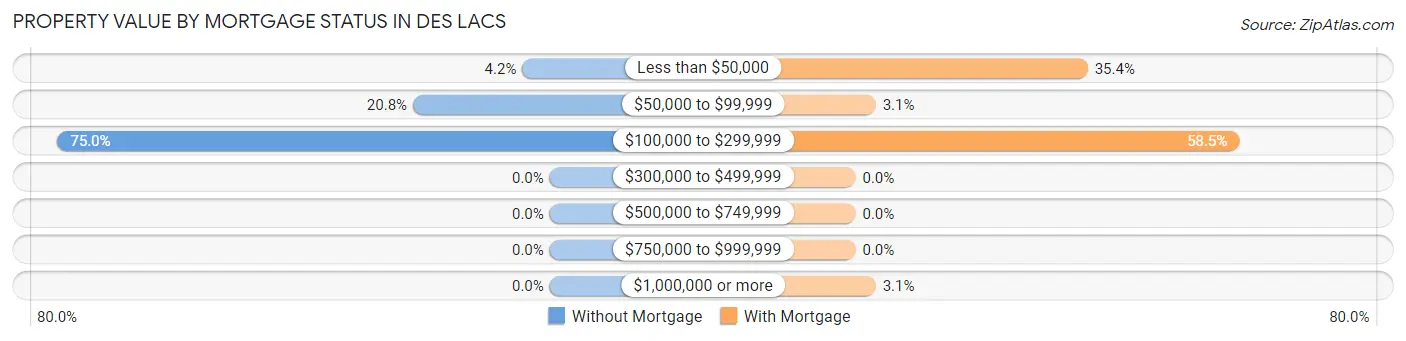
| Property Value | Without Mortgage | With Mortgage |
| Less than $50,000 | 1 (4.2%) | 23 (35.4%) |
| $50,000 to $99,999 | 5 (20.8%) | 2 (3.1%) |
| $100,000 to $299,999 | 18 (75.0%) | 38 (58.5%) |
| $300,000 to $499,999 | 0 (0.0%) | 0 (0.0%) |
| $500,000 to $749,999 | 0 (0.0%) | 0 (0.0%) |
| $750,000 to $999,999 | 0 (0.0%) | 0 (0.0%) |
| $1,000,000 or more | 0 (0.0%) | 2 (3.1%) |
| Total | 24 (100.0%) | 65 (100.0%) |
Household Income by Mortgage Status in Des Lacs
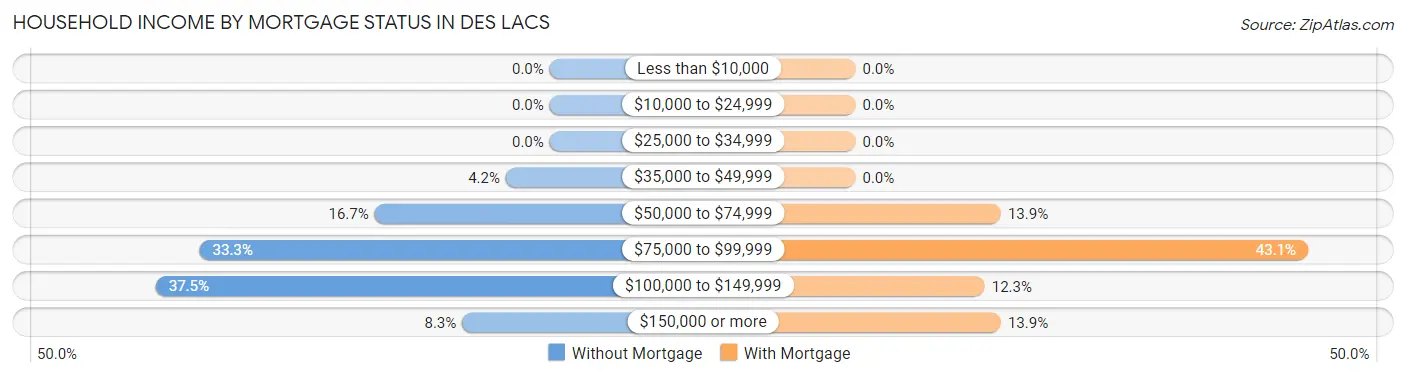
| Household Income | Without Mortgage | With Mortgage |
| Less than $10,000 | 0 (0.0%) | 0 (0.0%) |
| $10,000 to $24,999 | 0 (0.0%) | 0 (0.0%) |
| $25,000 to $34,999 | 0 (0.0%) | 0 (0.0%) |
| $35,000 to $49,999 | 1 (4.2%) | 0 (0.0%) |
| $50,000 to $74,999 | 4 (16.7%) | 9 (13.9%) |
| $75,000 to $99,999 | 8 (33.3%) | 28 (43.1%) |
| $100,000 to $149,999 | 9 (37.5%) | 8 (12.3%) |
| $150,000 or more | 2 (8.3%) | 9 (13.9%) |
| Total | 24 (100.0%) | 65 (100.0%) |
Property Value to Household Income Ratio in Des Lacs
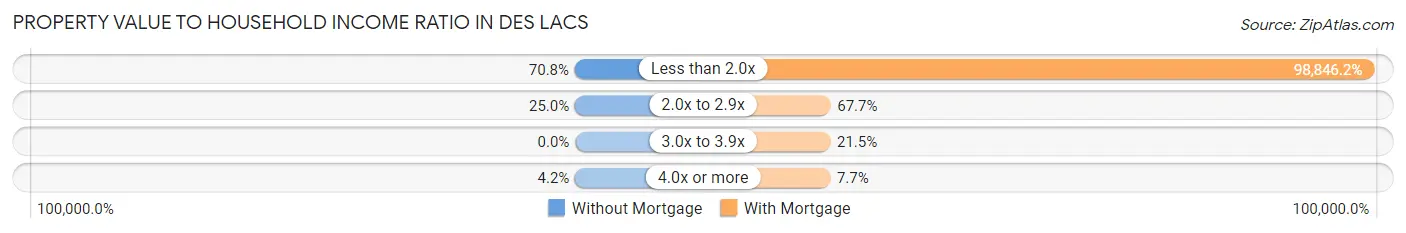
| Value-to-Income Ratio | Without Mortgage | With Mortgage |
| Less than 2.0x | 17 (70.8%) | 64,250 (98,846.2%) |
| 2.0x to 2.9x | 6 (25.0%) | 44 (67.7%) |
| 3.0x to 3.9x | 0 (0.0%) | 14 (21.5%) |
| 4.0x or more | 1 (4.2%) | 5 (7.7%) |
| Total | 24 (100.0%) | 65 (100.0%) |
Real Estate Taxes by Mortgage Status in Des Lacs
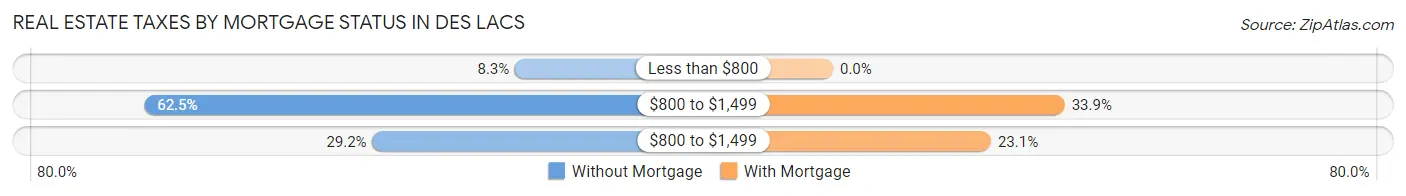
| Property Taxes | Without Mortgage | With Mortgage |
| Less than $800 | 2 (8.3%) | 0 (0.0%) |
| $800 to $1,499 | 15 (62.5%) | 22 (33.9%) |
| $800 to $1,499 | 7 (29.2%) | 15 (23.1%) |
| Total | 24 (100.0%) | 65 (100.0%) |
Health & Disability in Des Lacs
Health Insurance Coverage by Age in Des Lacs
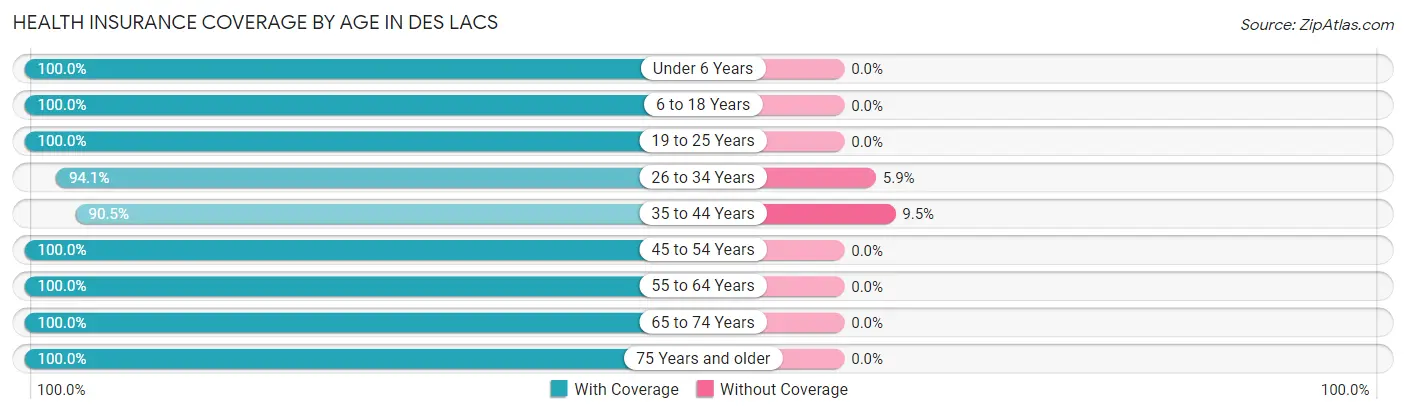
| Age Bracket | With Coverage | Without Coverage |
| Under 6 Years | 10 (100.0%) | 0 (0.0%) |
| 6 to 18 Years | 29 (100.0%) | 0 (0.0%) |
| 19 to 25 Years | 24 (100.0%) | 0 (0.0%) |
| 26 to 34 Years | 16 (94.1%) | 1 (5.9%) |
| 35 to 44 Years | 19 (90.5%) | 2 (9.5%) |
| 45 to 54 Years | 15 (100.0%) | 0 (0.0%) |
| 55 to 64 Years | 52 (100.0%) | 0 (0.0%) |
| 65 to 74 Years | 24 (100.0%) | 0 (0.0%) |
| 75 Years and older | 8 (100.0%) | 0 (0.0%) |
| Total | 197 (98.5%) | 3 (1.5%) |
Health Insurance Coverage by Citizenship Status in Des Lacs
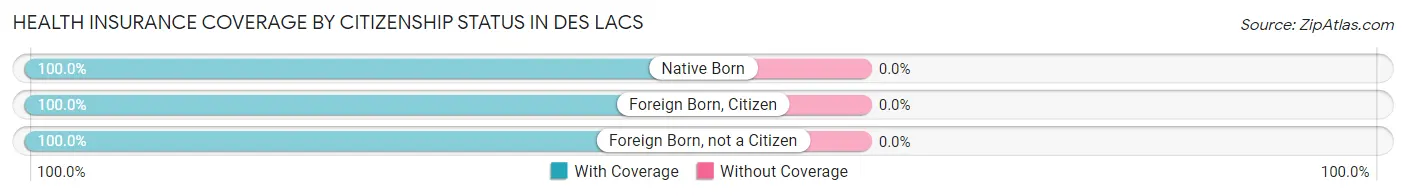
| Citizenship Status | With Coverage | Without Coverage |
| Native Born | 10 (100.0%) | 0 (0.0%) |
| Foreign Born, Citizen | 29 (100.0%) | 0 (0.0%) |
| Foreign Born, not a Citizen | 24 (100.0%) | 0 (0.0%) |
Health Insurance Coverage by Household Income in Des Lacs
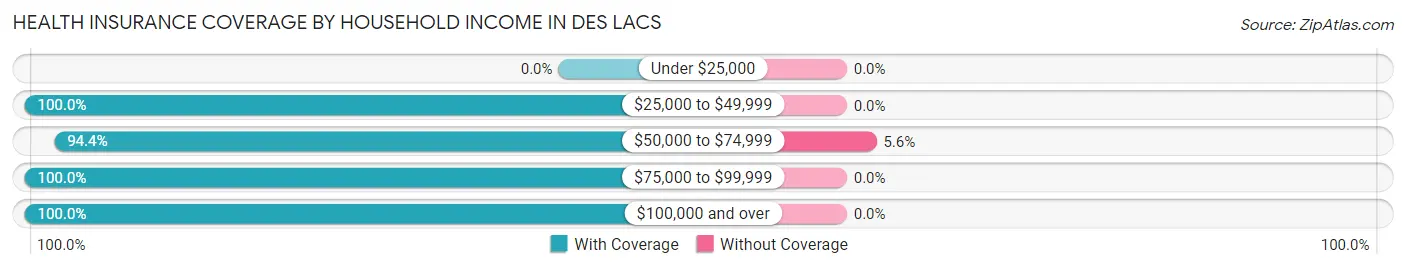
| Household Income | With Coverage | Without Coverage |
| Under $25,000 | 0 (0.0%) | 0 (0.0%) |
| $25,000 to $49,999 | 12 (100.0%) | 0 (0.0%) |
| $50,000 to $74,999 | 51 (94.4%) | 3 (5.6%) |
| $75,000 to $99,999 | 28 (100.0%) | 0 (0.0%) |
| $100,000 and over | 106 (100.0%) | 0 (0.0%) |
Public vs Private Health Insurance Coverage by Age in Des Lacs
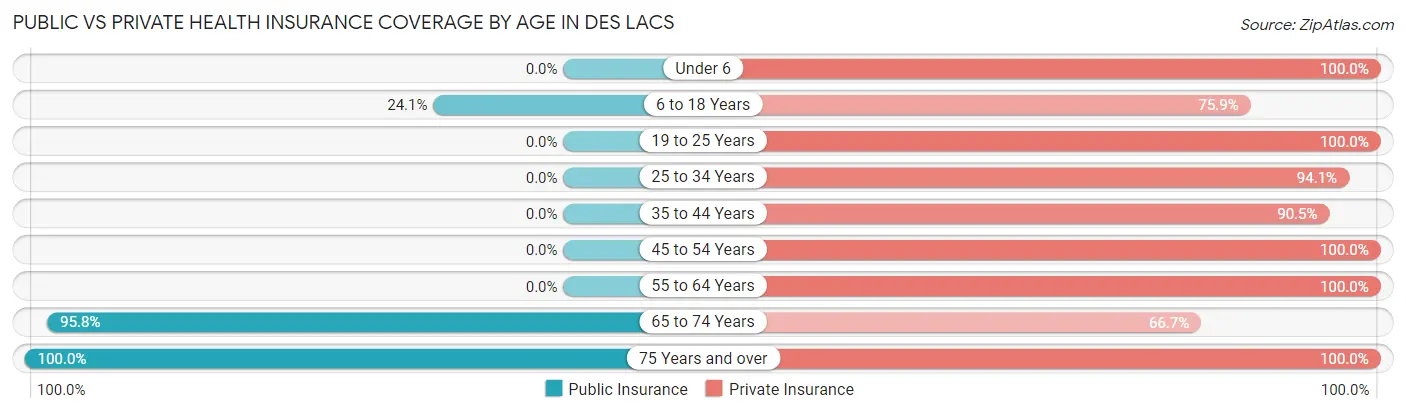
| Age Bracket | Public Insurance | Private Insurance |
| Under 6 | 0 (0.0%) | 10 (100.0%) |
| 6 to 18 Years | 7 (24.1%) | 22 (75.9%) |
| 19 to 25 Years | 0 (0.0%) | 24 (100.0%) |
| 25 to 34 Years | 0 (0.0%) | 16 (94.1%) |
| 35 to 44 Years | 0 (0.0%) | 19 (90.5%) |
| 45 to 54 Years | 0 (0.0%) | 15 (100.0%) |
| 55 to 64 Years | 0 (0.0%) | 52 (100.0%) |
| 65 to 74 Years | 23 (95.8%) | 16 (66.7%) |
| 75 Years and over | 8 (100.0%) | 8 (100.0%) |
| Total | 38 (19.0%) | 182 (91.0%) |
Disability Status by Sex by Age in Des Lacs
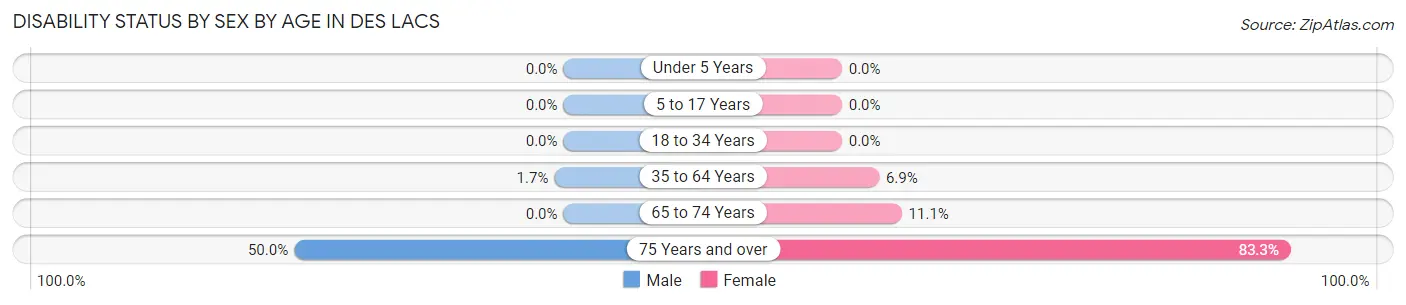
| Age Bracket | Male | Female |
| Under 5 Years | 0 (0.0%) | 0 (0.0%) |
| 5 to 17 Years | 0 (0.0%) | 0 (0.0%) |
| 18 to 34 Years | 0 (0.0%) | 0 (0.0%) |
| 35 to 64 Years | 1 (1.7%) | 2 (6.9%) |
| 65 to 74 Years | 0 (0.0%) | 1 (11.1%) |
| 75 Years and over | 1 (50.0%) | 5 (83.3%) |
Disability Class by Sex by Age in Des Lacs
Disability Class: Hearing Difficulty
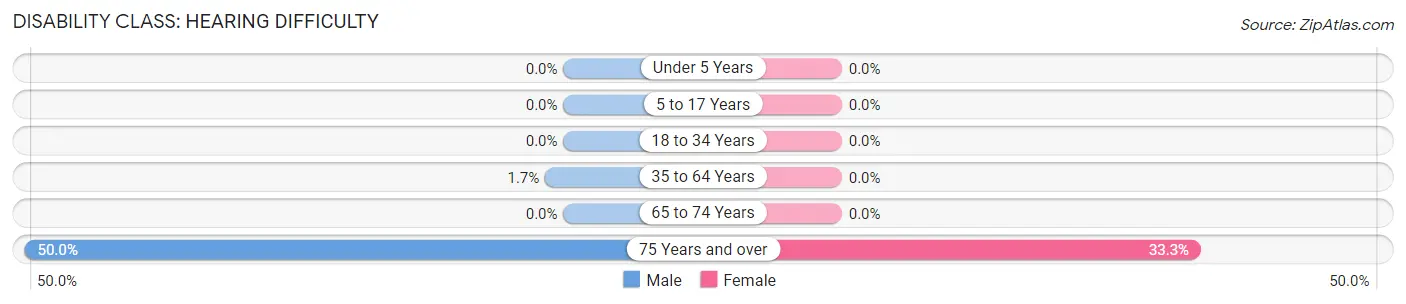
| Age Bracket | Male | Female |
| Under 5 Years | 0 (0.0%) | 0 (0.0%) |
| 5 to 17 Years | 0 (0.0%) | 0 (0.0%) |
| 18 to 34 Years | 0 (0.0%) | 0 (0.0%) |
| 35 to 64 Years | 1 (1.7%) | 0 (0.0%) |
| 65 to 74 Years | 0 (0.0%) | 0 (0.0%) |
| 75 Years and over | 1 (50.0%) | 2 (33.3%) |
Disability Class: Vision Difficulty
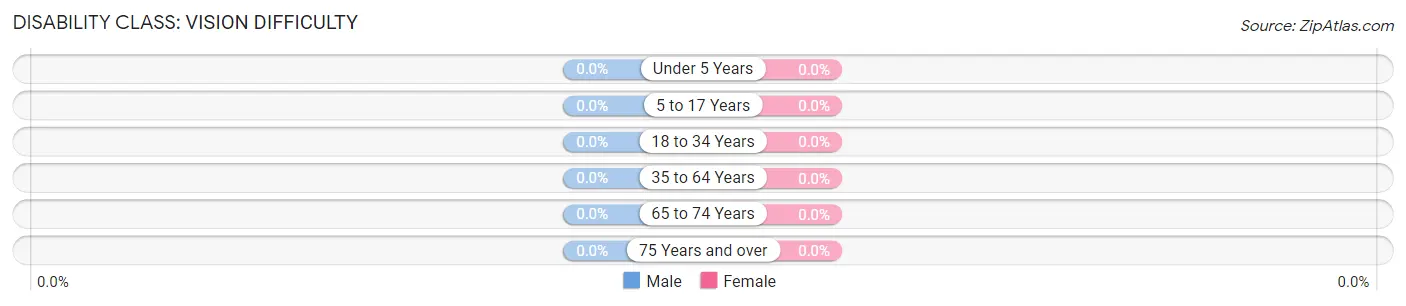
| Age Bracket | Male | Female |
| Under 5 Years | 0 (0.0%) | 0 (0.0%) |
| 5 to 17 Years | 0 (0.0%) | 0 (0.0%) |
| 18 to 34 Years | 0 (0.0%) | 0 (0.0%) |
| 35 to 64 Years | 0 (0.0%) | 0 (0.0%) |
| 65 to 74 Years | 0 (0.0%) | 0 (0.0%) |
| 75 Years and over | 0 (0.0%) | 0 (0.0%) |
Disability Class: Cognitive Difficulty
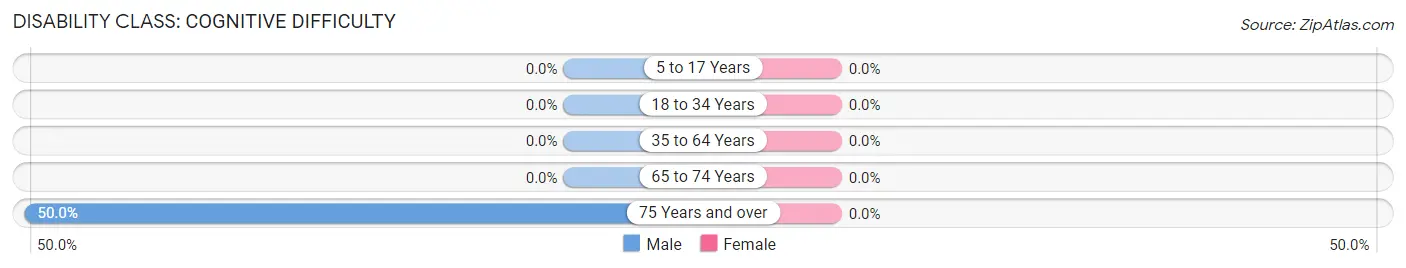
| Age Bracket | Male | Female |
| 5 to 17 Years | 0 (0.0%) | 0 (0.0%) |
| 18 to 34 Years | 0 (0.0%) | 0 (0.0%) |
| 35 to 64 Years | 0 (0.0%) | 0 (0.0%) |
| 65 to 74 Years | 0 (0.0%) | 0 (0.0%) |
| 75 Years and over | 1 (50.0%) | 0 (0.0%) |
Disability Class: Ambulatory Difficulty
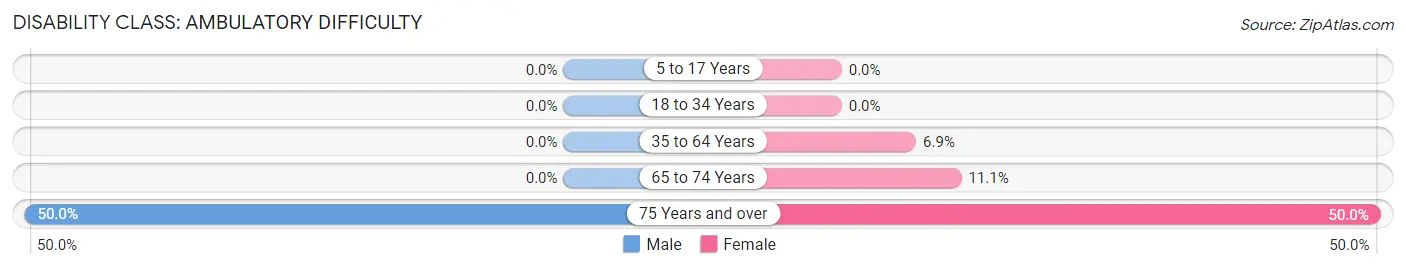
| Age Bracket | Male | Female |
| 5 to 17 Years | 0 (0.0%) | 0 (0.0%) |
| 18 to 34 Years | 0 (0.0%) | 0 (0.0%) |
| 35 to 64 Years | 0 (0.0%) | 2 (6.9%) |
| 65 to 74 Years | 0 (0.0%) | 1 (11.1%) |
| 75 Years and over | 1 (50.0%) | 3 (50.0%) |
Disability Class: Self-Care Difficulty

| Age Bracket | Male | Female |
| 5 to 17 Years | 0 (0.0%) | 0 (0.0%) |
| 18 to 34 Years | 0 (0.0%) | 0 (0.0%) |
| 35 to 64 Years | 0 (0.0%) | 0 (0.0%) |
| 65 to 74 Years | 0 (0.0%) | 0 (0.0%) |
| 75 Years and over | 0 (0.0%) | 0 (0.0%) |
Technology Access in Des Lacs
Computing Device Access in Des Lacs
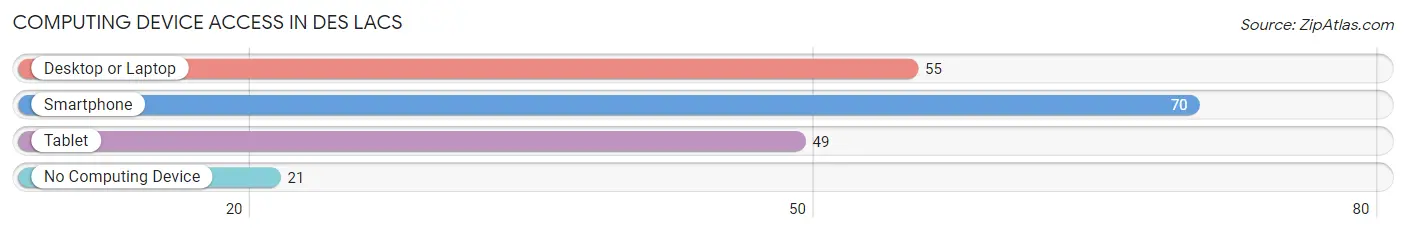
| Device Type | # Households | % Households |
| Desktop or Laptop | 55 | 57.9% |
| Smartphone | 70 | 73.7% |
| Tablet | 49 | 51.6% |
| No Computing Device | 21 | 22.1% |
| Total | 95 | 100.0% |
Internet Access in Des Lacs
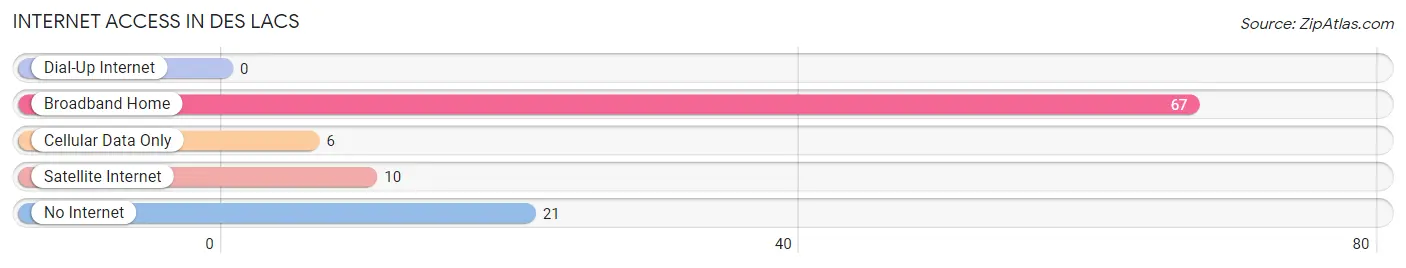
| Internet Type | # Households | % Households |
| Dial-Up Internet | 0 | 0.0% |
| Broadband Home | 67 | 70.5% |
| Cellular Data Only | 6 | 6.3% |
| Satellite Internet | 10 | 10.5% |
| No Internet | 21 | 22.1% |
| Total | 95 | 100.0% |
Des Lacs Summary
Lac des Lacs, North Dakota is a small town located in the northwest corner of the state. It is situated on the banks of the Des Lacs River, which is a tributary of the Missouri River. The town was founded in 1882 and is the county seat of Ward County. The population of the town was estimated to be 1,072 in 2020.
History
The area around Lac des Lacs was first settled by the Mandan and Hidatsa Native American tribes. The first European settlers arrived in the area in the late 1800s. The town was founded in 1882 and was named after the nearby Des Lacs River. The town was originally a trading post and was used as a stopping point for travelers heading west.
The town grew slowly over the years and by the early 1900s, it had become a bustling community. The town was home to a variety of businesses, including a hotel, a bank, a general store, and a post office. The town also had a school, a church, and a newspaper.
In the early 1900s, the town was a major hub for the area’s agricultural industry. The town was home to several grain elevators and a flour mill. The town also had a railroad station, which allowed for the transportation of goods and people.
Geography
Lac des Lacs is located in the northwest corner of North Dakota. It is situated on the banks of the Des Lacs River, which is a tributary of the Missouri River. The town is located in the Des Lacs National Wildlife Refuge, which is a protected area of wetlands and grasslands. The town is surrounded by rolling hills and prairies.
The climate in Lac des Lacs is typical of the northern Great Plains. Summers are hot and humid, while winters are cold and dry. The average annual temperature is around 45 degrees Fahrenheit. The town receives an average of 17 inches of precipitation per year.
Economy
The economy of Lac des Lacs is largely based on agriculture. The town is home to several grain elevators and a flour mill. The town is also home to a variety of businesses, including a hotel, a bank, a general store, and a post office.
The town is also home to a variety of manufacturing businesses, including a furniture factory and a metal fabrication plant. The town is also home to a variety of service businesses, including a medical clinic and a law firm.
Demographics
The population of Lac des Lacs was estimated to be 1,072 in 2020. The town is predominantly white, with a small percentage of Native American and African American residents. The median household income in the town is around $45,000. The town has a low unemployment rate and a high rate of homeownership.
Common Questions
What is Per Capita Income in Des Lacs?
Per Capita income in Des Lacs is $45,951.
What is the Median Family Income in Des Lacs?
Median Family Income in Des Lacs is $115,625.
What is the Median Household income in Des Lacs?
Median Household Income in Des Lacs is $78,750.
What is Income or Wage Gap in Des Lacs?
Income or Wage Gap in Des Lacs is 29.1%.
Women in Des Lacs earn 70.9 cents for every dollar earned by a man.
What is Inequality or Gini Index in Des Lacs?
Inequality or Gini Index in Des Lacs is 0.27.
What is the Total Population of Des Lacs?
Total Population of Des Lacs is 200.
What is the Total Male Population of Des Lacs?
Total Male Population of Des Lacs is 116.
What is the Total Female Population of Des Lacs?
Total Female Population of Des Lacs is 84.
What is the Ratio of Males per 100 Females in Des Lacs?
There are 138.10 Males per 100 Females in Des Lacs.
What is the Ratio of Females per 100 Males in Des Lacs?
There are 72.41 Females per 100 Males in Des Lacs.
What is the Median Population Age in Des Lacs?
Median Population Age in Des Lacs is 42.8 Years.
What is the Average Family Size in Des Lacs
Average Family Size in Des Lacs is 2.7 People.
What is the Average Household Size in Des Lacs
Average Household Size in Des Lacs is 2.1 People.
How Large is the Labor Force in Des Lacs?
There are 138 People in the Labor Forcein in Des Lacs.
What is the Percentage of People in the Labor Force in Des Lacs?
81.2% of People are in the Labor Force in Des Lacs.