Mandan, ND Map & Demographics
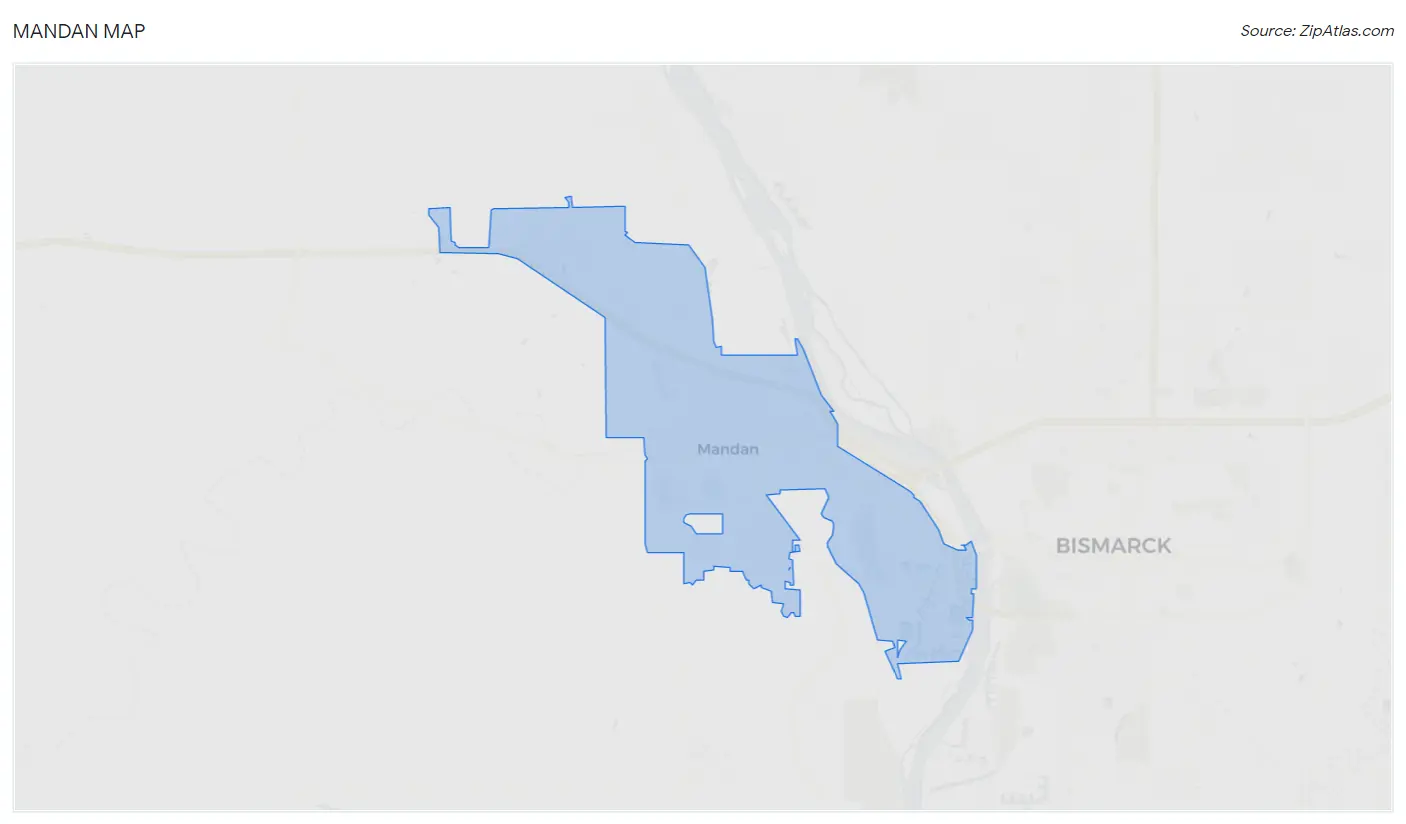
Mandan Map
Mandan Overview
$43,749
PER CAPITA INCOME
$105,530
AVG FAMILY INCOME
$78,077
AVG HOUSEHOLD INCOME
21.3%
WAGE / INCOME GAP [ % ]
78.7¢/ $1
WAGE / INCOME GAP [ $ ]
0.45
INEQUALITY / GINI INDEX
24,049
TOTAL POPULATION
12,374
MALE POPULATION
11,675
FEMALE POPULATION
105.99
MALES / 100 FEMALES
94.35
FEMALES / 100 MALES
35.6
MEDIAN AGE
2.9
AVG FAMILY SIZE
2.4
AVG HOUSEHOLD SIZE
14,029
LABOR FORCE [ PEOPLE ]
73.1%
PERCENT IN LABOR FORCE
2.0%
UNEMPLOYMENT RATE
Mandan Zip Codes
Mandan Area Codes
Income in Mandan
Income Overview in Mandan
Per Capita Income in Mandan is $43,749, while median incomes of families and households are $105,530 and $78,077 respectively.
| Characteristic | Number | Measure |
| Per Capita Income | 24,049 | $43,749 |
| Median Family Income | 6,370 | $105,530 |
| Mean Family Income | 6,370 | $130,316 |
| Median Household Income | 9,746 | $78,077 |
| Mean Household Income | 9,746 | $105,417 |
| Income Deficit | 6,370 | $0 |
| Wage / Income Gap (%) | 24,049 | 21.32% |
| Wage / Income Gap ($) | 24,049 | 78.68¢ per $1 |
| Gini / Inequality Index | 24,049 | 0.45 |
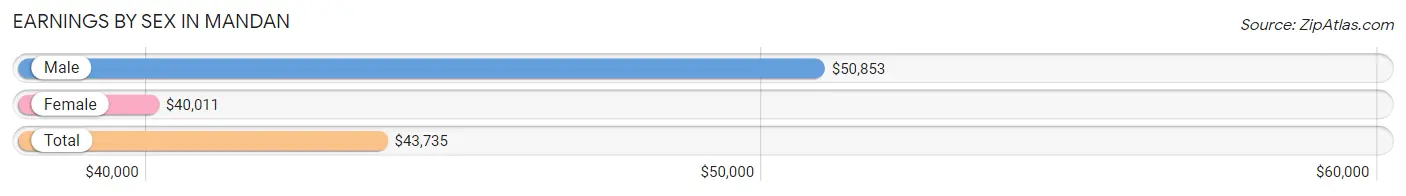
Earnings by Sex in Mandan
Average Earnings in Mandan are $43,735, $50,853 for men and $40,011 for women, a difference of 21.3%.
| Sex | Number | Average Earnings |
| Male | 8,129 (54.3%) | $50,853 |
| Female | 6,837 (45.7%) | $40,011 |
| Total | 14,966 (100.0%) | $43,735 |
Earnings by Sex by Income Bracket in Mandan
The most common earnings brackets in Mandan are $100,000+ for men (1,299 | 16.0%) and $55,000 to $64,999 for women (688 | 10.1%).
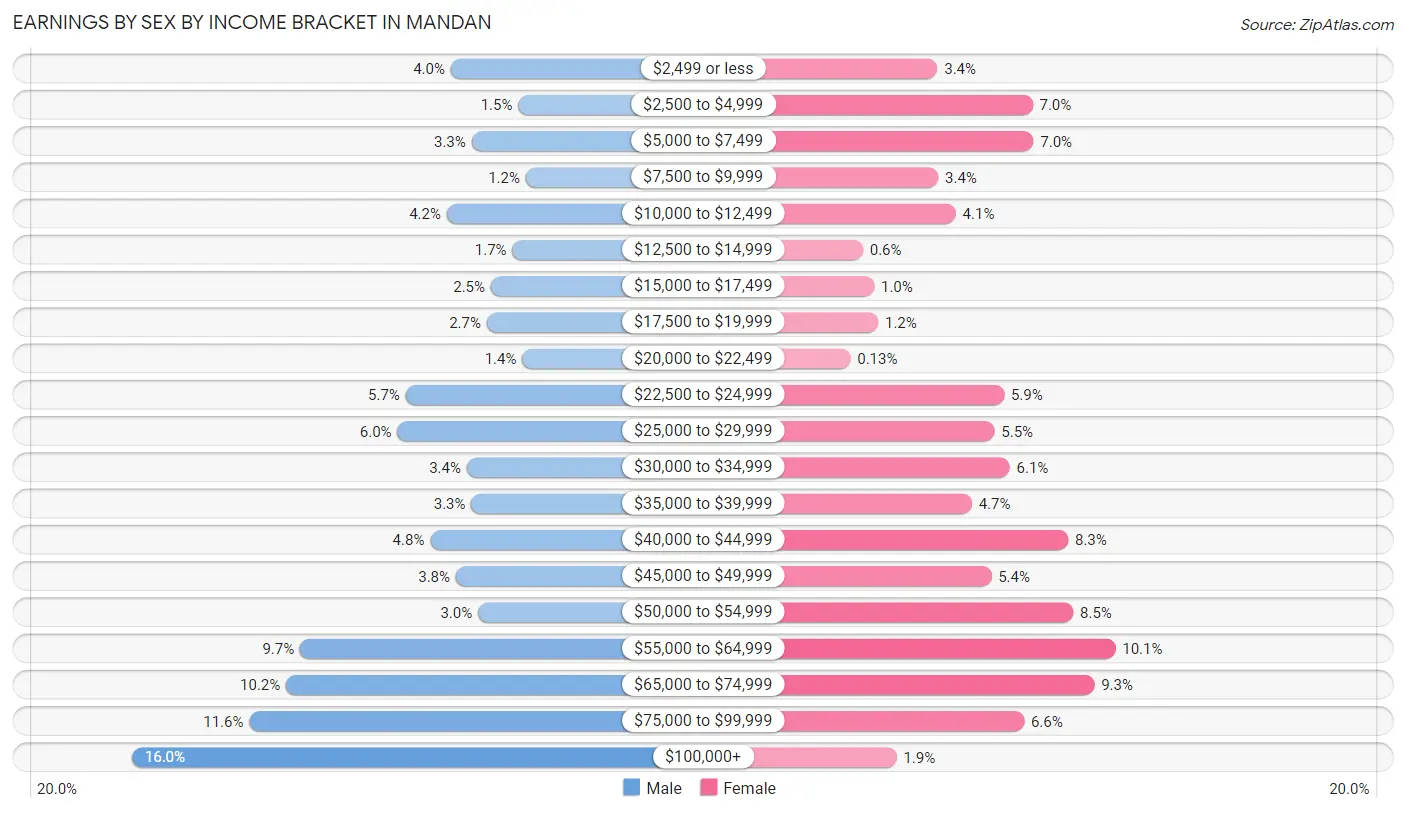
| Income | Male | Female |
| $2,499 or less | 328 (4.0%) | 232 (3.4%) |
| $2,500 to $4,999 | 122 (1.5%) | 476 (7.0%) |
| $5,000 to $7,499 | 264 (3.3%) | 478 (7.0%) |
| $7,500 to $9,999 | 99 (1.2%) | 234 (3.4%) |
| $10,000 to $12,499 | 340 (4.2%) | 279 (4.1%) |
| $12,500 to $14,999 | 140 (1.7%) | 41 (0.6%) |
| $15,000 to $17,499 | 206 (2.5%) | 70 (1.0%) |
| $17,500 to $19,999 | 218 (2.7%) | 80 (1.2%) |
| $20,000 to $22,499 | 110 (1.3%) | 9 (0.1%) |
| $22,500 to $24,999 | 465 (5.7%) | 403 (5.9%) |
| $25,000 to $29,999 | 490 (6.0%) | 378 (5.5%) |
| $30,000 to $34,999 | 279 (3.4%) | 417 (6.1%) |
| $35,000 to $39,999 | 265 (3.3%) | 320 (4.7%) |
| $40,000 to $44,999 | 390 (4.8%) | 567 (8.3%) |
| $45,000 to $49,999 | 312 (3.8%) | 370 (5.4%) |
| $50,000 to $54,999 | 245 (3.0%) | 580 (8.5%) |
| $55,000 to $64,999 | 787 (9.7%) | 688 (10.1%) |
| $65,000 to $74,999 | 829 (10.2%) | 634 (9.3%) |
| $75,000 to $99,999 | 941 (11.6%) | 454 (6.6%) |
| $100,000+ | 1,299 (16.0%) | 127 (1.9%) |
| Total | 8,129 (100.0%) | 6,837 (100.0%) |
Earnings by Sex by Educational Attainment in Mandan
Average earnings in Mandan are $59,857 for men and $44,759 for women, a difference of 25.2%. Men with an educational attainment of graduate degree enjoy the highest average annual earnings of $108,103, while those with less than high school education earn the least with $23,450. Women with an educational attainment of graduate degree earn the most with the average annual earnings of $68,550, while those with high school diploma education have the smallest earnings of $33,219.
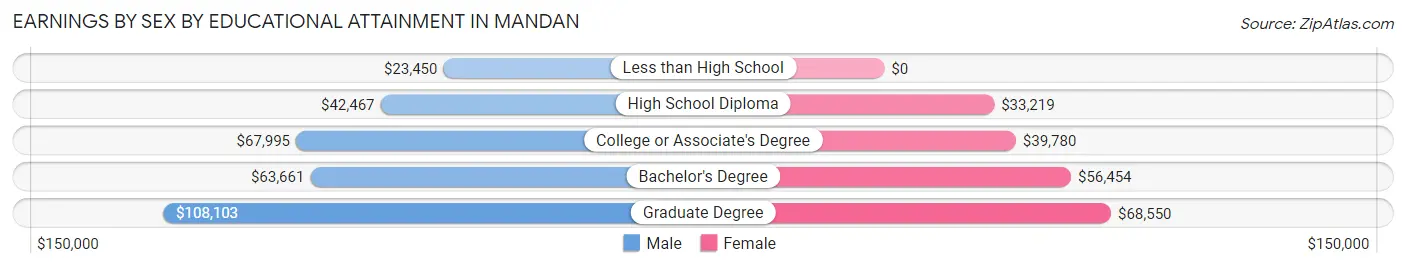
| Educational Attainment | Male Income | Female Income |
| Less than High School | $23,450 | $0 |
| High School Diploma | $42,467 | $33,219 |
| College or Associate's Degree | $67,995 | $39,780 |
| Bachelor's Degree | $63,661 | $56,454 |
| Graduate Degree | $108,103 | $68,550 |
| Total | $59,857 | $44,759 |
Family Income in Mandan
Family Income Brackets in Mandan
According to the Mandan family income data, there are 2,000 families falling into the $100,000 to $149,999 income range, which is the most common income bracket and makes up 31.4% of all families. Conversely, the $10,000 to $14,999 income bracket is the least frequent group with only 45 families (0.7%) belonging to this category.
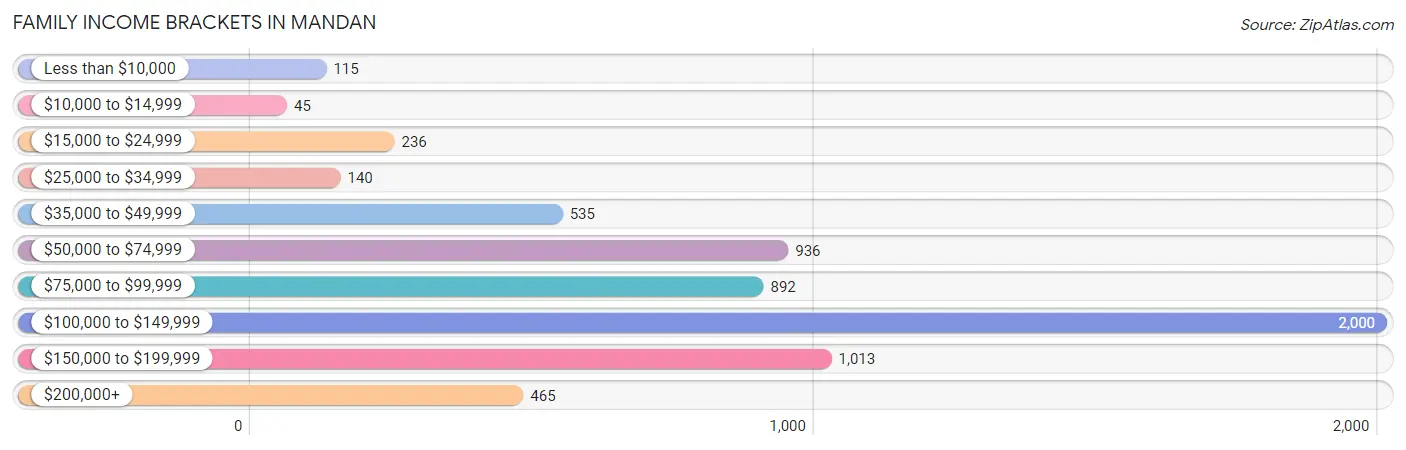
| Income Bracket | # Families | % Families |
| Less than $10,000 | 115 | 1.8% |
| $10,000 to $14,999 | 45 | 0.7% |
| $15,000 to $24,999 | 236 | 3.7% |
| $25,000 to $34,999 | 140 | 2.2% |
| $35,000 to $49,999 | 535 | 8.4% |
| $50,000 to $74,999 | 936 | 14.7% |
| $75,000 to $99,999 | 892 | 14.0% |
| $100,000 to $149,999 | 2,000 | 31.4% |
| $150,000 to $199,999 | 1,013 | 15.9% |
| $200,000+ | 465 | 7.3% |
Family Income by Famaliy Size in Mandan
5-person families (468 | 7.3%) account for the highest median family income in Mandan with $158,517 per family, while 2-person families (3,367 | 52.9%) have the highest median income of $48,979 per family member.
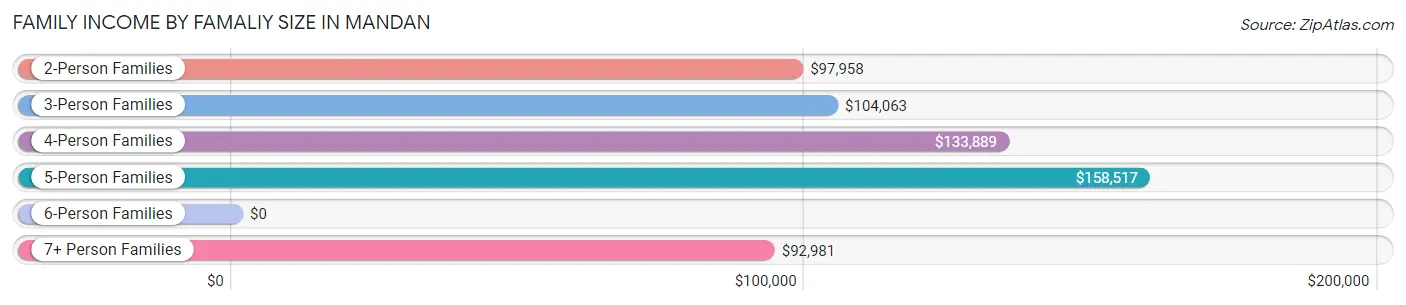
| Income Bracket | # Families | Median Income |
| 2-Person Families | 3,367 (52.9%) | $97,958 |
| 3-Person Families | 1,378 (21.6%) | $104,063 |
| 4-Person Families | 906 (14.2%) | $133,889 |
| 5-Person Families | 468 (7.3%) | $158,517 |
| 6-Person Families | 177 (2.8%) | $0 |
| 7+ Person Families | 74 (1.2%) | $92,981 |
| Total | 6,370 (100.0%) | $105,530 |
Family Income by Number of Earners in Mandan
The median family income in Mandan is $105,530, with families comprising 3+ earners (766) having the highest median family income of $159,146, while families with no earners (605) have the lowest median family income of $43,606, accounting for 12.0% and 9.5% of families, respectively.
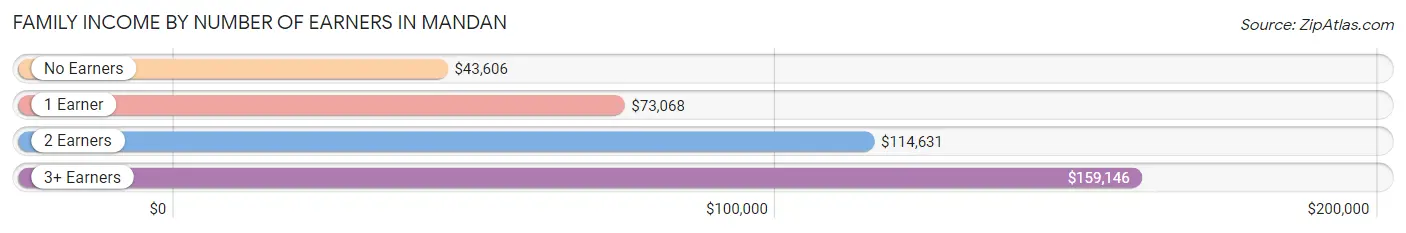
| Number of Earners | # Families | Median Income |
| No Earners | 605 (9.5%) | $43,606 |
| 1 Earner | 1,688 (26.5%) | $73,068 |
| 2 Earners | 3,311 (52.0%) | $114,631 |
| 3+ Earners | 766 (12.0%) | $159,146 |
| Total | 6,370 (100.0%) | $105,530 |
Household Income in Mandan
Household Income Brackets in Mandan
With 2,251 households falling in the category, the $100,000 to $149,999 income range is the most frequent in Mandan, accounting for 23.1% of all households. In contrast, only 214 households (2.2%) fall into the less than $10,000 income bracket, making it the least populous group.
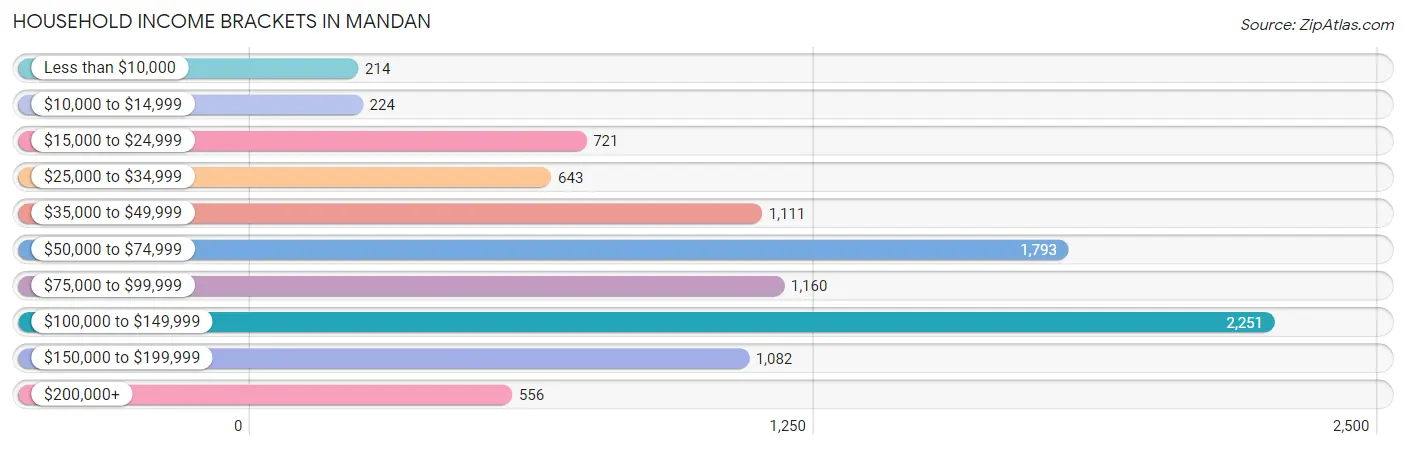
| Income Bracket | # Households | % Households |
| Less than $10,000 | 214 | 2.2% |
| $10,000 to $14,999 | 224 | 2.3% |
| $15,000 to $24,999 | 721 | 7.4% |
| $25,000 to $34,999 | 643 | 6.6% |
| $35,000 to $49,999 | 1,111 | 11.4% |
| $50,000 to $74,999 | 1,793 | 18.4% |
| $75,000 to $99,999 | 1,160 | 11.9% |
| $100,000 to $149,999 | 2,251 | 23.1% |
| $150,000 to $199,999 | 1,082 | 11.1% |
| $200,000+ | 556 | 5.7% |
Household Income by Householder Age in Mandan
The median household income in Mandan is $78,077, with the highest median household income of $101,528 found in the 45 to 64 years age bracket for the primary householder. A total of 3,155 households (32.4%) fall into this category. Meanwhile, the 15 to 24 years age bracket for the primary householder has the lowest median household income of $39,130, with 608 households (6.2%) in this group.
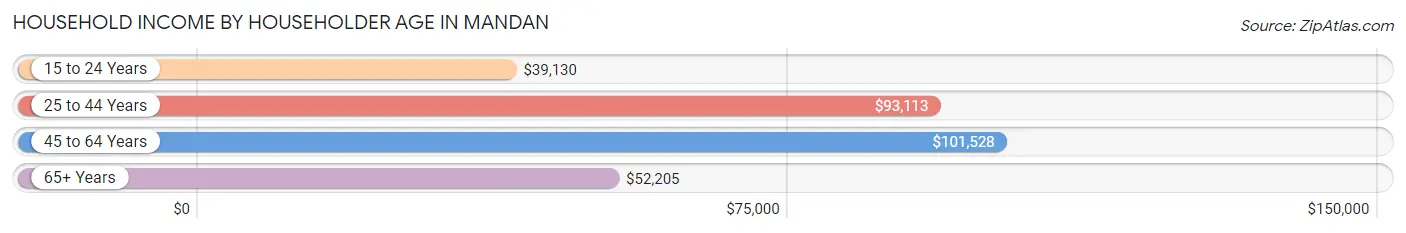
| Income Bracket | # Households | Median Income |
| 15 to 24 Years | 608 (6.2%) | $39,130 |
| 25 to 44 Years | 3,544 (36.4%) | $93,113 |
| 45 to 64 Years | 3,155 (32.4%) | $101,528 |
| 65+ Years | 2,439 (25.0%) | $52,205 |
| Total | 9,746 (100.0%) | $78,077 |
Poverty in Mandan
Income Below Poverty by Sex and Age in Mandan
With 7.7% poverty level for males and 11.5% for females among the residents of Mandan, 12 to 14 year old males and 18 to 24 year old females are the most vulnerable to poverty, with 156 males (29.9%) and 533 females (52.9%) in their respective age groups living below the poverty level.
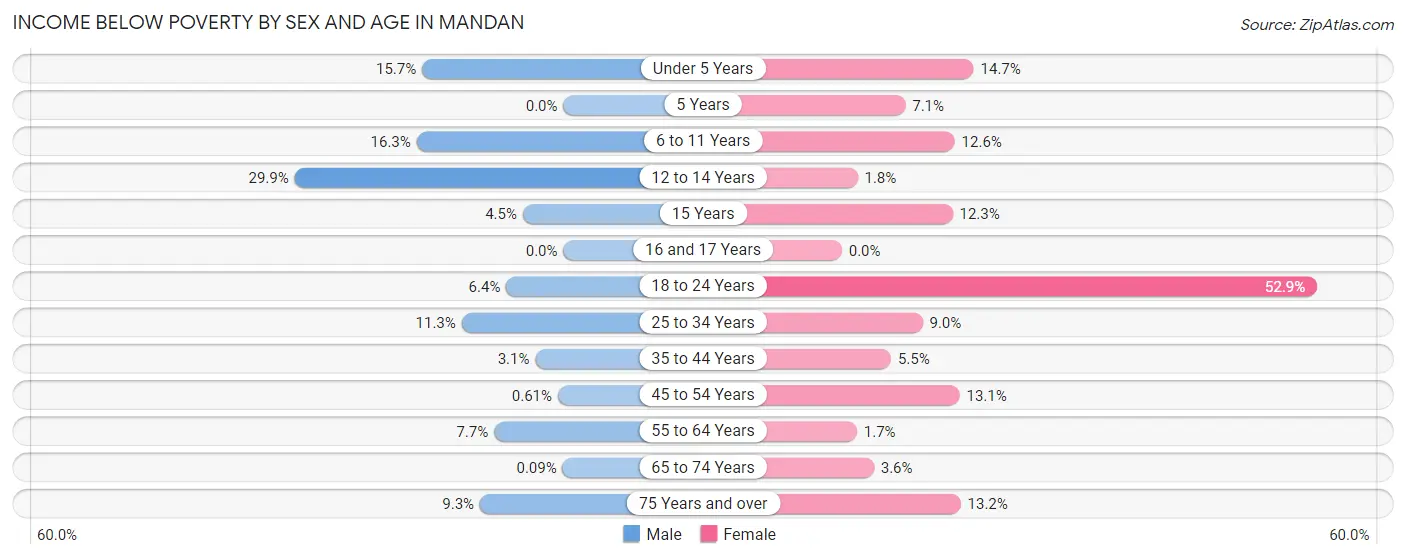
| Age Bracket | Male | Female |
| Under 5 Years | 105 (15.7%) | 106 (14.7%) |
| 5 Years | 0 (0.0%) | 20 (7.1%) |
| 6 to 11 Years | 156 (16.3%) | 64 (12.6%) |
| 12 to 14 Years | 156 (29.9%) | 12 (1.8%) |
| 15 Years | 10 (4.5%) | 18 (12.3%) |
| 16 and 17 Years | 0 (0.0%) | 0 (0.0%) |
| 18 to 24 Years | 82 (6.4%) | 533 (52.9%) |
| 25 to 34 Years | 220 (11.3%) | 159 (9.0%) |
| 35 to 44 Years | 56 (3.1%) | 79 (5.5%) |
| 45 to 54 Years | 9 (0.6%) | 174 (13.1%) |
| 55 to 64 Years | 99 (7.7%) | 23 (1.7%) |
| 65 to 74 Years | 1 (0.1%) | 44 (3.6%) |
| 75 Years and over | 43 (9.3%) | 84 (13.2%) |
| Total | 937 (7.7%) | 1,316 (11.5%) |
Income Above Poverty by Sex and Age in Mandan
According to the poverty statistics in Mandan, males aged 5 years and females aged 16 and 17 years are the age groups that are most secure financially, with 100.0% of males and 100.0% of females in these age groups living above the poverty line.
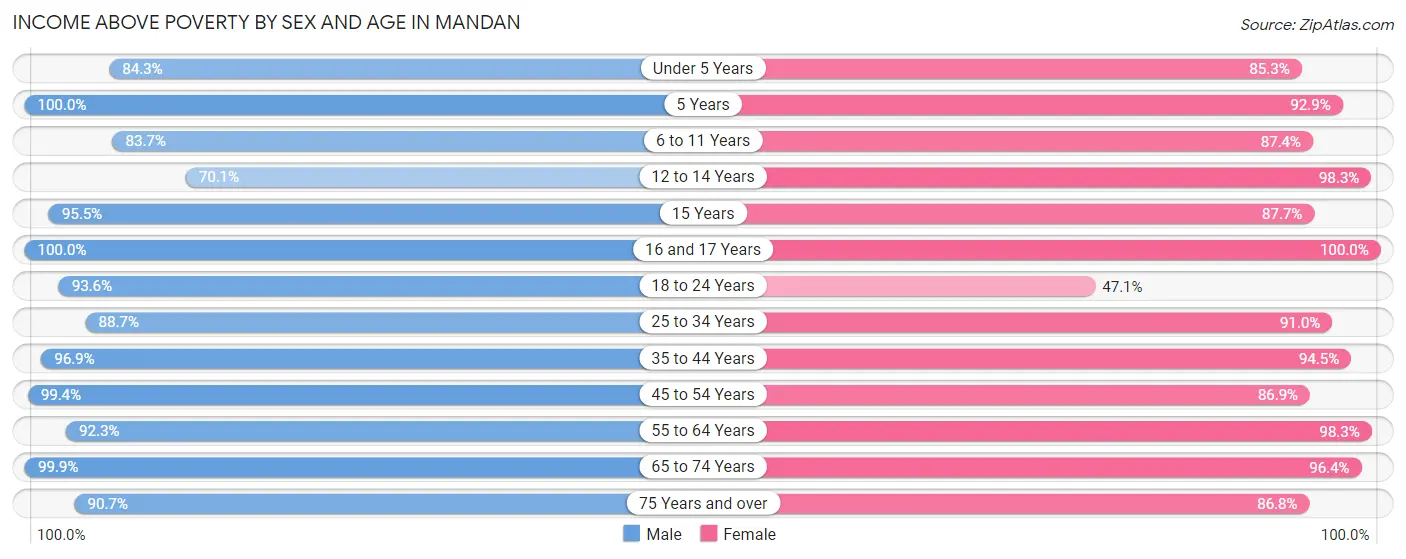
| Age Bracket | Male | Female |
| Under 5 Years | 562 (84.3%) | 616 (85.3%) |
| 5 Years | 108 (100.0%) | 263 (92.9%) |
| 6 to 11 Years | 799 (83.7%) | 445 (87.4%) |
| 12 to 14 Years | 365 (70.1%) | 673 (98.3%) |
| 15 Years | 211 (95.5%) | 128 (87.7%) |
| 16 and 17 Years | 301 (100.0%) | 323 (100.0%) |
| 18 to 24 Years | 1,207 (93.6%) | 474 (47.1%) |
| 25 to 34 Years | 1,721 (88.7%) | 1,609 (91.0%) |
| 35 to 44 Years | 1,737 (96.9%) | 1,362 (94.5%) |
| 45 to 54 Years | 1,476 (99.4%) | 1,153 (86.9%) |
| 55 to 64 Years | 1,184 (92.3%) | 1,348 (98.3%) |
| 65 to 74 Years | 1,125 (99.9%) | 1,192 (96.4%) |
| 75 Years and over | 420 (90.7%) | 551 (86.8%) |
| Total | 11,216 (92.3%) | 10,137 (88.5%) |
Income Below Poverty Among Married-Couple Families in Mandan
The poverty statistics for married-couple families in Mandan show that 2.2% or 112 of the total 5,147 families live below the poverty line. Families with 3 or 4 children have the highest poverty rate of 19.0%, comprising of 85 families. On the other hand, families with 1 or 2 children have the lowest poverty rate of 0.0%, which includes 0 families.
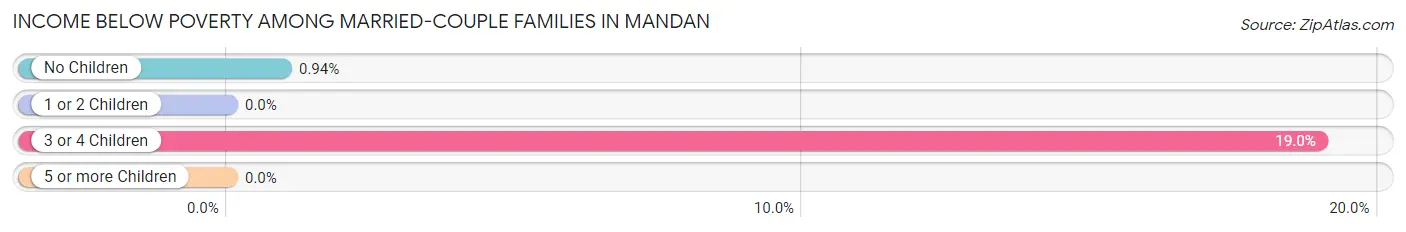
| Children | Above Poverty | Below Poverty |
| No Children | 2,849 (99.1%) | 27 (0.9%) |
| 1 or 2 Children | 1,770 (100.0%) | 0 (0.0%) |
| 3 or 4 Children | 363 (81.0%) | 85 (19.0%) |
| 5 or more Children | 53 (100.0%) | 0 (0.0%) |
| Total | 5,035 (97.8%) | 112 (2.2%) |
Income Below Poverty Among Single-Parent Households in Mandan
According to the poverty data in Mandan, 1.0% or 3 single-father households and 18.4% or 169 single-mother households are living below the poverty line. Among single-father households, those with no children have the highest poverty rate, with 3 households (2.3%) experiencing poverty. Likewise, among single-mother households, those with 5 or more children have the highest poverty rate, with 37 households (52.1%) falling below the poverty line.
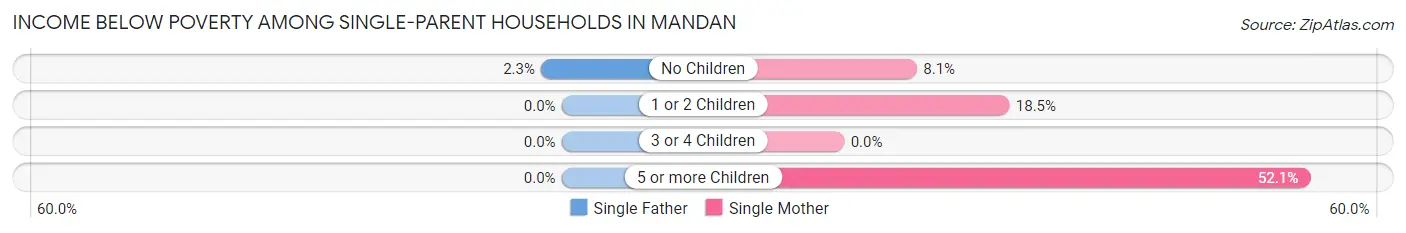
| Children | Single Father | Single Mother |
| No Children | 3 (2.3%) | 19 (8.1%) |
| 1 or 2 Children | 0 (0.0%) | 113 (18.5%) |
| 3 or 4 Children | 0 (0.0%) | 0 (0.0%) |
| 5 or more Children | 0 (0.0%) | 37 (52.1%) |
| Total | 3 (1.0%) | 169 (18.4%) |
Income Below Poverty Among Married-Couple vs Single-Parent Households in Mandan
The poverty data for Mandan shows that 112 of the married-couple family households (2.2%) and 172 of the single-parent households (14.1%) are living below the poverty level. Within the married-couple family households, those with 3 or 4 children have the highest poverty rate, with 85 households (19.0%) falling below the poverty line. Among the single-parent households, those with 5 or more children have the highest poverty rate, with 37 household (52.1%) living below poverty.
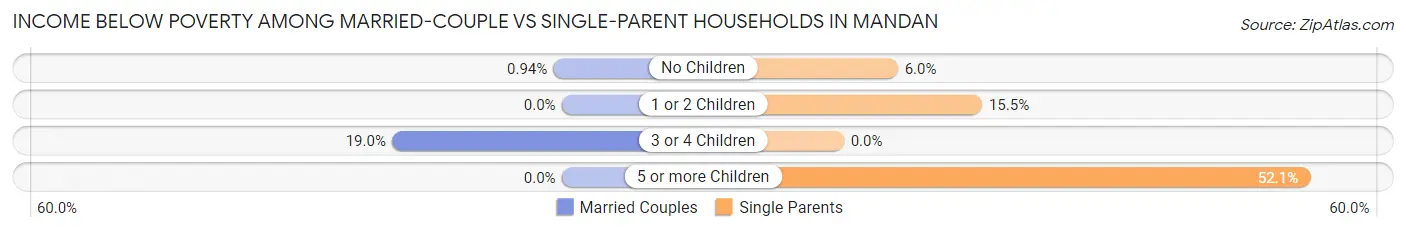
| Children | Married-Couple Families | Single-Parent Households |
| No Children | 27 (0.9%) | 22 (6.0%) |
| 1 or 2 Children | 0 (0.0%) | 113 (15.5%) |
| 3 or 4 Children | 85 (19.0%) | 0 (0.0%) |
| 5 or more Children | 0 (0.0%) | 37 (52.1%) |
| Total | 112 (2.2%) | 172 (14.1%) |
Race in Mandan
The most populous races in Mandan are White / Caucasian (20,616 | 85.7%), Hispanic or Latino (1,305 | 5.4%), and Two or more Races (1,005 | 4.2%).
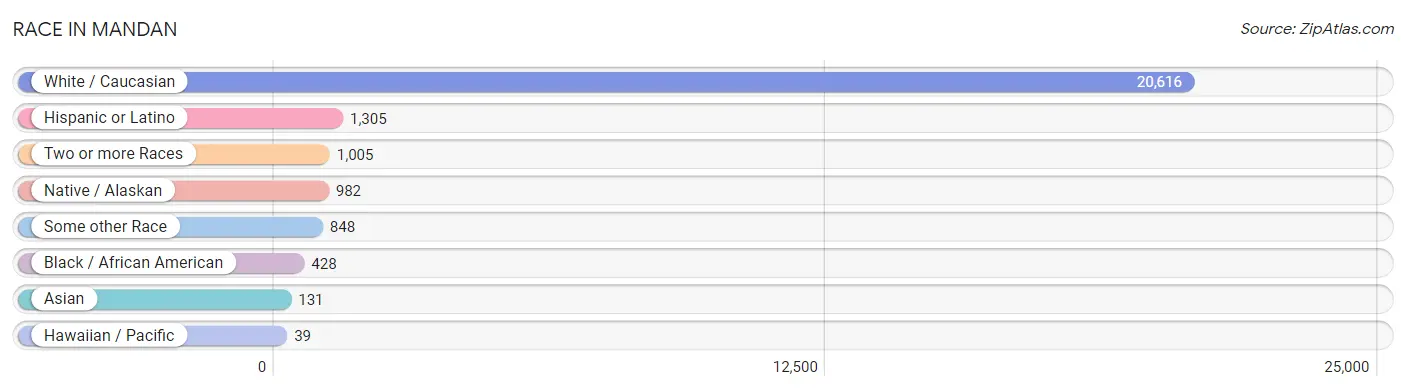
| Race | # Population | % Population |
| Asian | 131 | 0.5% |
| Black / African American | 428 | 1.8% |
| Hawaiian / Pacific | 39 | 0.2% |
| Hispanic or Latino | 1,305 | 5.4% |
| Native / Alaskan | 982 | 4.1% |
| White / Caucasian | 20,616 | 85.7% |
| Two or more Races | 1,005 | 4.2% |
| Some other Race | 848 | 3.5% |
| Total | 24,049 | 100.0% |
Ancestry in Mandan
The most populous ancestries reported in Mandan are German (11,158 | 46.4%), Norwegian (3,280 | 13.6%), Irish (2,014 | 8.4%), American (1,667 | 6.9%), and Russian (1,395 | 5.8%), together accounting for 81.1% of all Mandan residents.
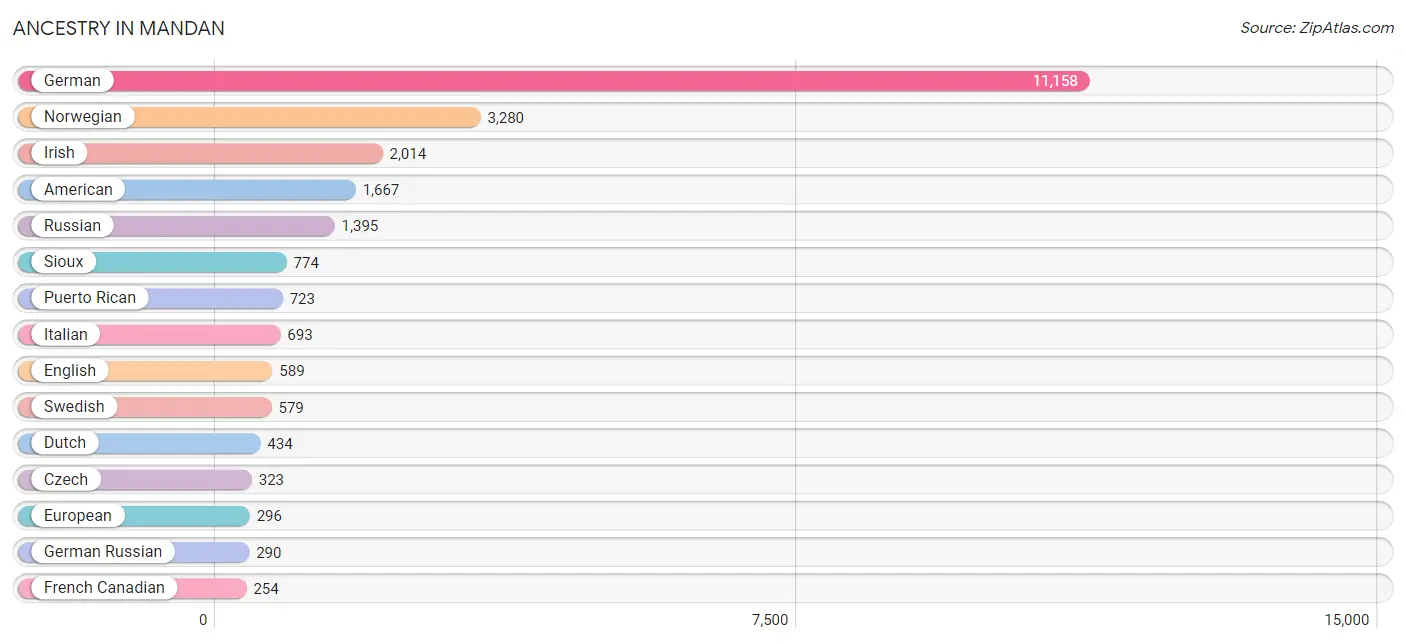
| Ancestry | # Population | % Population |
| American | 1,667 | 6.9% |
| Arab | 132 | 0.5% |
| Basque | 11 | 0.1% |
| Bhutanese | 10 | 0.0% |
| British | 165 | 0.7% |
| Burmese | 92 | 0.4% |
| Central American | 5 | 0.0% |
| Cherokee | 19 | 0.1% |
| Chippewa | 124 | 0.5% |
| Colombian | 114 | 0.5% |
| Czech | 323 | 1.3% |
| Czechoslovakian | 15 | 0.1% |
| Danish | 113 | 0.5% |
| Dutch | 434 | 1.8% |
| Eastern European | 22 | 0.1% |
| Ecuadorian | 27 | 0.1% |
| English | 589 | 2.5% |
| European | 296 | 1.2% |
| Fijian | 4 | 0.0% |
| Finnish | 14 | 0.1% |
| French | 144 | 0.6% |
| French Canadian | 254 | 1.1% |
| German | 11,158 | 46.4% |
| German Russian | 290 | 1.2% |
| Greek | 29 | 0.1% |
| Guatemalan | 1 | 0.0% |
| Hungarian | 100 | 0.4% |
| Icelander | 49 | 0.2% |
| Iraqi | 109 | 0.4% |
| Irish | 2,014 | 8.4% |
| Italian | 693 | 2.9% |
| Jamaican | 42 | 0.2% |
| Korean | 2 | 0.0% |
| Lebanese | 23 | 0.1% |
| Menominee | 1 | 0.0% |
| Mexican | 126 | 0.5% |
| Norwegian | 3,280 | 13.6% |
| Panamanian | 4 | 0.0% |
| Polish | 167 | 0.7% |
| Puerto Rican | 723 | 3.0% |
| Russian | 1,395 | 5.8% |
| Samoan | 4 | 0.0% |
| Scandinavian | 238 | 1.0% |
| Scotch-Irish | 189 | 0.8% |
| Scottish | 42 | 0.2% |
| Senegalese | 18 | 0.1% |
| Sioux | 774 | 3.2% |
| South American | 141 | 0.6% |
| Spanish American | 25 | 0.1% |
| Subsaharan African | 18 | 0.1% |
| Swedish | 579 | 2.4% |
| Swiss | 48 | 0.2% |
| Ukrainian | 69 | 0.3% |
| Welsh | 34 | 0.1% | View All 54 Rows |
Immigrants in Mandan
The most numerous immigrant groups reported in Mandan came from Asia (170 | 0.7%), Iraq (127 | 0.5%), Western Asia (127 | 0.5%), Latin America (116 | 0.5%), and South America (55 | 0.2%), together accounting for 2.5% of all Mandan residents.
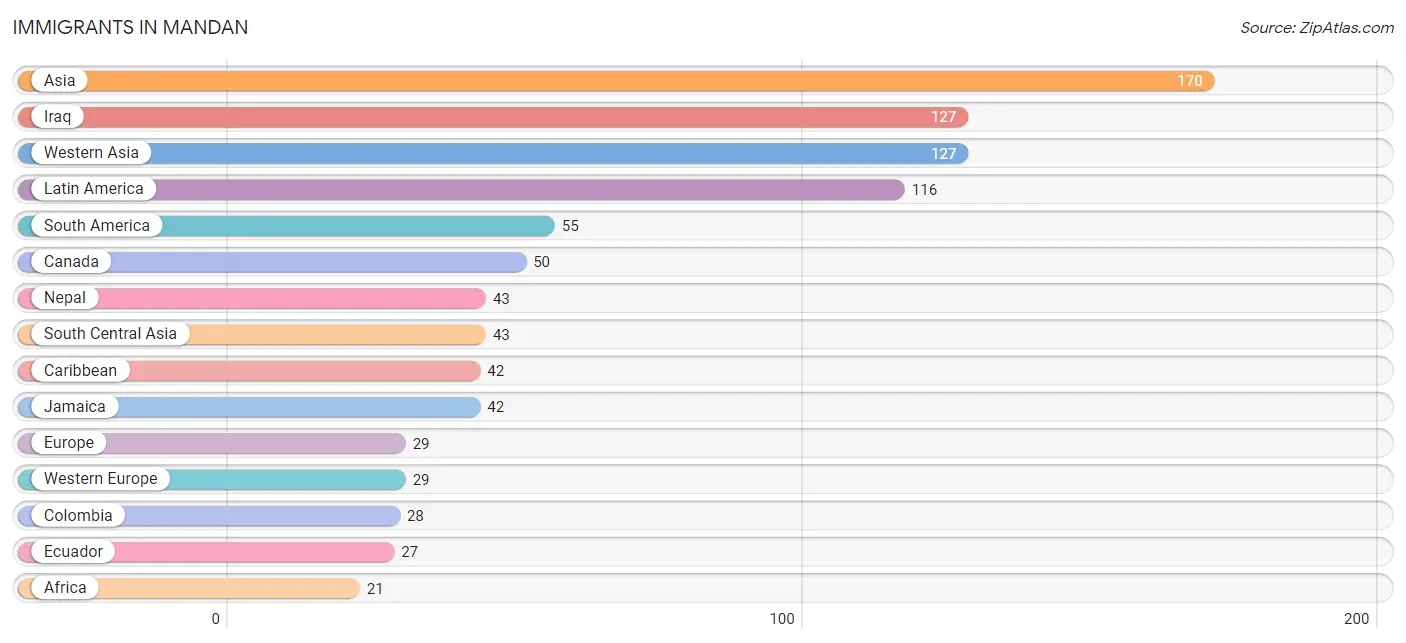
| Immigration Origin | # Population | % Population |
| Africa | 21 | 0.1% |
| Asia | 170 | 0.7% |
| Belgium | 10 | 0.0% |
| Canada | 50 | 0.2% |
| Caribbean | 42 | 0.2% |
| Central America | 19 | 0.1% |
| Colombia | 28 | 0.1% |
| Ecuador | 27 | 0.1% |
| Europe | 29 | 0.1% |
| Germany | 19 | 0.1% |
| Ghana | 4 | 0.0% |
| Iraq | 127 | 0.5% |
| Jamaica | 42 | 0.2% |
| Latin America | 116 | 0.5% |
| Liberia | 17 | 0.1% |
| Mexico | 15 | 0.1% |
| Nepal | 43 | 0.2% |
| Oceania | 4 | 0.0% |
| Panama | 4 | 0.0% |
| South America | 55 | 0.2% |
| South Central Asia | 43 | 0.2% |
| Western Africa | 21 | 0.1% |
| Western Asia | 127 | 0.5% |
| Western Europe | 29 | 0.1% | View All 24 Rows |
Sex and Age in Mandan
Sex and Age in Mandan
The most populous age groups in Mandan are 35 to 39 Years (1,166 | 9.4%) for men and 25 to 29 Years (943 | 8.1%) for women.
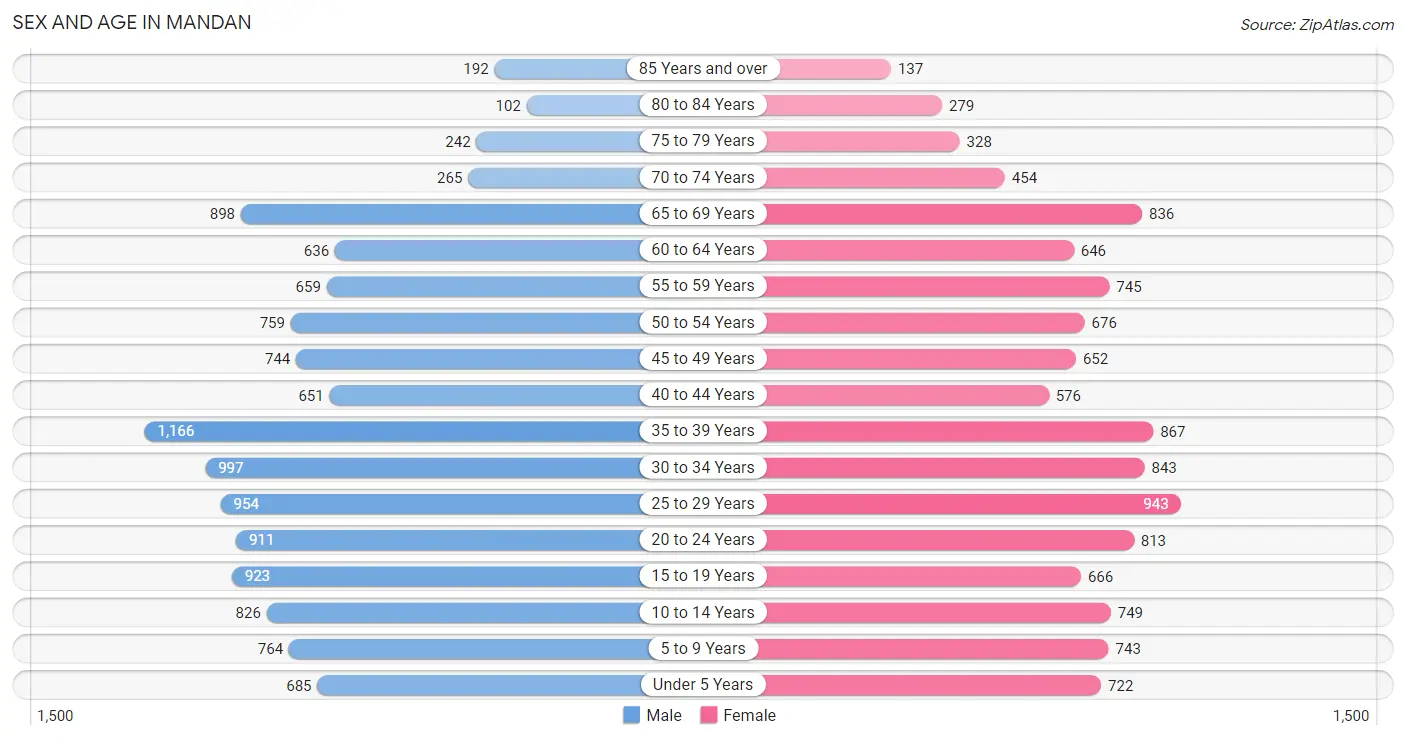
| Age Bracket | Male | Female |
| Under 5 Years | 685 (5.5%) | 722 (6.2%) |
| 5 to 9 Years | 764 (6.2%) | 743 (6.4%) |
| 10 to 14 Years | 826 (6.7%) | 749 (6.4%) |
| 15 to 19 Years | 923 (7.5%) | 666 (5.7%) |
| 20 to 24 Years | 911 (7.4%) | 813 (7.0%) |
| 25 to 29 Years | 954 (7.7%) | 943 (8.1%) |
| 30 to 34 Years | 997 (8.1%) | 843 (7.2%) |
| 35 to 39 Years | 1,166 (9.4%) | 867 (7.4%) |
| 40 to 44 Years | 651 (5.3%) | 576 (4.9%) |
| 45 to 49 Years | 744 (6.0%) | 652 (5.6%) |
| 50 to 54 Years | 759 (6.1%) | 676 (5.8%) |
| 55 to 59 Years | 659 (5.3%) | 745 (6.4%) |
| 60 to 64 Years | 636 (5.1%) | 646 (5.5%) |
| 65 to 69 Years | 898 (7.3%) | 836 (7.2%) |
| 70 to 74 Years | 265 (2.1%) | 454 (3.9%) |
| 75 to 79 Years | 242 (2.0%) | 328 (2.8%) |
| 80 to 84 Years | 102 (0.8%) | 279 (2.4%) |
| 85 Years and over | 192 (1.5%) | 137 (1.2%) |
| Total | 12,374 (100.0%) | 11,675 (100.0%) |
Families and Households in Mandan
Median Family Size in Mandan
The median family size in Mandan is 2.90 persons per family, with single male/father families (306 | 4.8%) accounting for the largest median family size of 3.57 persons per family. On the other hand, single female/mother families (917 | 14.4%) represent the smallest median family size with 2.62 persons per family.
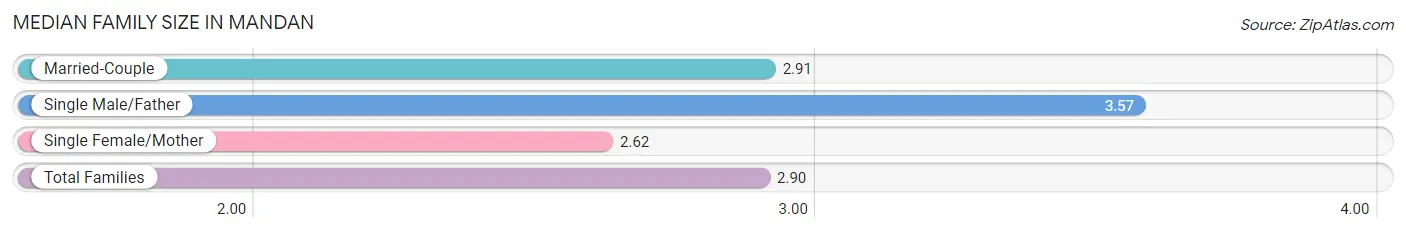
| Family Type | # Families | Family Size |
| Married-Couple | 5,147 (80.8%) | 2.91 |
| Single Male/Father | 306 (4.8%) | 3.57 |
| Single Female/Mother | 917 (14.4%) | 2.62 |
| Total Families | 6,370 (100.0%) | 2.90 |
Median Household Size in Mandan
The median household size in Mandan is 2.42 persons per household, with single male/father households (306 | 3.1%) accounting for the largest median household size of 3.92 persons per household. non-family households (3,376 | 34.6%) represent the smallest median household size with 1.38 persons per household.
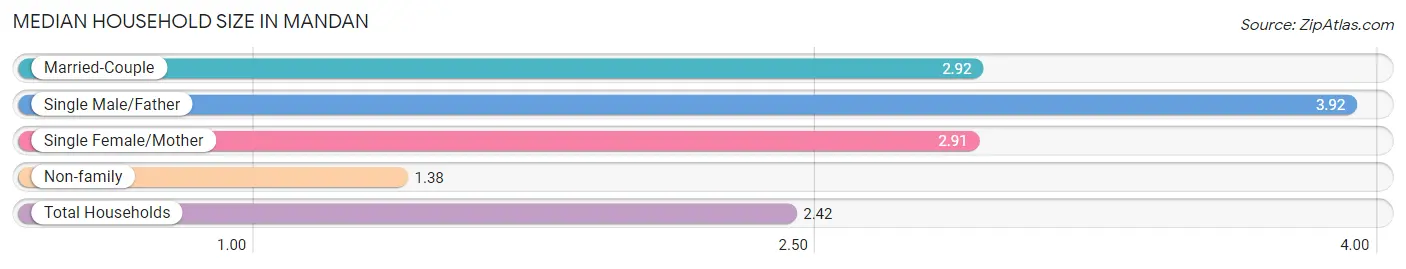
| Household Type | # Households | Household Size |
| Married-Couple | 5,147 (52.8%) | 2.92 |
| Single Male/Father | 306 (3.1%) | 3.92 |
| Single Female/Mother | 917 (9.4%) | 2.91 |
| Non-family | 3,376 (34.6%) | 1.38 |
| Total Households | 9,746 (100.0%) | 2.42 |
Household Size by Marriage Status in Mandan
Out of a total of 9,746 households in Mandan, 6,370 (65.4%) are family households, while 3,376 (34.6%) are nonfamily households. The most numerous type of family households are 2-person households, comprising 3,098, and the most common type of nonfamily households are 1-person households, comprising 2,532.
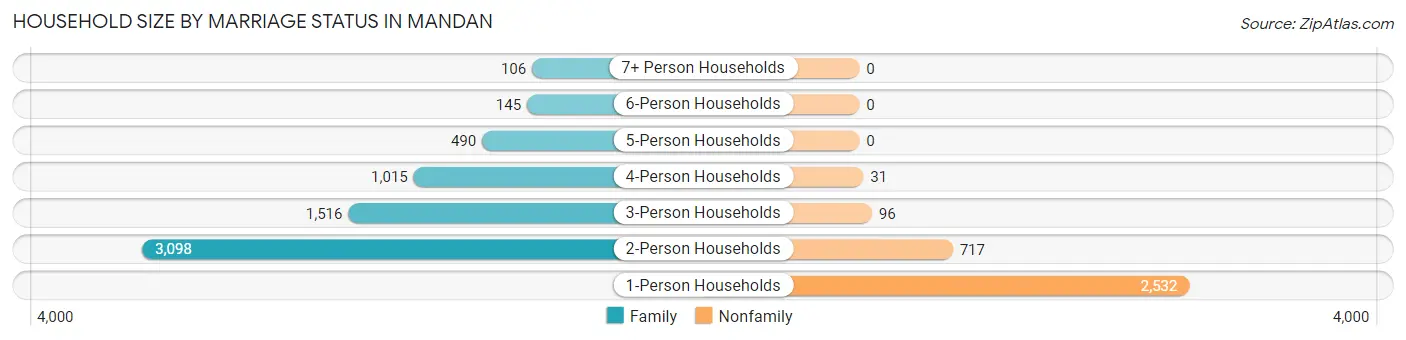
| Household Size | Family Households | Nonfamily Households |
| 1-Person Households | - | 2,532 (26.0%) |
| 2-Person Households | 3,098 (31.8%) | 717 (7.4%) |
| 3-Person Households | 1,516 (15.6%) | 96 (1.0%) |
| 4-Person Households | 1,015 (10.4%) | 31 (0.3%) |
| 5-Person Households | 490 (5.0%) | 0 (0.0%) |
| 6-Person Households | 145 (1.5%) | 0 (0.0%) |
| 7+ Person Households | 106 (1.1%) | 0 (0.0%) |
| Total | 6,370 (65.4%) | 3,376 (34.6%) |
Female Fertility in Mandan
Fertility by Age in Mandan
Average fertility rate in Mandan is 66.0 births per 1,000 women. Women in the age bracket of 20 to 34 years have the highest fertility rate with 134.0 births per 1,000 women. Women in the age bracket of 20 to 34 years acount for 95.1% of all women with births.
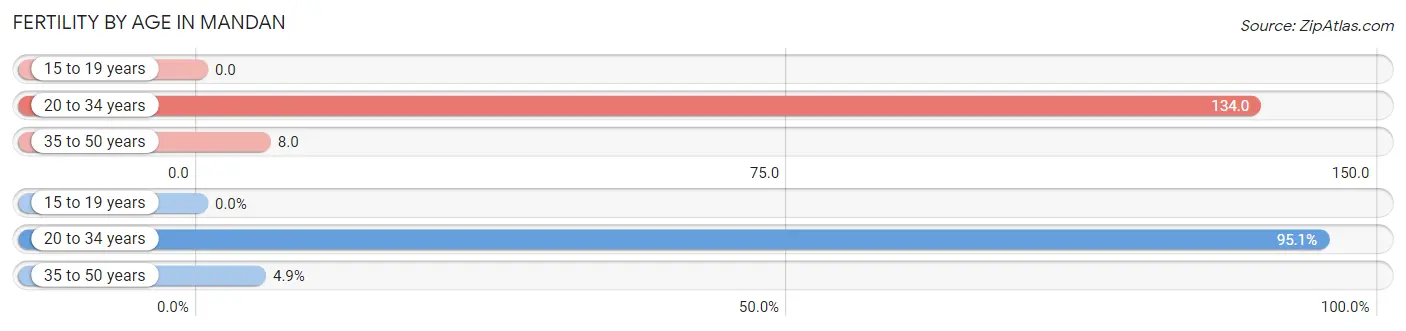
| Age Bracket | Women with Births | Births / 1,000 Women |
| 15 to 19 years | 0 (0.0%) | 0.0 |
| 20 to 34 years | 348 (95.1%) | 134.0 |
| 35 to 50 years | 18 (4.9%) | 8.0 |
| Total | 366 (100.0%) | 66.0 |
Fertility by Age by Marriage Status in Mandan
77.3% of women with births (366) in Mandan are married. The highest percentage of unmarried women with births falls into 35 to 50 years age bracket with 100.0% of them unmarried at the time of birth, while the lowest percentage of unmarried women with births belong to 20 to 34 years age bracket with 18.7% of them unmarried.
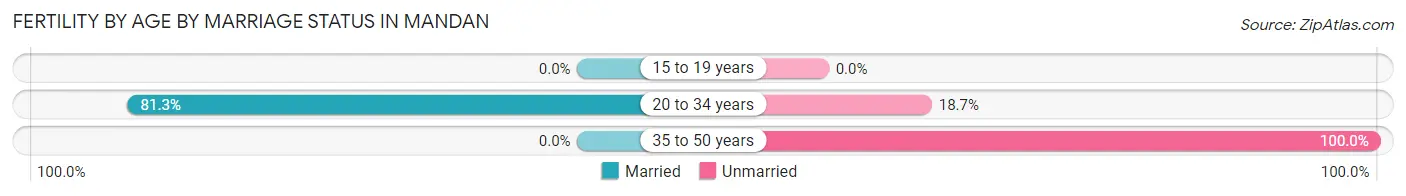
| Age Bracket | Married | Unmarried |
| 15 to 19 years | 0 (0.0%) | 0 (0.0%) |
| 20 to 34 years | 283 (81.3%) | 65 (18.7%) |
| 35 to 50 years | 0 (0.0%) | 18 (100.0%) |
| Total | 283 (77.3%) | 83 (22.7%) |
Fertility by Education in Mandan
Average fertility rate in Mandan is 66.0 births per 1,000 women. Women with the education attainment of less than high school have the highest fertility rate of 112.0 births per 1,000 women, while women with the education attainment of college or associate's degree have the lowest fertility at 31.0 births per 1,000 women. Women with the education attainment of bachelor's degree represent 40.7% of all women with births.
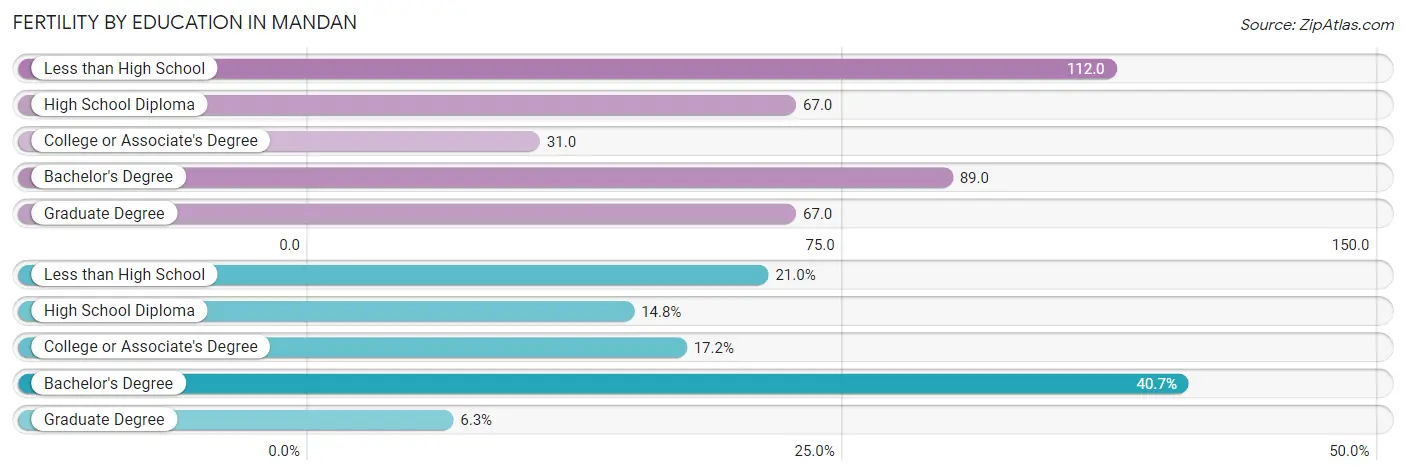
| Educational Attainment | Women with Births | Births / 1,000 Women |
| Less than High School | 77 (21.0%) | 112.0 |
| High School Diploma | 54 (14.7%) | 67.0 |
| College or Associate's Degree | 63 (17.2%) | 31.0 |
| Bachelor's Degree | 149 (40.7%) | 89.0 |
| Graduate Degree | 23 (6.3%) | 67.0 |
| Total | 366 (100.0%) | 66.0 |
Fertility by Education by Marriage Status in Mandan
22.7% of women with births in Mandan are unmarried. Women with the educational attainment of college or associate's degree are most likely to be married with 100.0% of them married at childbirth, while women with the educational attainment of high school diploma are least likely to be married with 33.3% of them unmarried at childbirth.
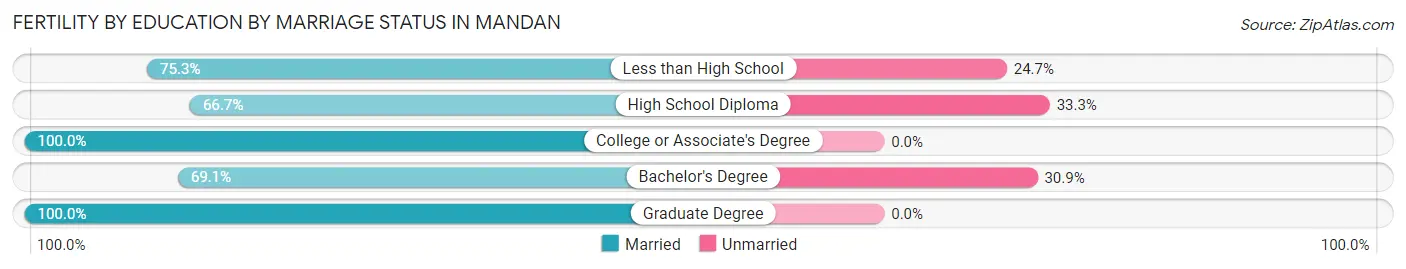
| Educational Attainment | Married | Unmarried |
| Less than High School | 58 (75.3%) | 19 (24.7%) |
| High School Diploma | 36 (66.7%) | 18 (33.3%) |
| College or Associate's Degree | 63 (100.0%) | 0 (0.0%) |
| Bachelor's Degree | 103 (69.1%) | 46 (30.9%) |
| Graduate Degree | 23 (100.0%) | 0 (0.0%) |
| Total | 283 (77.3%) | 83 (22.7%) |
Employment Characteristics in Mandan
Employment by Class of Employer in Mandan
Among the 13,684 employed individuals in Mandan, private company employees (8,411 | 61.5%), local government employees (1,368 | 10.0%), and not-for-profit organizations (1,224 | 8.9%) make up the most common classes of employment.
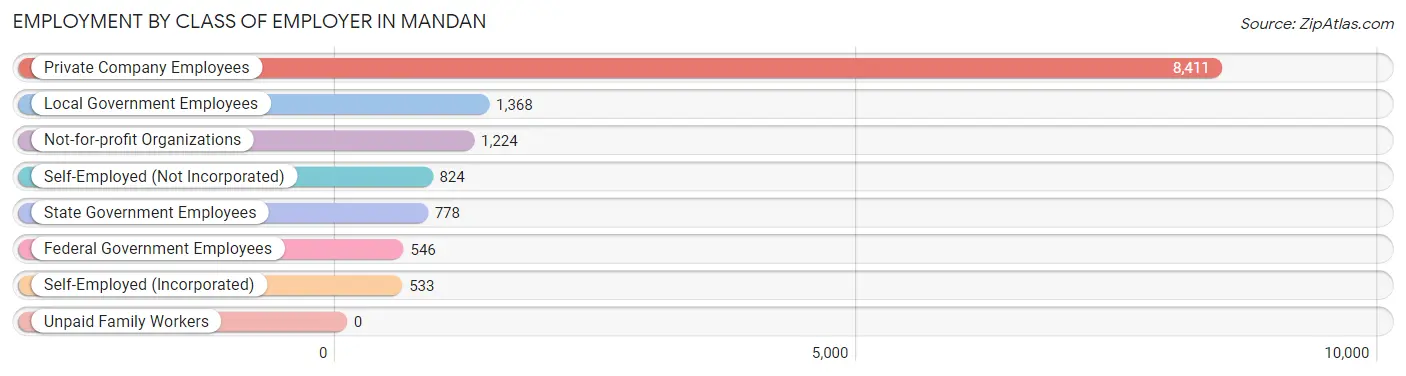
| Employer Class | # Employees | % Employees |
| Private Company Employees | 8,411 | 61.5% |
| Self-Employed (Incorporated) | 533 | 3.9% |
| Self-Employed (Not Incorporated) | 824 | 6.0% |
| Not-for-profit Organizations | 1,224 | 8.9% |
| Local Government Employees | 1,368 | 10.0% |
| State Government Employees | 778 | 5.7% |
| Federal Government Employees | 546 | 4.0% |
| Unpaid Family Workers | 0 | 0.0% |
| Total | 13,684 | 100.0% |
Employment Status by Age in Mandan
According to the labor force statistics for Mandan, out of the total population over 16 years of age (19,192), 73.1% or 14,029 individuals are in the labor force, with 2.0% or 281 of them unemployed. The age group with the highest labor force participation rate is 25 to 29 years, with 97.4% or 1,848 individuals in the labor force. Within the labor force, the 60 to 64 years age range has the highest percentage of unemployed individuals, with 5.6% or 41 of them being unemployed.
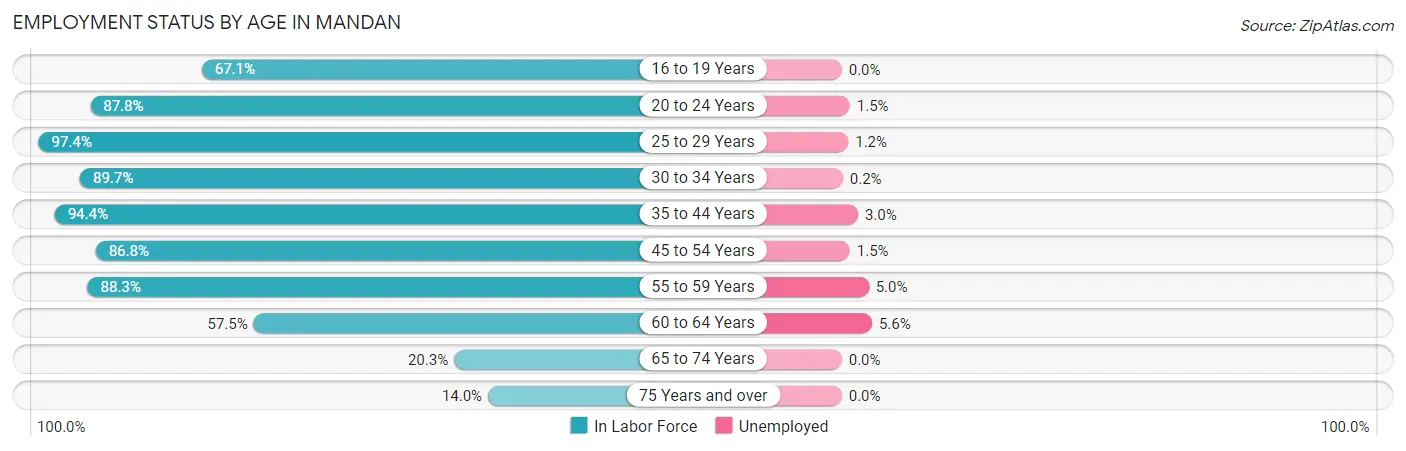
| Age Bracket | In Labor Force | Unemployed |
| 16 to 19 Years | 819 (67.1%) | 0 (0.0%) |
| 20 to 24 Years | 1,514 (87.8%) | 23 (1.5%) |
| 25 to 29 Years | 1,848 (97.4%) | 22 (1.2%) |
| 30 to 34 Years | 1,650 (89.7%) | 3 (0.2%) |
| 35 to 44 Years | 3,077 (94.4%) | 92 (3.0%) |
| 45 to 54 Years | 2,457 (86.8%) | 37 (1.5%) |
| 55 to 59 Years | 1,240 (88.3%) | 62 (5.0%) |
| 60 to 64 Years | 737 (57.5%) | 41 (5.6%) |
| 65 to 74 Years | 498 (20.3%) | 0 (0.0%) |
| 75 Years and over | 179 (14.0%) | 0 (0.0%) |
| Total | 14,029 (73.1%) | 281 (2.0%) |
Employment Status by Educational Attainment in Mandan
According to labor force statistics for Mandan, 88.0% of individuals (11,012) out of the total population between 25 and 64 years of age (12,514) are in the labor force, with 2.4% or 264 of them being unemployed. The group with the highest labor force participation rate are those with the educational attainment of bachelor's degree or higher, with 95.0% or 3,563 individuals in the labor force. Within the labor force, individuals with bachelor's degree or higher education have the highest percentage of unemployment, with 4.0% or 143 of them being unemployed.
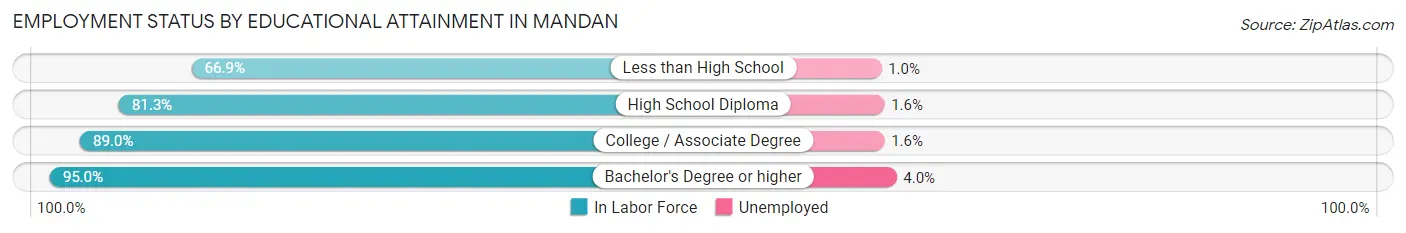
| Educational Attainment | In Labor Force | Unemployed |
| Less than High School | 382 (66.9%) | 6 (1.0%) |
| High School Diploma | 2,384 (81.3%) | 47 (1.6%) |
| College / Associate Degree | 4,681 (89.0%) | 84 (1.6%) |
| Bachelor's Degree or higher | 3,563 (95.0%) | 150 (4.0%) |
| Total | 11,012 (88.0%) | 300 (2.4%) |
Employment Occupations by Sex in Mandan
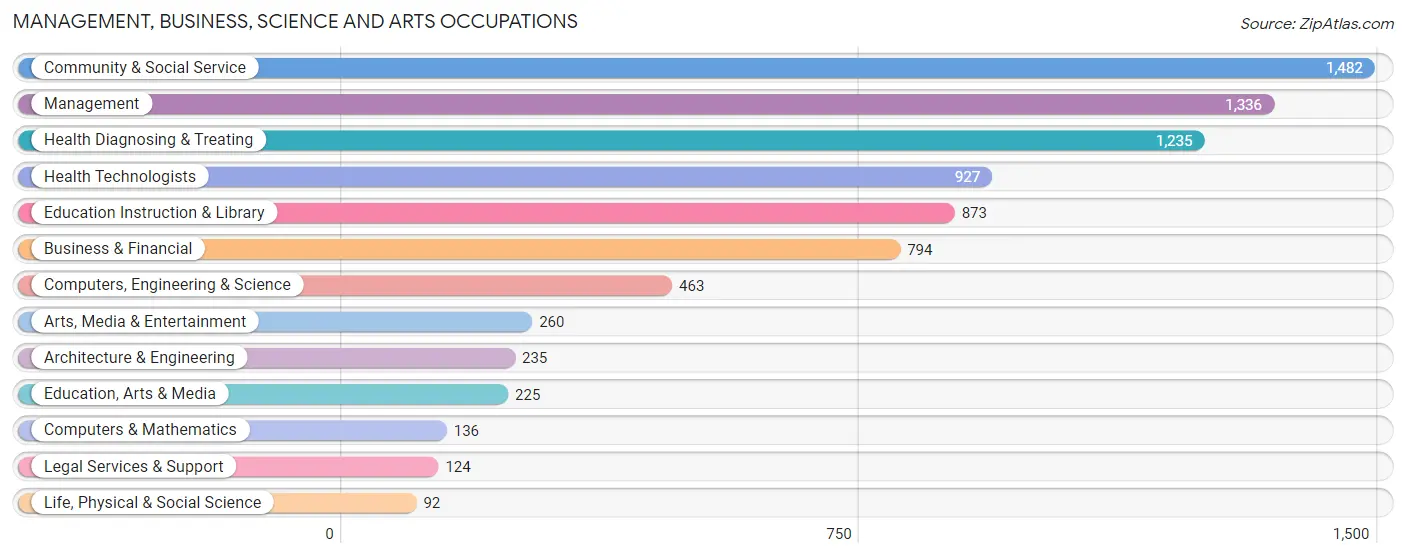
Management, Business, Science and Arts Occupations
The most common Management, Business, Science and Arts occupations in Mandan are Community & Social Service (1,482 | 10.8%), Management (1,336 | 9.8%), Health Diagnosing & Treating (1,235 | 9.0%), Health Technologists (927 | 6.8%), and Education Instruction & Library (873 | 6.4%).
Management, Business, Science and Arts Occupations by Sex
Within the Management, Business, Science and Arts occupations in Mandan, the most male-oriented occupations are Architecture & Engineering (89.8%), Arts, Media & Entertainment (75.0%), and Computers, Engineering & Science (72.8%), while the most female-oriented occupations are Education Instruction & Library (88.2%), Health Diagnosing & Treating (83.6%), and Health Technologists (82.2%).
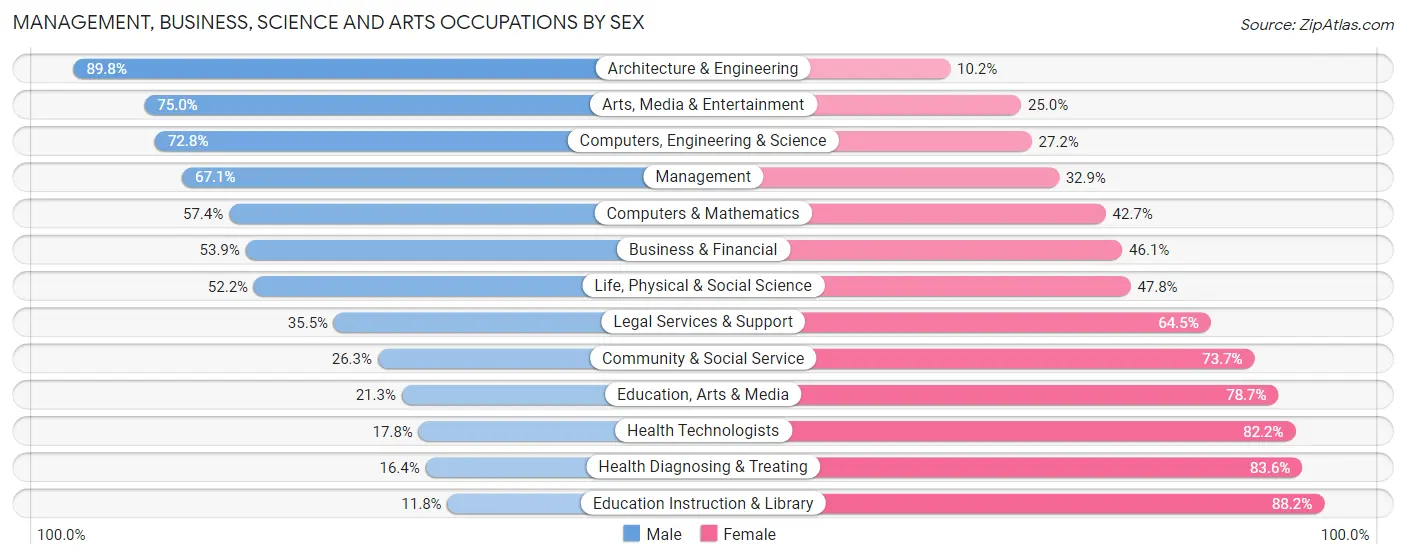
| Occupation | Male | Female |
| Management | 897 (67.1%) | 439 (32.9%) |
| Business & Financial | 428 (53.9%) | 366 (46.1%) |
| Computers, Engineering & Science | 337 (72.8%) | 126 (27.2%) |
| Computers & Mathematics | 78 (57.4%) | 58 (42.6%) |
| Architecture & Engineering | 211 (89.8%) | 24 (10.2%) |
| Life, Physical & Social Science | 48 (52.2%) | 44 (47.8%) |
| Community & Social Service | 390 (26.3%) | 1,092 (73.7%) |
| Education, Arts & Media | 48 (21.3%) | 177 (78.7%) |
| Legal Services & Support | 44 (35.5%) | 80 (64.5%) |
| Education Instruction & Library | 103 (11.8%) | 770 (88.2%) |
| Arts, Media & Entertainment | 195 (75.0%) | 65 (25.0%) |
| Health Diagnosing & Treating | 202 (16.4%) | 1,033 (83.6%) |
| Health Technologists | 165 (17.8%) | 762 (82.2%) |
| Total (Category) | 2,254 (42.4%) | 3,056 (57.6%) |
| Total (Overall) | 7,248 (53.0%) | 6,433 (47.0%) |
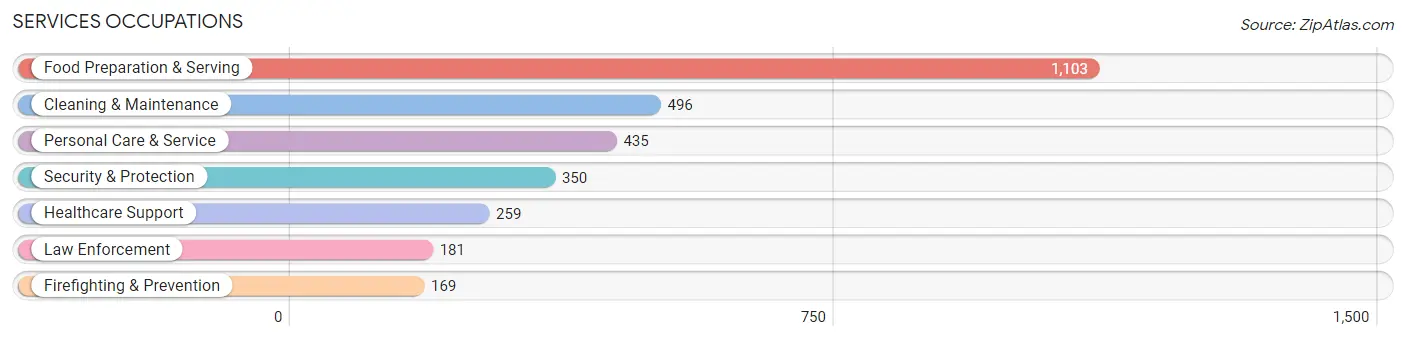
Services Occupations
The most common Services occupations in Mandan are Food Preparation & Serving (1,103 | 8.1%), Cleaning & Maintenance (496 | 3.6%), Personal Care & Service (435 | 3.2%), Security & Protection (350 | 2.6%), and Healthcare Support (259 | 1.9%).
Services Occupations by Sex
Within the Services occupations in Mandan, the most male-oriented occupations are Law Enforcement (100.0%), Security & Protection (81.7%), and Cleaning & Maintenance (68.8%), while the most female-oriented occupations are Personal Care & Service (91.9%), Healthcare Support (84.2%), and Food Preparation & Serving (46.5%).
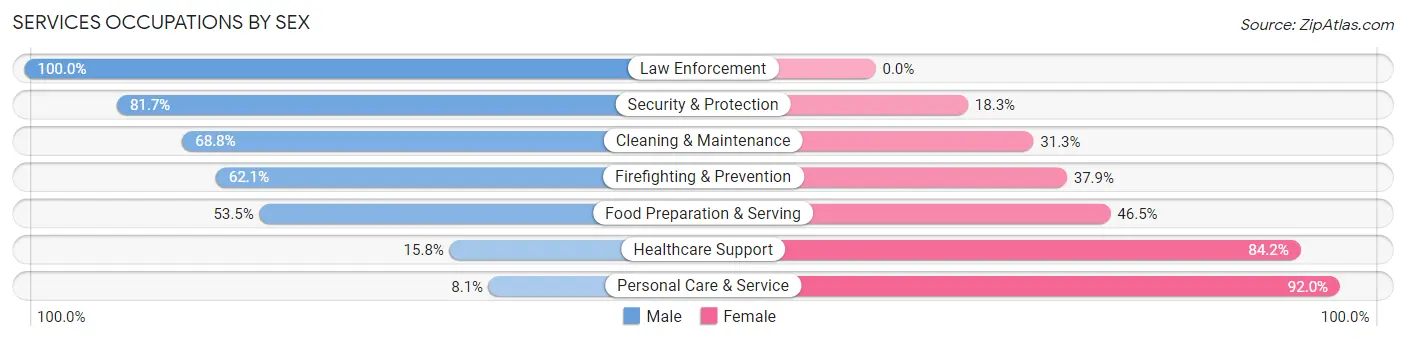
| Occupation | Male | Female |
| Healthcare Support | 41 (15.8%) | 218 (84.2%) |
| Security & Protection | 286 (81.7%) | 64 (18.3%) |
| Firefighting & Prevention | 105 (62.1%) | 64 (37.9%) |
| Law Enforcement | 181 (100.0%) | 0 (0.0%) |
| Food Preparation & Serving | 590 (53.5%) | 513 (46.5%) |
| Cleaning & Maintenance | 341 (68.8%) | 155 (31.2%) |
| Personal Care & Service | 35 (8.1%) | 400 (91.9%) |
| Total (Category) | 1,293 (48.9%) | 1,350 (51.1%) |
| Total (Overall) | 7,248 (53.0%) | 6,433 (47.0%) |
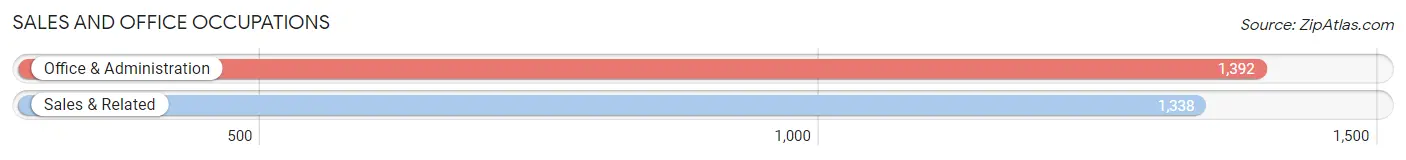
Sales and Office Occupations
The most common Sales and Office occupations in Mandan are Office & Administration (1,392 | 10.2%), and Sales & Related (1,338 | 9.8%).
Sales and Office Occupations by Sex
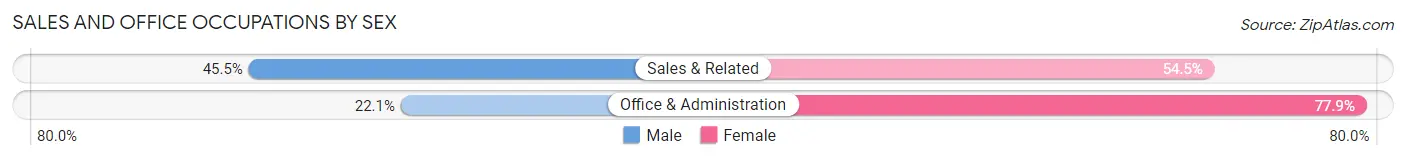
| Occupation | Male | Female |
| Sales & Related | 609 (45.5%) | 729 (54.5%) |
| Office & Administration | 308 (22.1%) | 1,084 (77.9%) |
| Total (Category) | 917 (33.6%) | 1,813 (66.4%) |
| Total (Overall) | 7,248 (53.0%) | 6,433 (47.0%) |
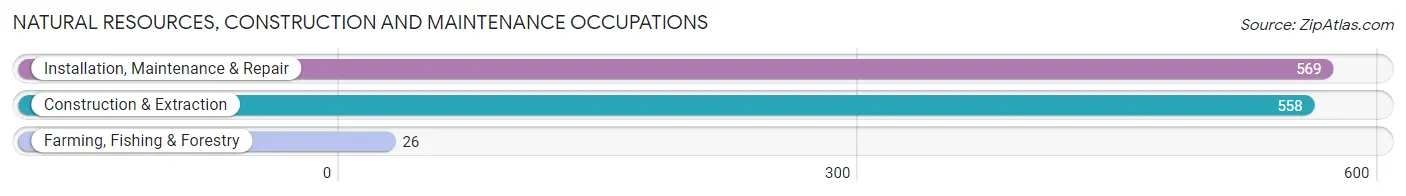
Natural Resources, Construction and Maintenance Occupations
The most common Natural Resources, Construction and Maintenance occupations in Mandan are Installation, Maintenance & Repair (569 | 4.2%), Construction & Extraction (558 | 4.1%), and Farming, Fishing & Forestry (26 | 0.2%).
Natural Resources, Construction and Maintenance Occupations by Sex
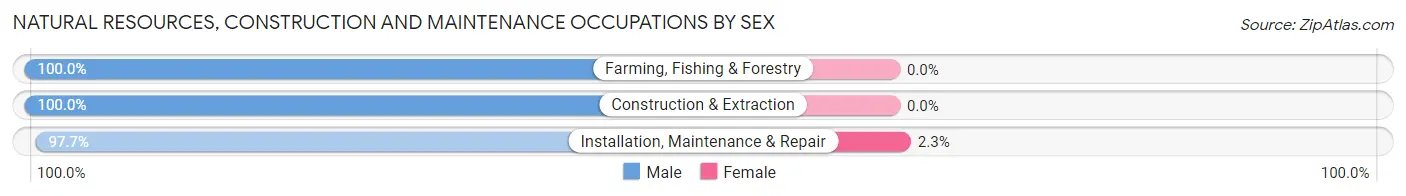
| Occupation | Male | Female |
| Farming, Fishing & Forestry | 26 (100.0%) | 0 (0.0%) |
| Construction & Extraction | 558 (100.0%) | 0 (0.0%) |
| Installation, Maintenance & Repair | 556 (97.7%) | 13 (2.3%) |
| Total (Category) | 1,140 (98.9%) | 13 (1.1%) |
| Total (Overall) | 7,248 (53.0%) | 6,433 (47.0%) |
Production, Transportation and Moving Occupations
The most common Production, Transportation and Moving occupations in Mandan are Production (1,064 | 7.8%), Material Moving (405 | 3.0%), and Transportation (376 | 2.8%).
Production, Transportation and Moving Occupations by Sex
| Occupation | Male | Female |
| Production | 978 (91.9%) | 86 (8.1%) |
| Transportation | 373 (99.2%) | 3 (0.8%) |
| Material Moving | 293 (72.4%) | 112 (27.7%) |
| Total (Category) | 1,644 (89.1%) | 201 (10.9%) |
| Total (Overall) | 7,248 (53.0%) | 6,433 (47.0%) |
Employment Industries by Sex in Mandan
Employment Industries in Mandan
The major employment industries in Mandan include Health Care & Social Assistance (2,130 | 15.6%), Retail Trade (1,664 | 12.2%), Educational Services (1,324 | 9.7%), Manufacturing (1,229 | 9.0%), and Accommodation & Food Services (1,056 | 7.7%).
Employment Industries by Sex in Mandan
The Mandan industries that see more men than women are Mining, Quarrying, & Extraction (100.0%), Construction (92.2%), and Utilities (86.6%), whereas the industries that tend to have a higher number of women are Health Care & Social Assistance (82.0%), Educational Services (70.8%), and Agriculture, Fishing & Hunting (70.2%).
| Industry | Male | Female |
| Agriculture, Fishing & Hunting | 20 (29.8%) | 47 (70.2%) |
| Mining, Quarrying, & Extraction | 257 (100.0%) | 0 (0.0%) |
| Construction | 888 (92.2%) | 75 (7.8%) |
| Manufacturing | 922 (75.0%) | 307 (25.0%) |
| Wholesale Trade | 85 (61.6%) | 53 (38.4%) |
| Retail Trade | 922 (55.4%) | 742 (44.6%) |
| Transportation & Warehousing | 288 (54.2%) | 243 (45.8%) |
| Utilities | 252 (86.6%) | 39 (13.4%) |
| Information | 67 (59.3%) | 46 (40.7%) |
| Finance & Insurance | 274 (39.0%) | 428 (61.0%) |
| Real Estate, Rental & Leasing | 114 (72.2%) | 44 (27.9%) |
| Professional & Scientific | 281 (51.5%) | 265 (48.5%) |
| Enterprise Management | 0 (0.0%) | 0 (0.0%) |
| Administrative & Support | 197 (67.5%) | 95 (32.5%) |
| Educational Services | 387 (29.2%) | 937 (70.8%) |
| Health Care & Social Assistance | 383 (18.0%) | 1,747 (82.0%) |
| Arts, Entertainment & Recreation | 164 (39.0%) | 257 (61.1%) |
| Accommodation & Food Services | 622 (58.9%) | 434 (41.1%) |
| Public Administration | 579 (62.4%) | 349 (37.6%) |
| Total | 7,248 (53.0%) | 6,433 (47.0%) |
Education in Mandan
School Enrollment in Mandan
The most common levels of schooling among the 5,624 students in Mandan are middle school (1,485 | 26.4%), college / undergraduate (1,102 | 19.6%), and high school (1,063 | 18.9%).
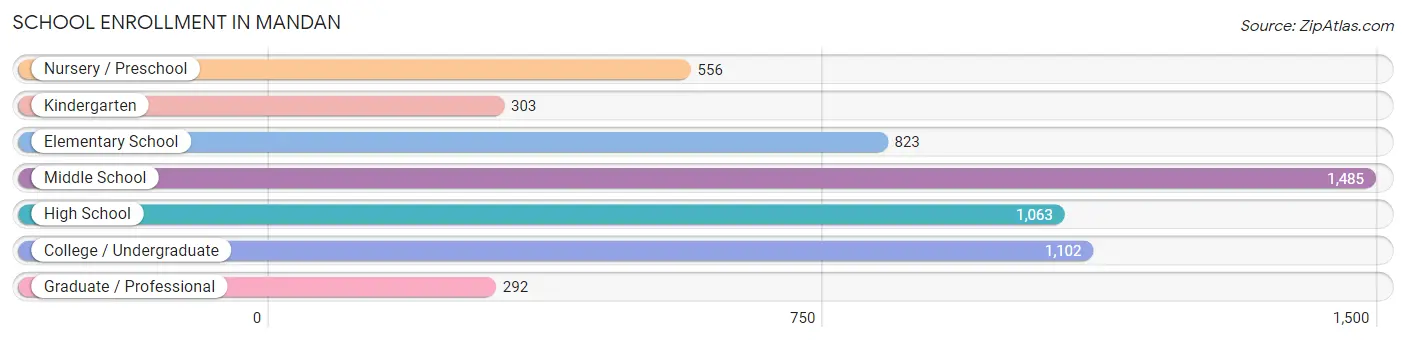
| School Level | # Students | % Students |
| Nursery / Preschool | 556 | 9.9% |
| Kindergarten | 303 | 5.4% |
| Elementary School | 823 | 14.6% |
| Middle School | 1,485 | 26.4% |
| High School | 1,063 | 18.9% |
| College / Undergraduate | 1,102 | 19.6% |
| Graduate / Professional | 292 | 5.2% |
| Total | 5,624 | 100.0% |
School Enrollment by Age by Funding Source in Mandan
Out of a total of 5,624 students who are enrolled in schools in Mandan, 557 (9.9%) attend a private institution, while the remaining 5,067 (90.1%) are enrolled in public schools. The age group of 25 to 34 year olds has the highest likelihood of being enrolled in private schools, with 94 (35.3% in the age bracket) enrolled. Conversely, the age group of 15 to 17 year olds has the lowest likelihood of being enrolled in a private school, with 909 (96.7% in the age bracket) attending a public institution.
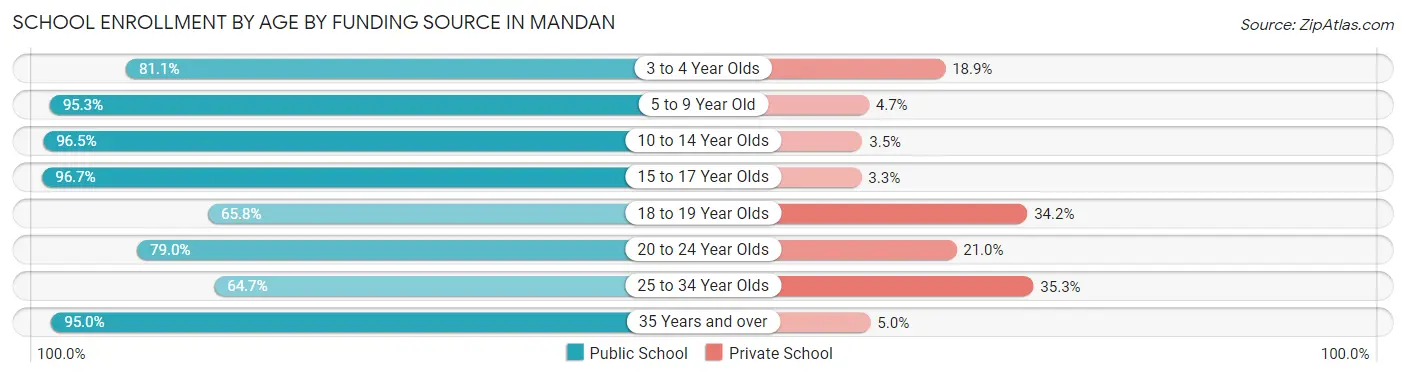
| Age Bracket | Public School | Private School |
| 3 to 4 Year Olds | 193 (81.1%) | 45 (18.9%) |
| 5 to 9 Year Old | 1,341 (95.3%) | 66 (4.7%) |
| 10 to 14 Year Olds | 1,470 (96.5%) | 53 (3.5%) |
| 15 to 17 Year Olds | 909 (96.7%) | 31 (3.3%) |
| 18 to 19 Year Olds | 231 (65.8%) | 120 (34.2%) |
| 20 to 24 Year Olds | 520 (79.0%) | 138 (21.0%) |
| 25 to 34 Year Olds | 172 (64.7%) | 94 (35.3%) |
| 35 Years and over | 229 (95.0%) | 12 (5.0%) |
| Total | 5,067 (90.1%) | 557 (9.9%) |
Educational Attainment by Field of Study in Mandan
Science & technology (1,181 | 23.6%), business (978 | 19.5%), education (788 | 15.7%), arts & humanities (581 | 11.6%), and bio, nature & agricultural (284 | 5.7%) are the most common fields of study among 5,009 individuals in Mandan who have obtained a bachelor's degree or higher.
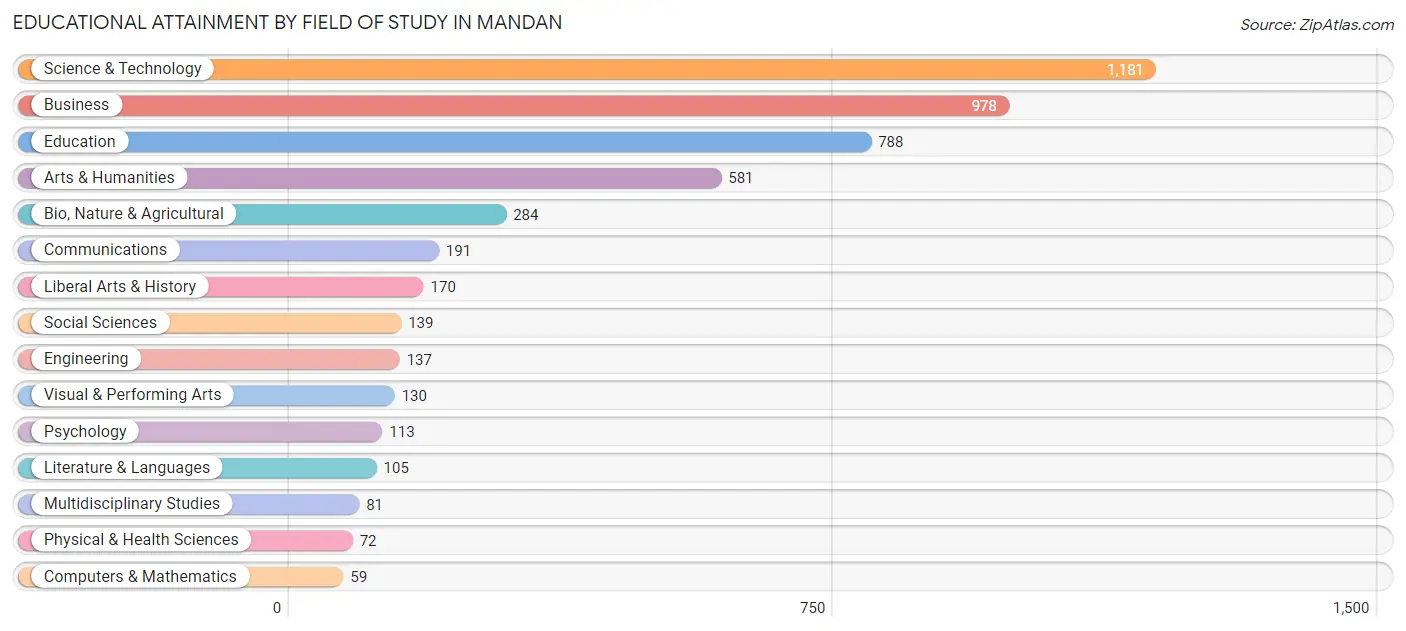
| Field of Study | # Graduates | % Graduates |
| Computers & Mathematics | 59 | 1.2% |
| Bio, Nature & Agricultural | 284 | 5.7% |
| Physical & Health Sciences | 72 | 1.4% |
| Psychology | 113 | 2.3% |
| Social Sciences | 139 | 2.8% |
| Engineering | 137 | 2.7% |
| Multidisciplinary Studies | 81 | 1.6% |
| Science & Technology | 1,181 | 23.6% |
| Business | 978 | 19.5% |
| Education | 788 | 15.7% |
| Literature & Languages | 105 | 2.1% |
| Liberal Arts & History | 170 | 3.4% |
| Visual & Performing Arts | 130 | 2.6% |
| Communications | 191 | 3.8% |
| Arts & Humanities | 581 | 11.6% |
| Total | 5,009 | 100.0% |
Transportation & Commute in Mandan
Vehicle Availability by Sex in Mandan
The most prevalent vehicle ownership categories in Mandan are males with 2 vehicles (2,679, accounting for 36.9%) and females with 2 vehicles (2,484, making up 41.8%).
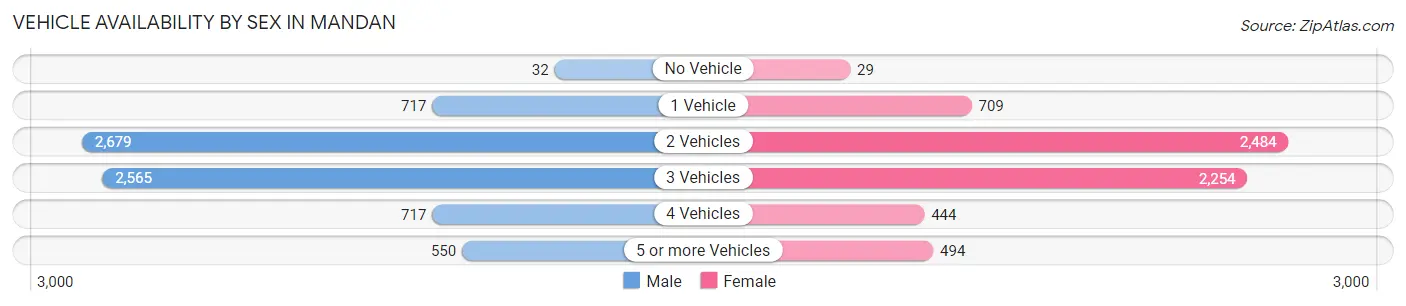
| Vehicles Available | Male | Female |
| No Vehicle | 32 (0.4%) | 29 (0.4%) |
| 1 Vehicle | 717 (9.9%) | 709 (11.1%) |
| 2 Vehicles | 2,679 (36.9%) | 2,484 (38.7%) |
| 3 Vehicles | 2,565 (35.3%) | 2,254 (35.1%) |
| 4 Vehicles | 717 (9.9%) | 444 (6.9%) |
| 5 or more Vehicles | 550 (7.6%) | 494 (7.7%) |
| Total | 7,260 (100.0%) | 6,414 (100.0%) |
Commute Time in Mandan
The most frequently occuring commute durations in Mandan are 15 to 19 minutes (4,020 commuters, 31.5%), 10 to 14 minutes (3,286 commuters, 25.7%), and 20 to 24 minutes (1,620 commuters, 12.7%).
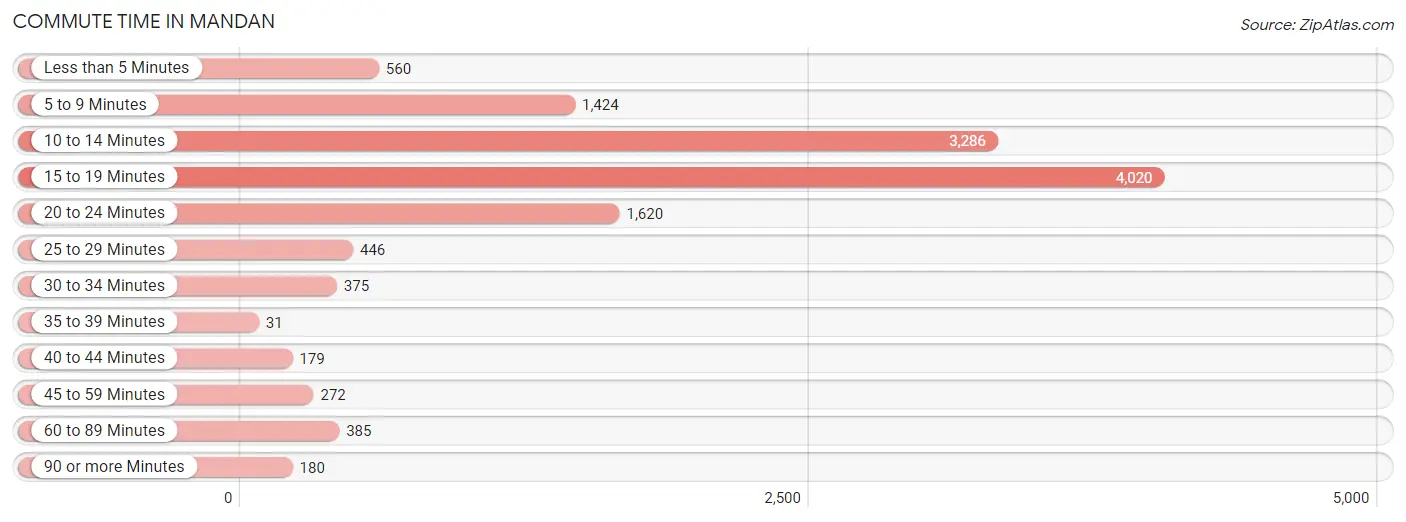
| Commute Time | # Commuters | % Commuters |
| Less than 5 Minutes | 560 | 4.4% |
| 5 to 9 Minutes | 1,424 | 11.1% |
| 10 to 14 Minutes | 3,286 | 25.7% |
| 15 to 19 Minutes | 4,020 | 31.5% |
| 20 to 24 Minutes | 1,620 | 12.7% |
| 25 to 29 Minutes | 446 | 3.5% |
| 30 to 34 Minutes | 375 | 2.9% |
| 35 to 39 Minutes | 31 | 0.2% |
| 40 to 44 Minutes | 179 | 1.4% |
| 45 to 59 Minutes | 272 | 2.1% |
| 60 to 89 Minutes | 385 | 3.0% |
| 90 or more Minutes | 180 | 1.4% |
Commute Time by Sex in Mandan
The most common commute times in Mandan are 15 to 19 minutes (2,048 commuters, 29.8%) for males and 15 to 19 minutes (1,972 commuters, 33.4%) for females.
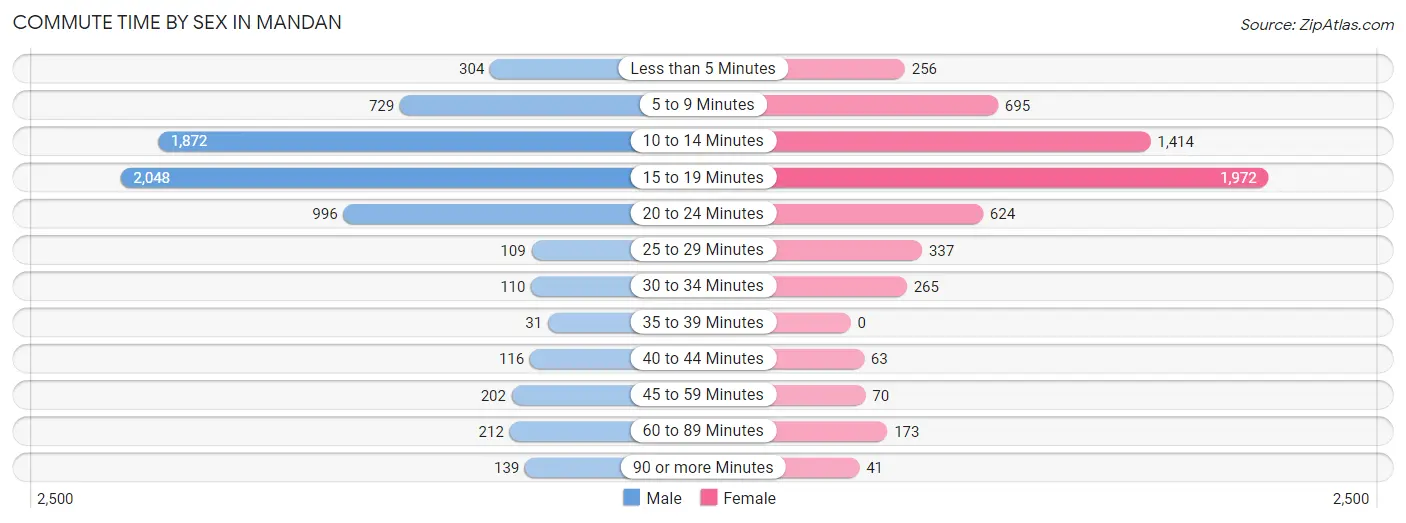
| Commute Time | Male | Female |
| Less than 5 Minutes | 304 (4.4%) | 256 (4.3%) |
| 5 to 9 Minutes | 729 (10.6%) | 695 (11.8%) |
| 10 to 14 Minutes | 1,872 (27.3%) | 1,414 (23.9%) |
| 15 to 19 Minutes | 2,048 (29.8%) | 1,972 (33.4%) |
| 20 to 24 Minutes | 996 (14.5%) | 624 (10.6%) |
| 25 to 29 Minutes | 109 (1.6%) | 337 (5.7%) |
| 30 to 34 Minutes | 110 (1.6%) | 265 (4.5%) |
| 35 to 39 Minutes | 31 (0.4%) | 0 (0.0%) |
| 40 to 44 Minutes | 116 (1.7%) | 63 (1.1%) |
| 45 to 59 Minutes | 202 (2.9%) | 70 (1.2%) |
| 60 to 89 Minutes | 212 (3.1%) | 173 (2.9%) |
| 90 or more Minutes | 139 (2.0%) | 41 (0.7%) |
Time of Departure to Work by Sex in Mandan
The most frequent times of departure to work in Mandan are 7:00 AM to 7:29 AM (1,050, 15.3%) for males and 7:30 AM to 7:59 AM (1,103, 18.7%) for females.
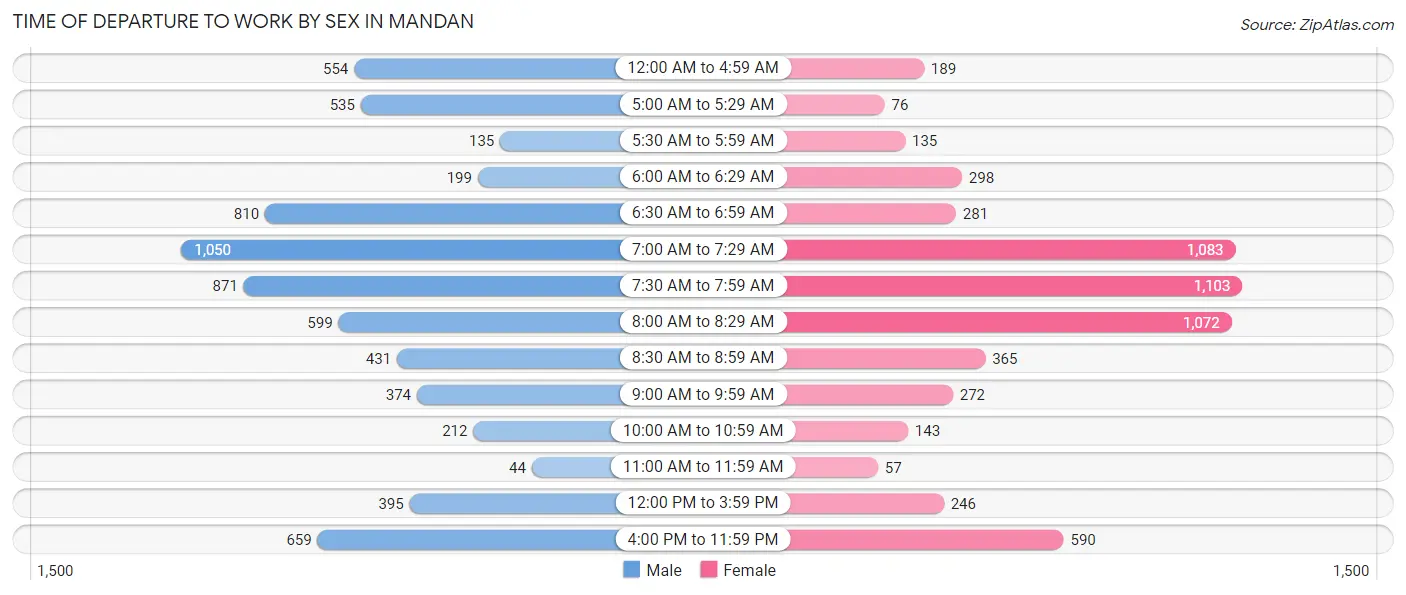
| Time of Departure | Male | Female |
| 12:00 AM to 4:59 AM | 554 (8.1%) | 189 (3.2%) |
| 5:00 AM to 5:29 AM | 535 (7.8%) | 76 (1.3%) |
| 5:30 AM to 5:59 AM | 135 (2.0%) | 135 (2.3%) |
| 6:00 AM to 6:29 AM | 199 (2.9%) | 298 (5.0%) |
| 6:30 AM to 6:59 AM | 810 (11.8%) | 281 (4.8%) |
| 7:00 AM to 7:29 AM | 1,050 (15.3%) | 1,083 (18.3%) |
| 7:30 AM to 7:59 AM | 871 (12.7%) | 1,103 (18.7%) |
| 8:00 AM to 8:29 AM | 599 (8.7%) | 1,072 (18.1%) |
| 8:30 AM to 8:59 AM | 431 (6.3%) | 365 (6.2%) |
| 9:00 AM to 9:59 AM | 374 (5.4%) | 272 (4.6%) |
| 10:00 AM to 10:59 AM | 212 (3.1%) | 143 (2.4%) |
| 11:00 AM to 11:59 AM | 44 (0.6%) | 57 (1.0%) |
| 12:00 PM to 3:59 PM | 395 (5.8%) | 246 (4.2%) |
| 4:00 PM to 11:59 PM | 659 (9.6%) | 590 (10.0%) |
| Total | 6,868 (100.0%) | 5,910 (100.0%) |
Housing Occupancy in Mandan
Occupancy by Ownership in Mandan
Of the total 9,746 dwellings in Mandan, owner-occupied units account for 6,624 (68.0%), while renter-occupied units make up 3,122 (32.0%).
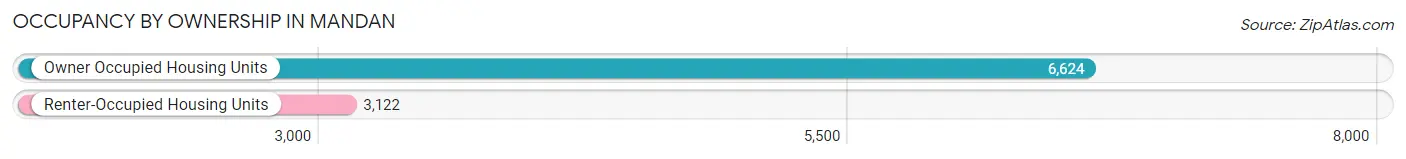
| Occupancy | # Housing Units | % Housing Units |
| Owner Occupied Housing Units | 6,624 | 68.0% |
| Renter-Occupied Housing Units | 3,122 | 32.0% |
| Total Occupied Housing Units | 9,746 | 100.0% |
Occupancy by Household Size in Mandan
| Household Size | # Housing Units | % Housing Units |
| 1-Person Household | 2,532 | 26.0% |
| 2-Person Household | 3,815 | 39.1% |
| 3-Person Household | 1,612 | 16.5% |
| 4+ Person Household | 1,787 | 18.3% |
| Total Housing Units | 9,746 | 100.0% |
Occupancy by Ownership by Household Size in Mandan
| Household Size | Owner-occupied | Renter-occupied |
| 1-Person Household | 1,289 (50.9%) | 1,243 (49.1%) |
| 2-Person Household | 2,960 (77.6%) | 855 (22.4%) |
| 3-Person Household | 1,084 (67.2%) | 528 (32.8%) |
| 4+ Person Household | 1,291 (72.2%) | 496 (27.8%) |
| Total Housing Units | 6,624 (68.0%) | 3,122 (32.0%) |
Occupancy by Educational Attainment in Mandan
| Household Size | Owner-occupied | Renter-occupied |
| Less than High School | 178 (34.0%) | 346 (66.0%) |
| High School Diploma | 1,451 (60.0%) | 967 (40.0%) |
| College/Associate Degree | 2,578 (68.0%) | 1,214 (32.0%) |
| Bachelor's Degree or higher | 2,417 (80.2%) | 595 (19.8%) |
Occupancy by Age of Householder in Mandan
| Age Bracket | # Households | % Households |
| Under 35 Years | 2,577 | 26.4% |
| 35 to 44 Years | 1,575 | 16.2% |
| 45 to 54 Years | 1,743 | 17.9% |
| 55 to 64 Years | 1,412 | 14.5% |
| 65 to 74 Years | 1,595 | 16.4% |
| 75 to 84 Years | 720 | 7.4% |
| 85 Years and Over | 124 | 1.3% |
| Total | 9,746 | 100.0% |
Housing Finances in Mandan
Median Income by Occupancy in Mandan
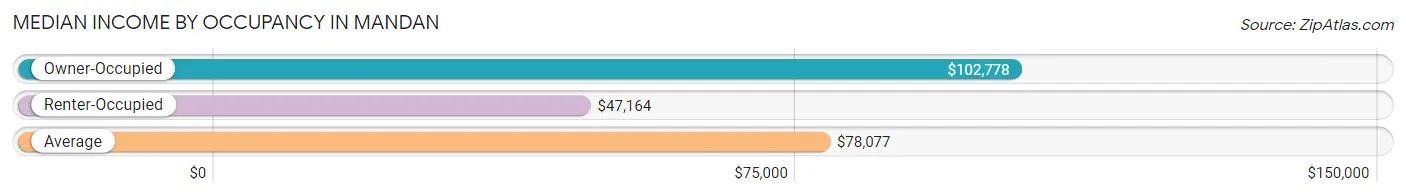
| Occupancy Type | # Households | Median Income |
| Owner-Occupied | 6,624 (68.0%) | $102,778 |
| Renter-Occupied | 3,122 (32.0%) | $47,164 |
| Average | 9,746 (100.0%) | $78,077 |
Occupancy by Householder Income Bracket in Mandan
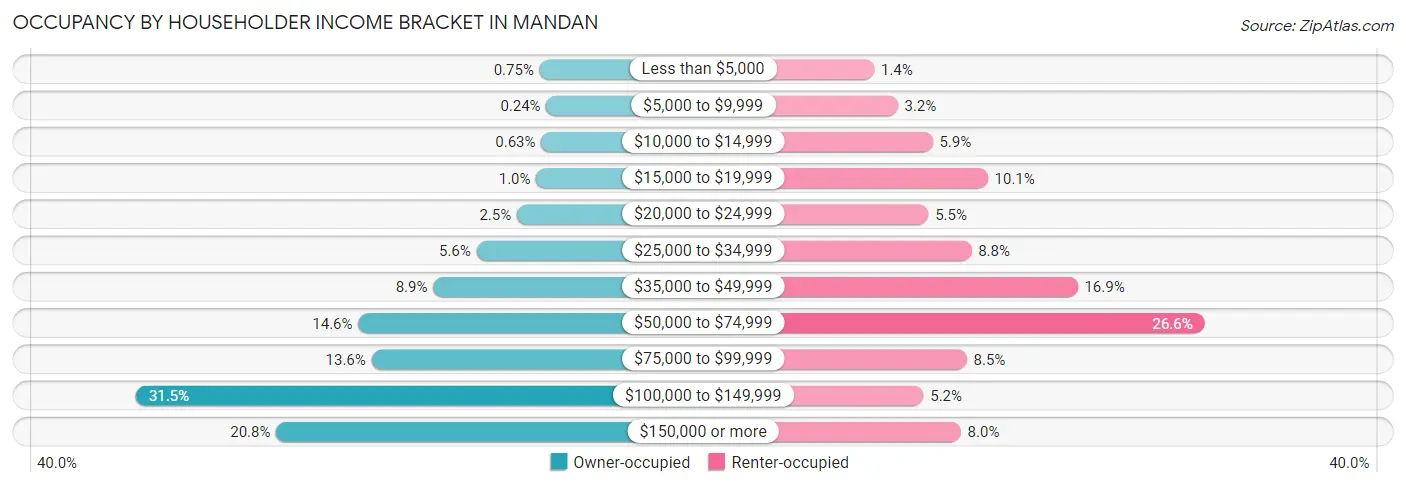
| Income Bracket | Owner-occupied | Renter-occupied |
| Less than $5,000 | 50 (0.7%) | 44 (1.4%) |
| $5,000 to $9,999 | 16 (0.2%) | 100 (3.2%) |
| $10,000 to $14,999 | 42 (0.6%) | 183 (5.9%) |
| $15,000 to $19,999 | 67 (1.0%) | 314 (10.1%) |
| $20,000 to $24,999 | 164 (2.5%) | 173 (5.5%) |
| $25,000 to $34,999 | 368 (5.6%) | 275 (8.8%) |
| $35,000 to $49,999 | 587 (8.9%) | 528 (16.9%) |
| $50,000 to $74,999 | 965 (14.6%) | 830 (26.6%) |
| $75,000 to $99,999 | 898 (13.6%) | 264 (8.5%) |
| $100,000 to $149,999 | 2,088 (31.5%) | 161 (5.2%) |
| $150,000 or more | 1,379 (20.8%) | 250 (8.0%) |
| Total | 6,624 (100.0%) | 3,122 (100.0%) |
Monthly Housing Cost Tiers in Mandan
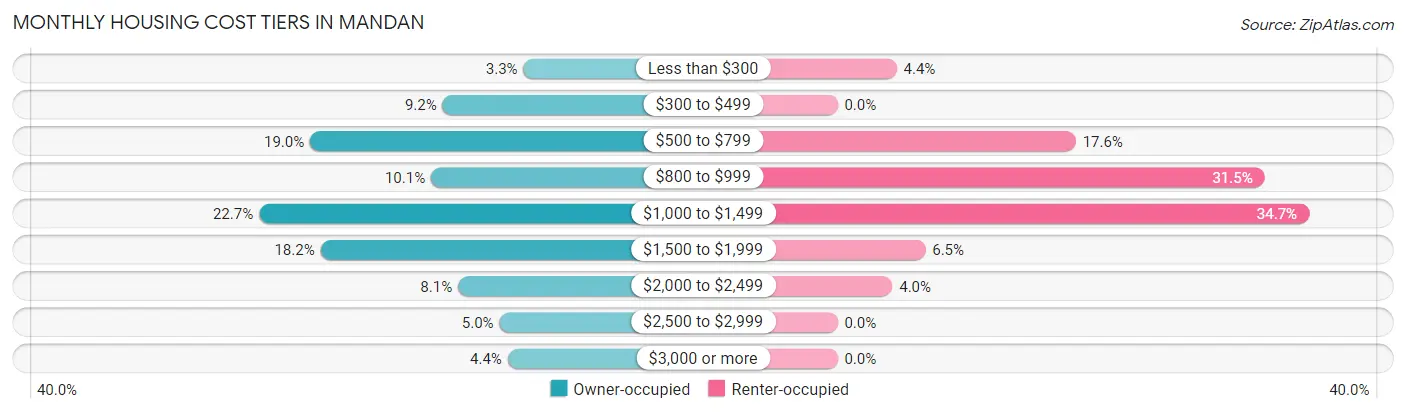
| Monthly Cost | Owner-occupied | Renter-occupied |
| Less than $300 | 216 (3.3%) | 136 (4.4%) |
| $300 to $499 | 611 (9.2%) | 0 (0.0%) |
| $500 to $799 | 1,257 (19.0%) | 548 (17.5%) |
| $800 to $999 | 667 (10.1%) | 982 (31.5%) |
| $1,000 to $1,499 | 1,506 (22.7%) | 1,084 (34.7%) |
| $1,500 to $1,999 | 1,206 (18.2%) | 202 (6.5%) |
| $2,000 to $2,499 | 535 (8.1%) | 126 (4.0%) |
| $2,500 to $2,999 | 333 (5.0%) | 0 (0.0%) |
| $3,000 or more | 293 (4.4%) | 0 (0.0%) |
| Total | 6,624 (100.0%) | 3,122 (100.0%) |
Physical Housing Characteristics in Mandan
Housing Structures in Mandan
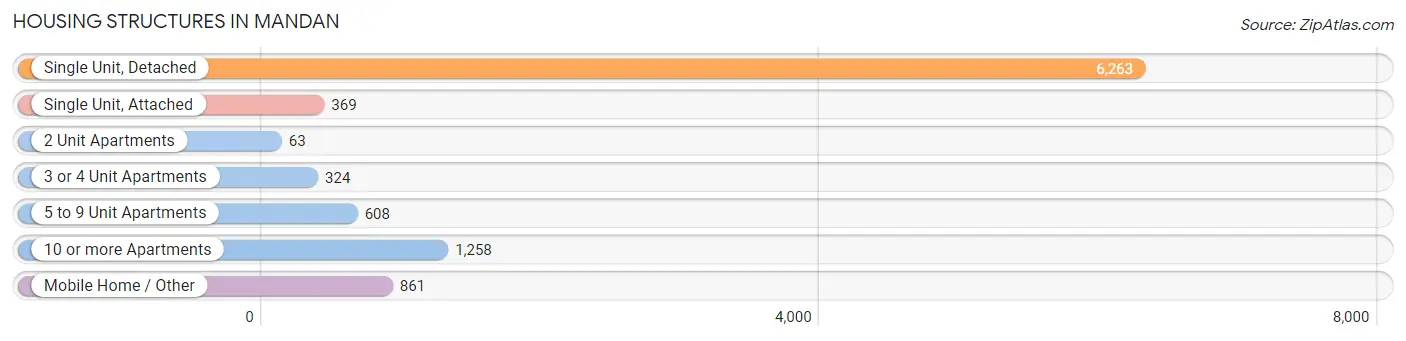
| Structure Type | # Housing Units | % Housing Units |
| Single Unit, Detached | 6,263 | 64.3% |
| Single Unit, Attached | 369 | 3.8% |
| 2 Unit Apartments | 63 | 0.6% |
| 3 or 4 Unit Apartments | 324 | 3.3% |
| 5 to 9 Unit Apartments | 608 | 6.2% |
| 10 or more Apartments | 1,258 | 12.9% |
| Mobile Home / Other | 861 | 8.8% |
| Total | 9,746 | 100.0% |
Housing Structures by Occupancy in Mandan
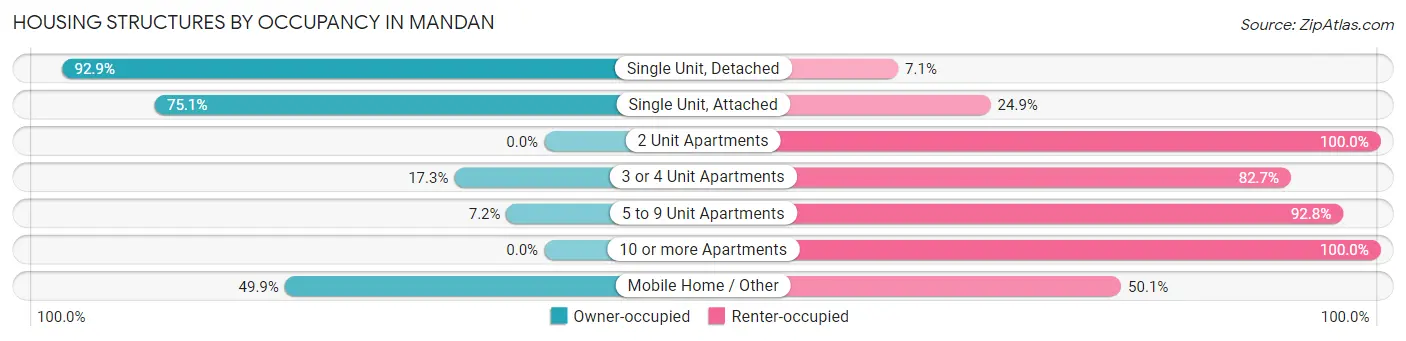
| Structure Type | Owner-occupied | Renter-occupied |
| Single Unit, Detached | 5,817 (92.9%) | 446 (7.1%) |
| Single Unit, Attached | 277 (75.1%) | 92 (24.9%) |
| 2 Unit Apartments | 0 (0.0%) | 63 (100.0%) |
| 3 or 4 Unit Apartments | 56 (17.3%) | 268 (82.7%) |
| 5 to 9 Unit Apartments | 44 (7.2%) | 564 (92.8%) |
| 10 or more Apartments | 0 (0.0%) | 1,258 (100.0%) |
| Mobile Home / Other | 430 (49.9%) | 431 (50.1%) |
| Total | 6,624 (68.0%) | 3,122 (32.0%) |
Housing Structures by Number of Rooms in Mandan
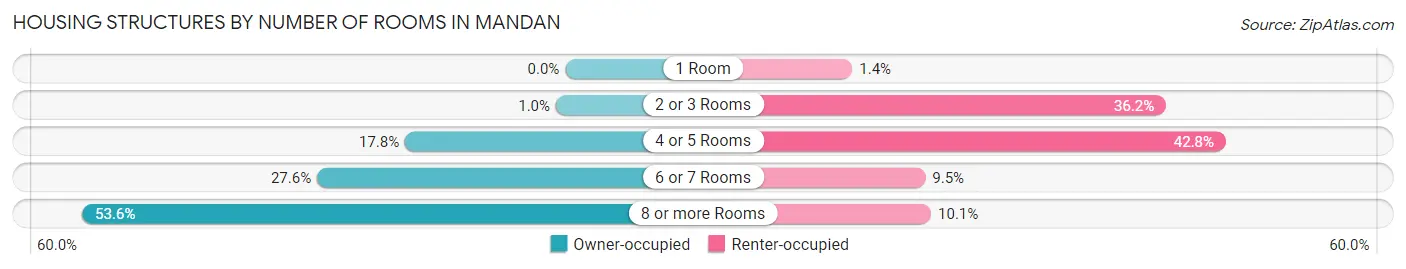
| Number of Rooms | Owner-occupied | Renter-occupied |
| 1 Room | 0 (0.0%) | 43 (1.4%) |
| 2 or 3 Rooms | 69 (1.0%) | 1,130 (36.2%) |
| 4 or 5 Rooms | 1,178 (17.8%) | 1,337 (42.8%) |
| 6 or 7 Rooms | 1,825 (27.6%) | 296 (9.5%) |
| 8 or more Rooms | 3,552 (53.6%) | 316 (10.1%) |
| Total | 6,624 (100.0%) | 3,122 (100.0%) |
Housing Structure by Heating Type in Mandan
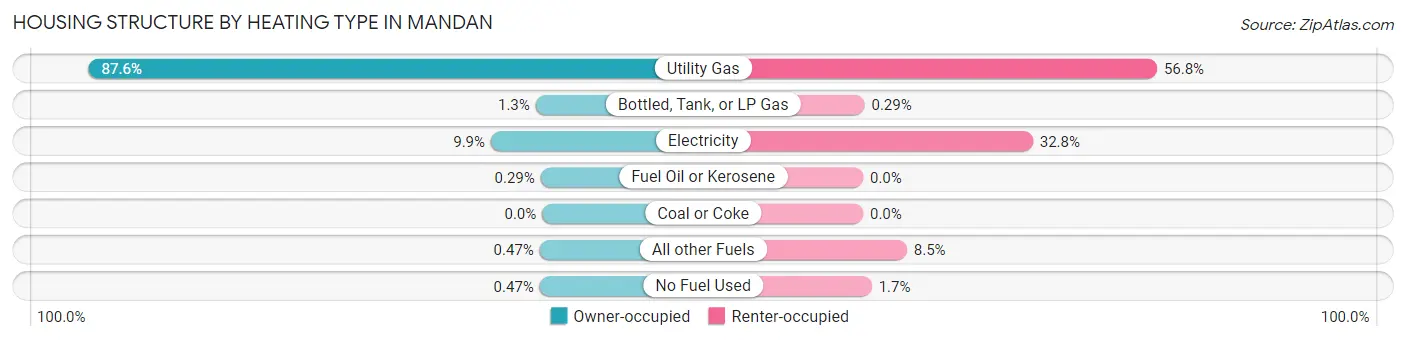
| Heating Type | Owner-occupied | Renter-occupied |
| Utility Gas | 5,804 (87.6%) | 1,773 (56.8%) |
| Bottled, Tank, or LP Gas | 83 (1.3%) | 9 (0.3%) |
| Electricity | 656 (9.9%) | 1,024 (32.8%) |
| Fuel Oil or Kerosene | 19 (0.3%) | 0 (0.0%) |
| Coal or Coke | 0 (0.0%) | 0 (0.0%) |
| All other Fuels | 31 (0.5%) | 264 (8.5%) |
| No Fuel Used | 31 (0.5%) | 52 (1.7%) |
| Total | 6,624 (100.0%) | 3,122 (100.0%) |
Household Vehicle Usage in Mandan
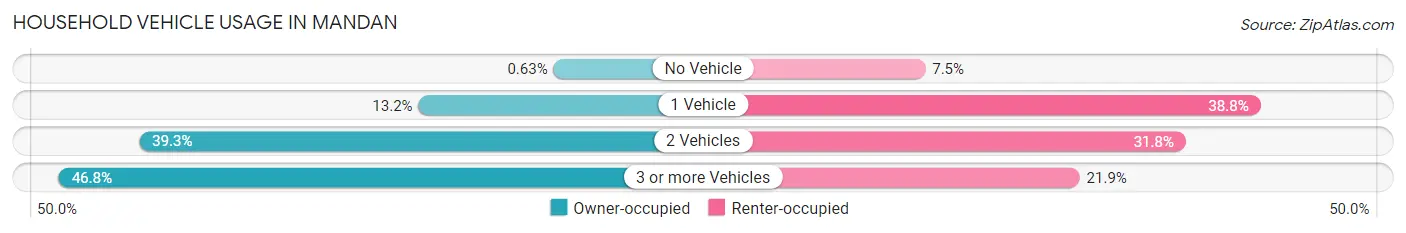
| Vehicles per Household | Owner-occupied | Renter-occupied |
| No Vehicle | 42 (0.6%) | 234 (7.5%) |
| 1 Vehicle | 877 (13.2%) | 1,211 (38.8%) |
| 2 Vehicles | 2,604 (39.3%) | 993 (31.8%) |
| 3 or more Vehicles | 3,101 (46.8%) | 684 (21.9%) |
| Total | 6,624 (100.0%) | 3,122 (100.0%) |
Real Estate & Mortgages in Mandan
Real Estate and Mortgage Overview in Mandan
| Characteristic | Without Mortgage | With Mortgage |
| Housing Units | 2,604 | 4,020 |
| Median Property Value | $221,100 | $263,200 |
| Median Household Income | $81,845 | $947 |
| Monthly Housing Costs | $596 | $293 |
| Real Estate Taxes | $2,442 | $38 |
Property Value by Mortgage Status in Mandan
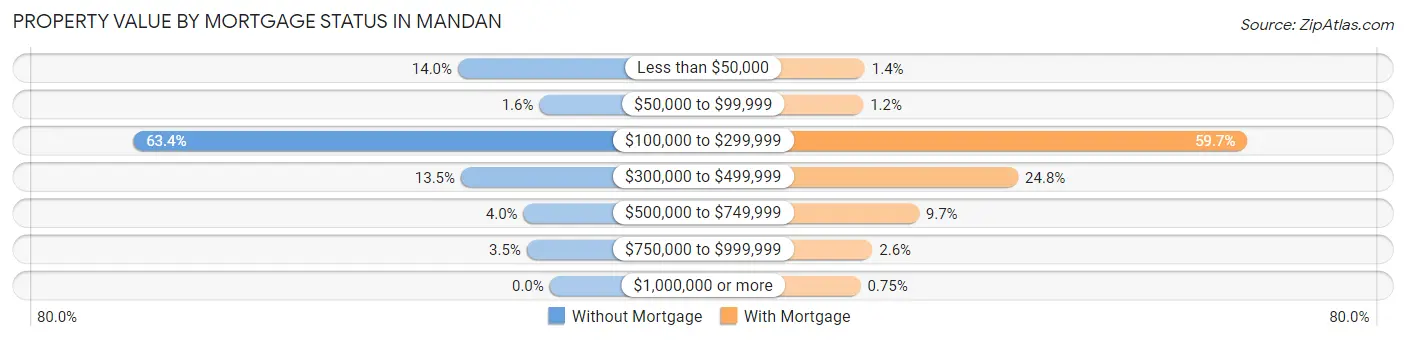
| Property Value | Without Mortgage | With Mortgage |
| Less than $50,000 | 364 (14.0%) | 57 (1.4%) |
| $50,000 to $99,999 | 41 (1.6%) | 47 (1.2%) |
| $100,000 to $299,999 | 1,652 (63.4%) | 2,399 (59.7%) |
| $300,000 to $499,999 | 352 (13.5%) | 996 (24.8%) |
| $500,000 to $749,999 | 104 (4.0%) | 388 (9.7%) |
| $750,000 to $999,999 | 91 (3.5%) | 103 (2.6%) |
| $1,000,000 or more | 0 (0.0%) | 30 (0.7%) |
| Total | 2,604 (100.0%) | 4,020 (100.0%) |
Household Income by Mortgage Status in Mandan
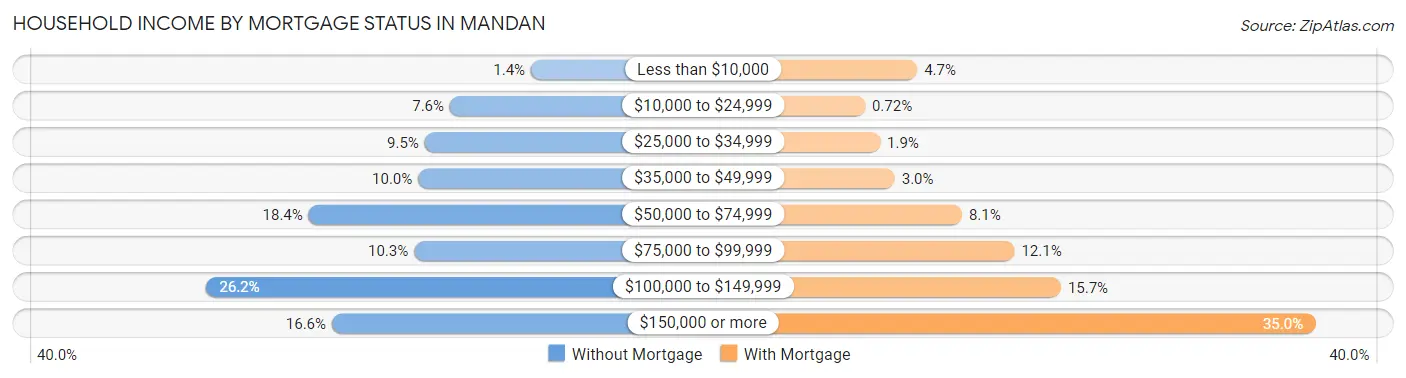
| Household Income | Without Mortgage | With Mortgage |
| Less than $10,000 | 37 (1.4%) | 189 (4.7%) |
| $10,000 to $24,999 | 198 (7.6%) | 29 (0.7%) |
| $25,000 to $34,999 | 248 (9.5%) | 75 (1.9%) |
| $35,000 to $49,999 | 261 (10.0%) | 120 (3.0%) |
| $50,000 to $74,999 | 478 (18.4%) | 326 (8.1%) |
| $75,000 to $99,999 | 269 (10.3%) | 487 (12.1%) |
| $100,000 to $149,999 | 681 (26.2%) | 629 (15.7%) |
| $150,000 or more | 432 (16.6%) | 1,407 (35.0%) |
| Total | 2,604 (100.0%) | 4,020 (100.0%) |
Property Value to Household Income Ratio in Mandan
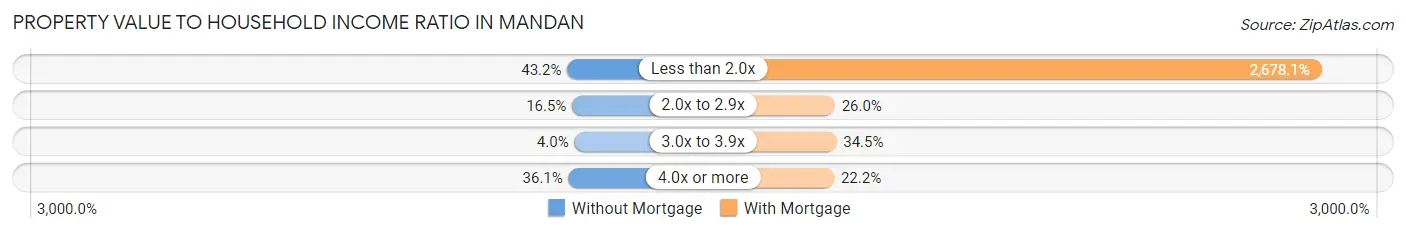
| Value-to-Income Ratio | Without Mortgage | With Mortgage |
| Less than 2.0x | 1,124 (43.2%) | 107,661 (2,678.1%) |
| 2.0x to 2.9x | 430 (16.5%) | 1,047 (26.0%) |
| 3.0x to 3.9x | 105 (4.0%) | 1,387 (34.5%) |
| 4.0x or more | 939 (36.1%) | 892 (22.2%) |
| Total | 2,604 (100.0%) | 4,020 (100.0%) |
Real Estate Taxes by Mortgage Status in Mandan
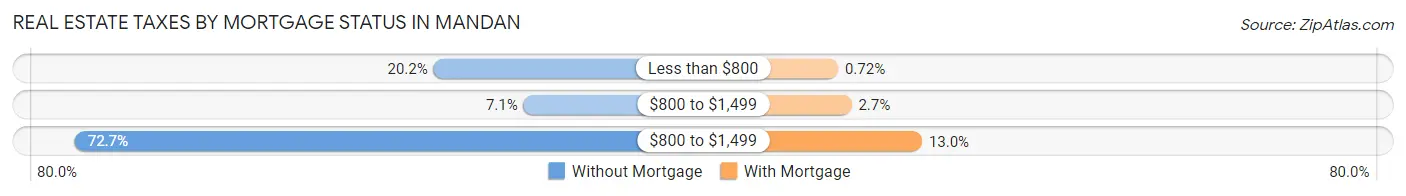
| Property Taxes | Without Mortgage | With Mortgage |
| Less than $800 | 527 (20.2%) | 29 (0.7%) |
| $800 to $1,499 | 185 (7.1%) | 108 (2.7%) |
| $800 to $1,499 | 1,892 (72.7%) | 522 (13.0%) |
| Total | 2,604 (100.0%) | 4,020 (100.0%) |
Health & Disability in Mandan
Health Insurance Coverage by Age in Mandan
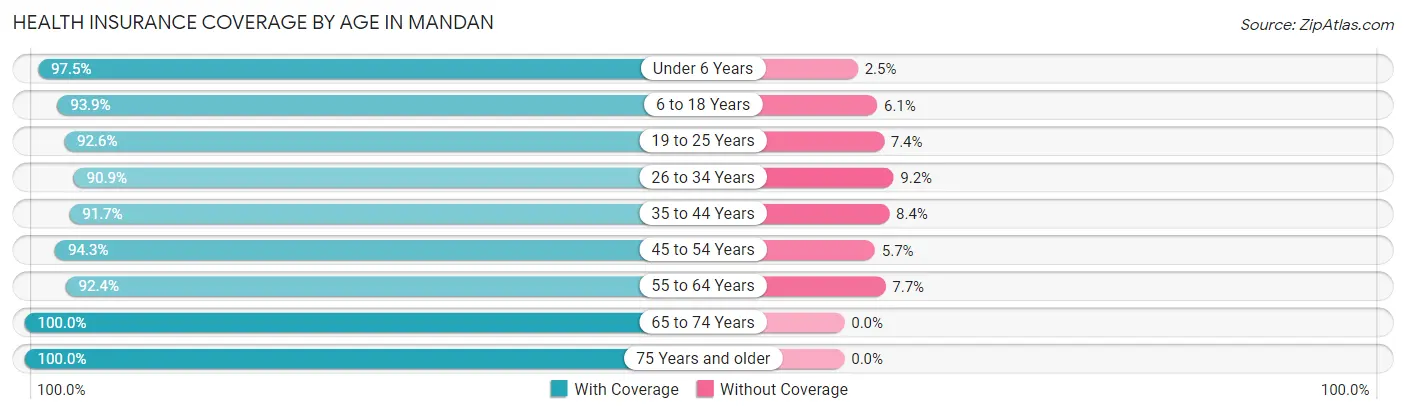
| Age Bracket | With Coverage | Without Coverage |
| Under 6 Years | 1,753 (97.5%) | 45 (2.5%) |
| 6 to 18 Years | 3,658 (93.9%) | 238 (6.1%) |
| 19 to 25 Years | 2,416 (92.6%) | 192 (7.4%) |
| 26 to 34 Years | 2,831 (90.8%) | 285 (9.1%) |
| 35 to 44 Years | 2,964 (91.6%) | 270 (8.4%) |
| 45 to 54 Years | 2,652 (94.3%) | 160 (5.7%) |
| 55 to 64 Years | 2,451 (92.3%) | 203 (7.6%) |
| 65 to 74 Years | 2,362 (100.0%) | 0 (0.0%) |
| 75 Years and older | 1,098 (100.0%) | 0 (0.0%) |
| Total | 22,185 (94.1%) | 1,393 (5.9%) |
Health Insurance Coverage by Citizenship Status in Mandan
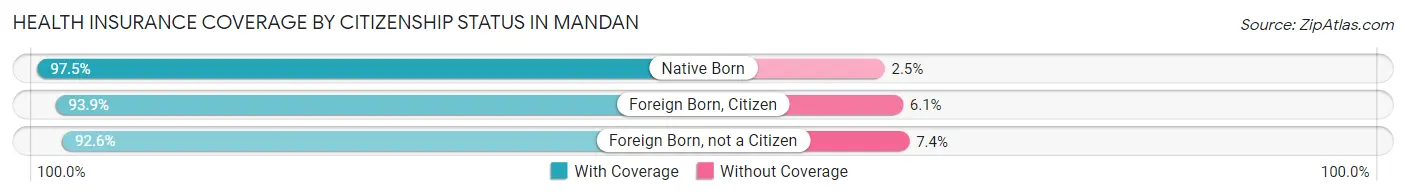
| Citizenship Status | With Coverage | Without Coverage |
| Native Born | 1,753 (97.5%) | 45 (2.5%) |
| Foreign Born, Citizen | 3,658 (93.9%) | 238 (6.1%) |
| Foreign Born, not a Citizen | 2,416 (92.6%) | 192 (7.4%) |
Health Insurance Coverage by Household Income in Mandan
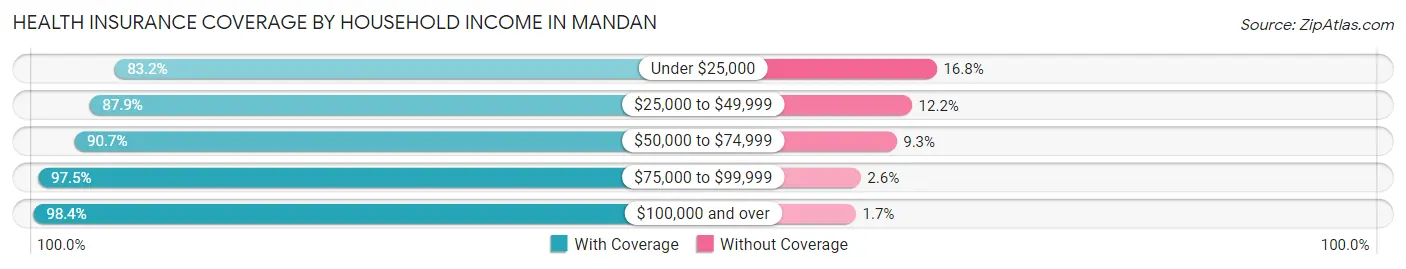
| Household Income | With Coverage | Without Coverage |
| Under $25,000 | 1,724 (83.2%) | 348 (16.8%) |
| $25,000 to $49,999 | 3,094 (87.8%) | 428 (12.1%) |
| $50,000 to $74,999 | 3,434 (90.7%) | 351 (9.3%) |
| $75,000 to $99,999 | 3,293 (97.5%) | 86 (2.5%) |
| $100,000 and over | 10,563 (98.4%) | 177 (1.7%) |
Public vs Private Health Insurance Coverage by Age in Mandan
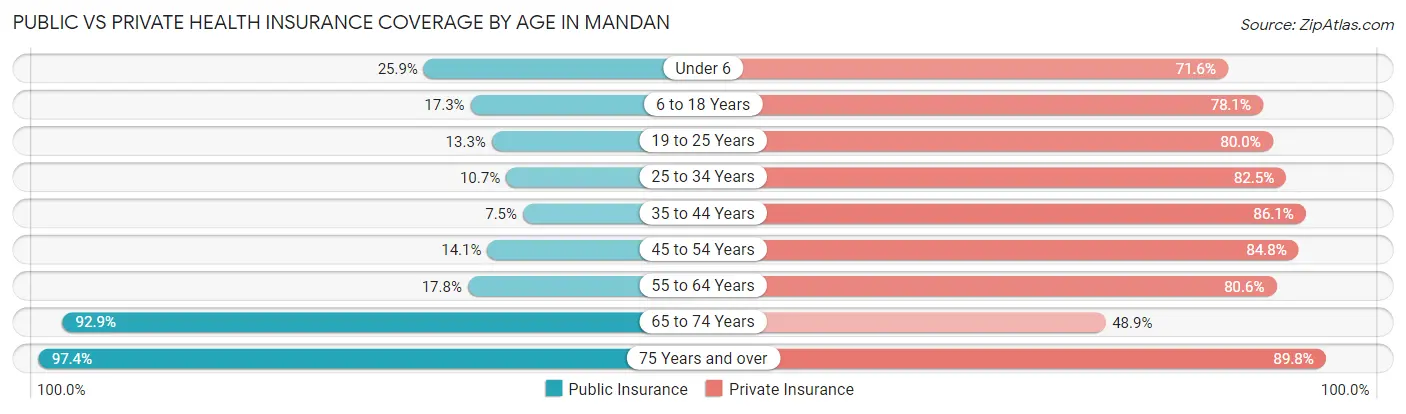
| Age Bracket | Public Insurance | Private Insurance |
| Under 6 | 466 (25.9%) | 1,288 (71.6%) |
| 6 to 18 Years | 672 (17.2%) | 3,044 (78.1%) |
| 19 to 25 Years | 347 (13.3%) | 2,085 (79.9%) |
| 25 to 34 Years | 332 (10.6%) | 2,569 (82.5%) |
| 35 to 44 Years | 243 (7.5%) | 2,784 (86.1%) |
| 45 to 54 Years | 397 (14.1%) | 2,384 (84.8%) |
| 55 to 64 Years | 471 (17.7%) | 2,140 (80.6%) |
| 65 to 74 Years | 2,195 (92.9%) | 1,155 (48.9%) |
| 75 Years and over | 1,069 (97.4%) | 986 (89.8%) |
| Total | 6,192 (26.3%) | 18,435 (78.2%) |
Disability Status by Sex by Age in Mandan
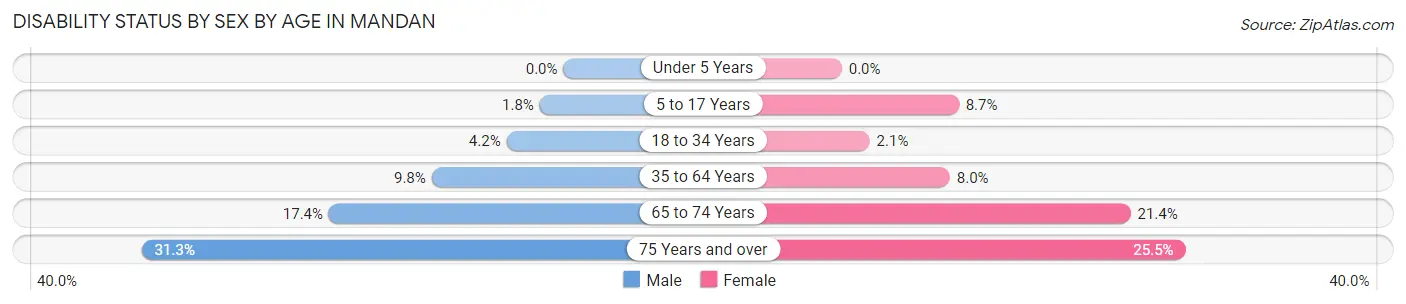
| Age Bracket | Male | Female |
| Under 5 Years | 0 (0.0%) | 0 (0.0%) |
| 5 to 17 Years | 37 (1.8%) | 170 (8.7%) |
| 18 to 34 Years | 135 (4.2%) | 57 (2.1%) |
| 35 to 64 Years | 446 (9.8%) | 332 (8.0%) |
| 65 to 74 Years | 196 (17.4%) | 265 (21.4%) |
| 75 Years and over | 145 (31.3%) | 162 (25.5%) |
Disability Class by Sex by Age in Mandan
Disability Class: Hearing Difficulty
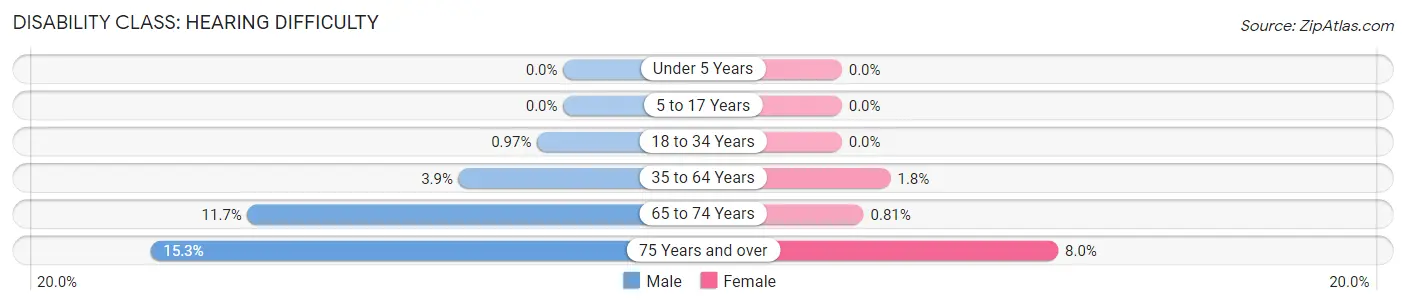
| Age Bracket | Male | Female |
| Under 5 Years | 0 (0.0%) | 0 (0.0%) |
| 5 to 17 Years | 0 (0.0%) | 0 (0.0%) |
| 18 to 34 Years | 31 (1.0%) | 0 (0.0%) |
| 35 to 64 Years | 177 (3.9%) | 75 (1.8%) |
| 65 to 74 Years | 132 (11.7%) | 10 (0.8%) |
| 75 Years and over | 71 (15.3%) | 51 (8.0%) |
Disability Class: Vision Difficulty
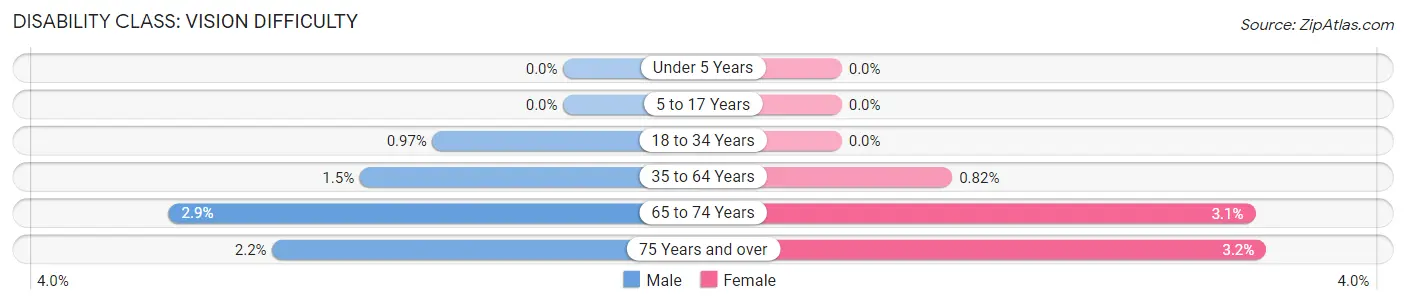
| Age Bracket | Male | Female |
| Under 5 Years | 0 (0.0%) | 0 (0.0%) |
| 5 to 17 Years | 0 (0.0%) | 0 (0.0%) |
| 18 to 34 Years | 31 (1.0%) | 0 (0.0%) |
| 35 to 64 Years | 69 (1.5%) | 34 (0.8%) |
| 65 to 74 Years | 33 (2.9%) | 38 (3.1%) |
| 75 Years and over | 10 (2.2%) | 20 (3.2%) |
Disability Class: Cognitive Difficulty
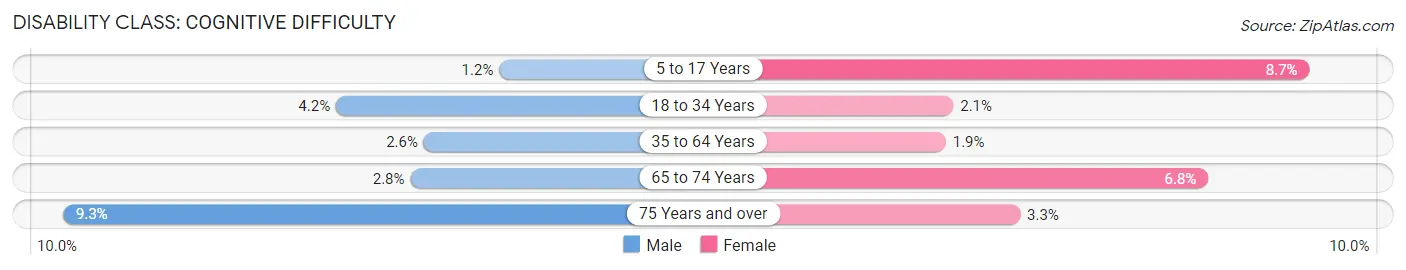
| Age Bracket | Male | Female |
| 5 to 17 Years | 25 (1.2%) | 170 (8.7%) |
| 18 to 34 Years | 135 (4.2%) | 57 (2.1%) |
| 35 to 64 Years | 118 (2.6%) | 80 (1.9%) |
| 65 to 74 Years | 32 (2.8%) | 84 (6.8%) |
| 75 Years and over | 43 (9.3%) | 21 (3.3%) |
Disability Class: Ambulatory Difficulty
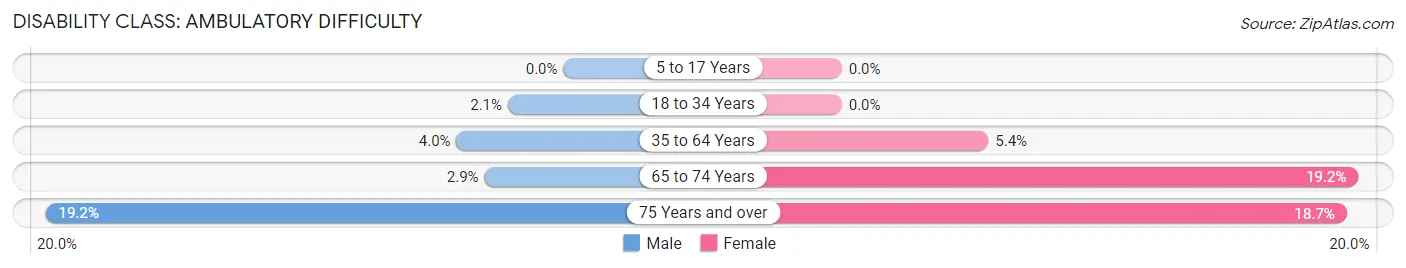
| Age Bracket | Male | Female |
| 5 to 17 Years | 0 (0.0%) | 0 (0.0%) |
| 18 to 34 Years | 66 (2.1%) | 0 (0.0%) |
| 35 to 64 Years | 181 (4.0%) | 225 (5.4%) |
| 65 to 74 Years | 33 (2.9%) | 237 (19.2%) |
| 75 Years and over | 89 (19.2%) | 119 (18.7%) |
Disability Class: Self-Care Difficulty
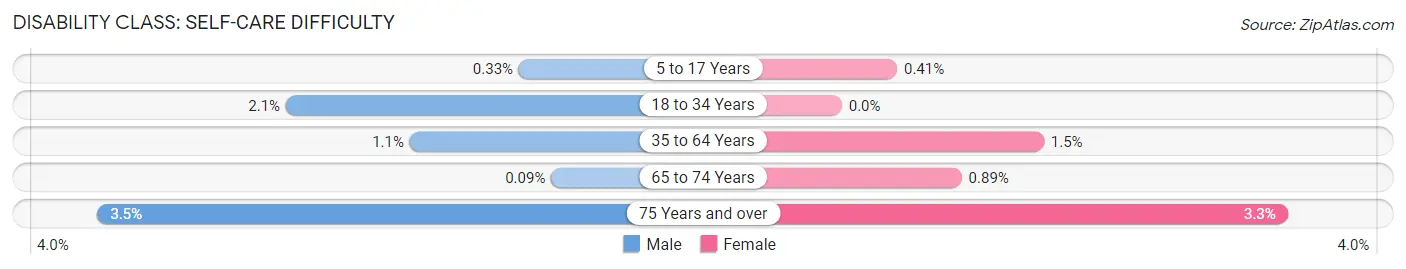
| Age Bracket | Male | Female |
| 5 to 17 Years | 7 (0.3%) | 8 (0.4%) |
| 18 to 34 Years | 66 (2.1%) | 0 (0.0%) |
| 35 to 64 Years | 52 (1.1%) | 62 (1.5%) |
| 65 to 74 Years | 1 (0.1%) | 11 (0.9%) |
| 75 Years and over | 16 (3.5%) | 21 (3.3%) |
Technology Access in Mandan
Computing Device Access in Mandan
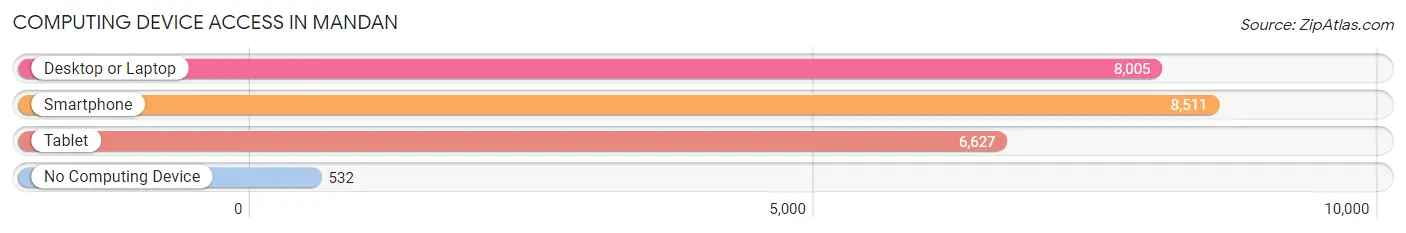
| Device Type | # Households | % Households |
| Desktop or Laptop | 8,005 | 82.1% |
| Smartphone | 8,511 | 87.3% |
| Tablet | 6,627 | 68.0% |
| No Computing Device | 532 | 5.5% |
| Total | 9,746 | 100.0% |
Internet Access in Mandan
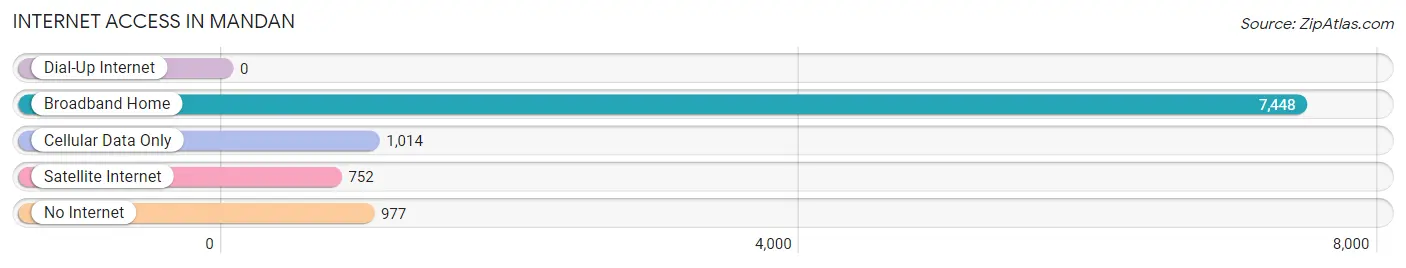
| Internet Type | # Households | % Households |
| Dial-Up Internet | 0 | 0.0% |
| Broadband Home | 7,448 | 76.4% |
| Cellular Data Only | 1,014 | 10.4% |
| Satellite Internet | 752 | 7.7% |
| No Internet | 977 | 10.0% |
| Total | 9,746 | 100.0% |
Mandan Summary
Mandan, North Dakota is a city located in the south-central region of the state, in Morton County. It is the county seat and the largest city in the county, with a population of 18,331 as of the 2010 census. The city is situated on the west bank of the Missouri River, just north of the state capital of Bismarck.
History
Mandan was first settled in 1879 by the Northern Pacific Railroad, and was named after the Mandan Native American tribe. The city was incorporated in 1881, and was the first permanent settlement in the area. The city quickly grew, and by the turn of the century, it had become a major trading center for the region.
In the early 1900s, the city was a major hub for the Northern Pacific Railroad, and it was also home to several large businesses, including a flour mill, a brickyard, and a brewery. The city was also home to a large number of immigrants, including Germans, Norwegians, and Poles.
Geography
Mandan is located in the south-central region of North Dakota, in Morton County. It is situated on the west bank of the Missouri River, just north of the state capital of Bismarck. The city has a total area of 8.3 square miles, all of which is land.
The city is located in the Missouri Plateau region of the Great Plains, and is characterized by rolling hills and flat plains. The city is located in the Central Flyway, and is home to a variety of bird species, including bald eagles, hawks, and owls.
Economy
Mandan’s economy is largely based on agriculture, manufacturing, and services. The city is home to several large employers, including the Morton County School District, the North Dakota State Hospital, and the North Dakota Department of Transportation.
The city is also home to several large manufacturing companies, including the Mandan Manufacturing Company, which produces agricultural equipment, and the Mandan Refinery, which produces petroleum products.
The city is also home to several retail stores, including Walmart, Target, and Kmart. The city is also home to several restaurants, including Applebee’s, Olive Garden, and Red Lobster.
Demographics
As of the 2010 census, the population of Mandan was 18,331. The racial makeup of the city was 94.3% White, 0.7% African American, 1.2% Native American, 0.7% Asian, 0.1% Pacific Islander, 1.2% from other races, and 2.0% from two or more races. Hispanic or Latino of any race were 3.2% of the population.
The median income for a household in the city was $45,945, and the median income for a family was $54,945. The per capita income for the city was $22,945. About 8.3% of families and 11.2% of the population were below the poverty line, including 15.2% of those under age 18 and 8.2% of those age 65 or over.
Common Questions
What is Per Capita Income in Mandan?
Per Capita income in Mandan is $43,749.
What is the Median Family Income in Mandan?
Median Family Income in Mandan is $105,530.
What is the Median Household income in Mandan?
Median Household Income in Mandan is $78,077.
What is Income or Wage Gap in Mandan?
Income or Wage Gap in Mandan is 21.3%.
Women in Mandan earn 78.7 cents for every dollar earned by a man.
What is Inequality or Gini Index in Mandan?
Inequality or Gini Index in Mandan is 0.45.
What is the Total Population of Mandan?
Total Population of Mandan is 24,049.
What is the Total Male Population of Mandan?
Total Male Population of Mandan is 12,374.
What is the Total Female Population of Mandan?
Total Female Population of Mandan is 11,675.
What is the Ratio of Males per 100 Females in Mandan?
There are 105.99 Males per 100 Females in Mandan.
What is the Ratio of Females per 100 Males in Mandan?
There are 94.35 Females per 100 Males in Mandan.
What is the Median Population Age in Mandan?
Median Population Age in Mandan is 35.6 Years.
What is the Average Family Size in Mandan
Average Family Size in Mandan is 2.9 People.
What is the Average Household Size in Mandan
Average Household Size in Mandan is 2.4 People.
How Large is the Labor Force in Mandan?
There are 14,029 People in the Labor Forcein in Mandan.
What is the Percentage of People in the Labor Force in Mandan?
73.1% of People are in the Labor Force in Mandan.
What is the Unemployment Rate in Mandan?
Unemployment Rate in Mandan is 2.0%.